Tricarboxylic acid cycle and its control
Mitochondrial oxidation—the electron transport chain
ATP synthesis—the chemiosmotic theory
ATP synthesis—uses of the proton motive force
Storage of glucose—glycogen breakdown and synthesis
Regulation of glycogen synthesis and breakdown
Cellular organization of metabolism
Endoplasmic reticulum and Golgi apparatus
Protection of cells against reactive oxygen species
Integration and regulation of metabolism
Cellular metabolic response to feeding
Cellular metabolic response to fasting and starvation
Cellular metabolic response to exercise
• All animals need food, both for energy and for the (precursors to) building blocks for growth
• This food comes from hunting and scavenging in a competitive environment
• The pathways of metabolism have evolved to waste as little as possible of these precious resources
• Metabolic pathways are regulated to avoid inappropriate actions and opposing pathways running simultaneously (‘futile cycling’)
• Humans are no different except, for most of us, work and shopping have replaced hunting
• Eating is intermittent and so the body needs to have mechanisms to store energy in easy releasable forms (e.g. fat, glycogen).
A series of chemical reactions catalysed by enzymes:
• Catabolism—breakdown of compounds to release energy; usually involves oxidation
• Anabolism—biosynthesis of more complex compounds from small precursors, usually consumes energy and involves reduction.
• Entropy is the degree of chaos or randomness in a system
• Reactions can only proceed if there is an overall increase in entropy
• Free energy is the energy in a system available for useful work, usually expressed at standard conditions
• The difference in free energy for a reaction (ΔG) gives an idea of whether a reaction will proceed
• A negative ΔG means that a reaction will proceed
• A ΔG of zero means that a reaction is at equilibrium
• Reactions with a positive ΔG can be driven by linking to another reaction, so that the sum of the total ΔGs is negative.
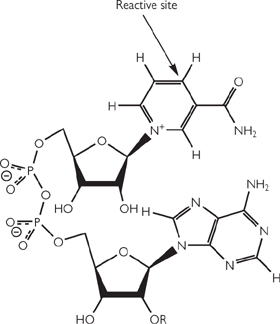
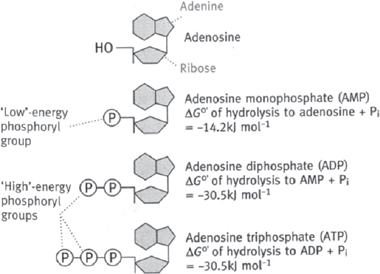
It is not feasible to directly, physically link reactions that produce and consume energy, and so it is necessary to have a short-term way to trap that energy. The molecule ATP is the universal cellular currency of energy (Fig. 2.1). ATP is present in cells complexed with Mg2+.
• There are 30.5kJ mol–1 of energy stored in each of the phosphate–phosphate bonds
• The phosphate–ribose sugar bond only has 14.2kJ mol–1, and so the hydrolysis of AMP to adenosine is not used as a source of energy in metabolic reactions
ATP can be hydrolysed in a number of ways:
• ATP → AMP + PPi (NB energy release comes from the hydrolysis of PPi → 2Pi)
• In all cases, the energy released can be used to drive reactions with a positive ΔG
• ATP is only present in cells in small amounts
• At rest, the daily ATP turnover is approximately 40kg (and can be as high as 0.5kg min–1 during exercise)
• Therefore, there must be mechanisms to quickly regenerate ATP to match cellular usage.
Electrons can also be stored in reduced intermediates such as NADH and FADH2 which are important in both the generation of ATP by the electron transport chain and biosynthetic reactions.
• Some biosynthetic reactions use NADPH instead of NADH e.g. fatty acid synthesis.
Oxidation is the end-point for metabolic fuels.
• Ultimately, compounds enter the TCA cycle, resulting in the production of NADH and FADH2 and CO2. NADH and FADH2 are reoxidized in the electron transport chain to produce ATP.
Fig. 2.1 Diagrammatic representation of adenosine and its phosphorylated derivatives.
Being able to control the rate at which metabolic pathways proceed is essential to ensure that:
• Forward and reverse pathways are not run simultaneously (‘futile cycling’).
Control over enzyme activity can be both:
• Allosteric effects: the binding of molecules to enzymes affecting their catalytic rate (milliseconds)
• Covalent modification such as phosphorylation (seconds to minutes)
• Changes in enzyme protein levels (induction/suppression) (hours to days).
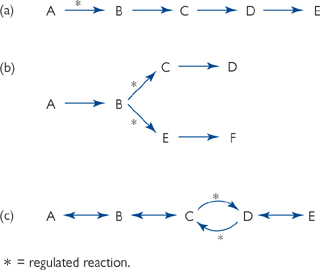
Points in a metabolic pathway which are suitable for control:
• Regulated reactions are often those which are essentially irreversible (for energetic reasons)
• Regulation often takes place (Fig. 2.2):
• Reciprocally, at bi-directional points, where there is a different enzyme for the forward and reverse directions.
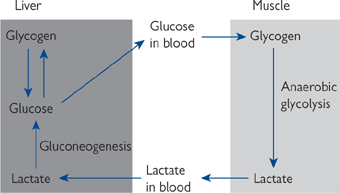
In addition to cellular compartmentalization being an important feature of metabolic pathways, there is also a sharing of metabolic load between organs of the body. One good example of this is the Cori cycle (see Fig. 2.3).
• These types of inter-organ cycles have multiple levels of potential control, including:
• The delivery of substrates to different organs by the circulation
• The rate at which substrates cross cell membranes via membrane transporters
• Regulation of enzyme function in the cells.
Metabolic control can be described as being either:
• Intrinsic i.e. brought about by changes in intracellular levels of (almost always) an allosteric regulator of an enzyme or
• Extrinsic i.e. brought about by signals originating outside the cell e.g. hormones
• Small changes in plasma hormone levels often have large effects on cell functions due to amplification cascades.
Fig. 2.2 Metabolic control: regulation.
Generally speaking:
• Breakdown (catabolic) reactions involve oxidation
• Synthetic (anabolic) reactions involve reduction
• Rather than being directly linked, intermediate molecules store/donate the electrons. For example, in glycolysis, glyceraldehyde-3-phosphate is oxidized while the intermediate NAD+ is reduced to NADH.
There are three main biological intermediates (Figs 2.4, 2.5):
• Nicotinamide adenine dinucleotide (NAD+)
• Flavin adenine dinucleotide (FAD)
• Nicotinamide adenine dinucleotide phosphate (NADP+).
Compartmentalization allows controlled oxidation and reduction reactions to occur in the same cell.
• Most of the NAD+ and FAD are unreduced and in the mitochondria (ideal for oxidative reactions)
• In contrast, most NADP+ is in the reduced form NADPH in the cytosol, where it participates in reactions involving reduction.
Fig. 2.4 Structures of the oxidized forms of nicotinamide-derived electron carriers: NAD+ (R = H) and NADP+ ( ).
).
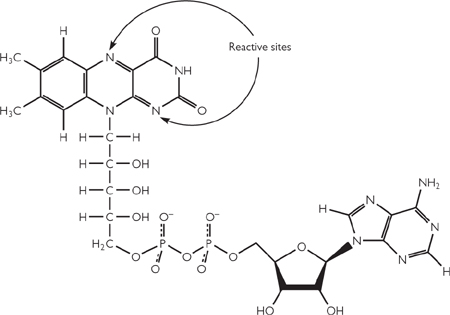
Fig. 2.5 Structure of the oxidized form of flavin adenine dinucleotide (FAD).
Food intake ( OHCM8 p.236) is not a continuous process, and so the body must be able to store energy. Energy can be stored in a variety of ways, listed in order of use:
• Glucose in plasma (3L with an average concentration of 5mM)
• Glucose is stored as the polymer, glycogen, in all cells but the two major sites are:
 Liver (10% of total tissue mass): used to maintain blood glucose during short periods of fasting; enough stores for about 24h at rest
Skeletal muscle (2% of muscle mass): only used by muscle itself during exercise
• The majority of lipid is stored in adipose tissue (fat cells)
Fat accounts for about 15kg of a typical 70kg man
Fat is a highly compact energy store (over 300-fold more energy in body fat stores than in liver glycogen)
Enough fat stores for about 3 months
• Protein is not a classical energy store but can be used in extreme starvation conditions when other stores have been exhausted
Skeletal muscle is the major store of mobilizable protein
Loss of protein from heart, kidney, and liver compromises their function and will ultimately lead to death.
• Constitutes 35–45% of our daily energy intake: 60% from starch, 35% in Western diet from sucrose (‘sugar’)
• 40–50% of our daily energy requirement: mostly ingested as triacylglycerides
• 7–10% of energy requirements needed from protein intake (Western diet supplies about 15%)
• About 35g minimum required per day to maintain nitrogen balance (i.e. to ingest as much nitrogen as we excrete)
• Carbohydrate-free diets (such as the ‘Atkins diet’) work by tricking the body into starvation mode ( OHCM8 p.166), with energy obtained from protein and fat metabolism due to the prevailing glucagon signal. As with all diets, for it to be effective, energy intake must be less than energy expenditure.
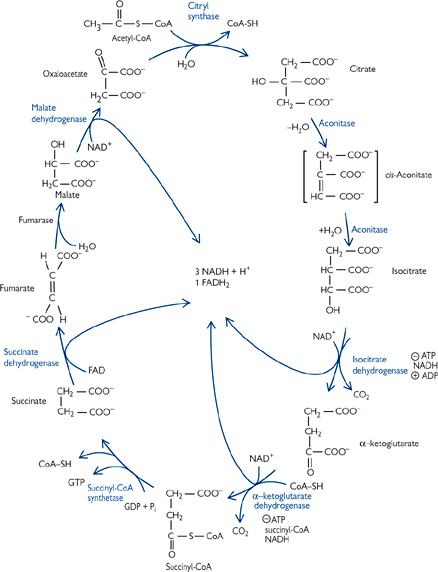
The TCA cycle is the common pathway for the oxidation of fuel molecules.
• Also known as the Krebs cycle (after its discoverer) or the citric acid cycle
• It is a cyclic pathway (Fig. 2.6): intermediates are regenerated so that net amounts of each remain the same after each turn of the cycle
• Intermediates present in relatively small amounts, and essentially play a catalytic role
• Many intermediates are starting points for biosynthetic pathways. Anapleurotic reactions fill up the cycle to replace any of the intermediates used in this way.
• The reactions of the TCA cycle take place in the mitochondrial matrix
• Pyruvate enters the mitochondria on a specific transporter in the inner mitochondrial membrane (IMM)
• Entry point into the TCA cycle is the compound acetyl-CoA
• Acetyl-CoA is formed from pyruvate (the end-point of glycolysis; OHCM8 p.128) by the link reaction in Fig. 2.7.
• Acetyl-CoA can also come from fatty acid breakdown ( OHCM8 p.116) or the carbon skeletons of amino acids ( p.151)
• PDH is inhibited directly by high levels of acetyl-CoA and NADH, and indirectly by ATP, acetyl-CoA, and NADH (via activation of PDH kinase, which phosphorylates PDH and inactivates it; PDH kinase is inactivated by PDH substrates pyruvate, CoA-SH and NAD+). Inhibition of PDH is relieved through dephosphorylation by phosphoprotein phosphatase.
• The rate of TCA cycling matches the cellular demand for ATP, and not the availability of substrates
• The main regulated enzymes are isocitrate dehydrogenase (inhibited by ATP, NADH; activated by ADP) and α-ketoglutarate dehydrogenase (inhibited by ATP, NADH, succinyl CoA)
TCA cycle is therefore inhibited when the cell has no need for further ATP synthesis, and activated when it needs to make more ATP
• The regulated TCA enzymes are also activated by a rise in intra-mitochondrial Ca2+
PDH (via dephosphorylation by Ca2+-activated phosphoprotein phosphatase), isocitrate dehydrogenase, and α-ketoglutarate dehydrogenase directly
The rise in Ca2+ could be caused by adrenaline (‘flight or fight’ response) or increased muscle contraction. Both of these situations will increase ATP consumption, so the TCA cycle is stimulated to increase ATP synthesis.
Fig. 2.6 Complete citric acid cycle.
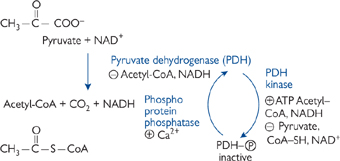
Fig. 2.7 Formation of acetyl-CoA from pyruvate.
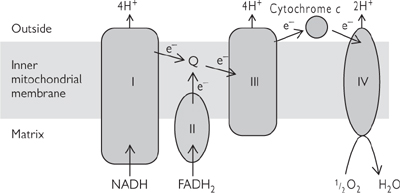
The ETC converts the electrons stored as reduced intermediates NADH and FADH2 into a proton motive force (PMF) across the internal mitochondrial membrane (IMM). Reactions occur through sequential oxidation/reduction centres containing transition metals (Fe in haem, Fe-S, Cu2+ in cytochrome oxidase) embedded in large protein complexes (Fig. 2.8).
• The large protein complexes will only move relatively slowly in the lipid bilayer
• Coenzyme Q and cytochrome C are small, highly mobile electron carriers that transport electrons from one complex to another
• The reaction centres have increasing redox potential
• Three of the four complexes are also proton pumps: for each pair of electrons, complex I extrudes 4H+ from the matrix; complex III, 4H+; and complex IV, 2H+. Complex II does not pump protons when it transfers electrons from FADH2 to coenzyme Q
• Thus, for each NADH oxidized, 10H+ are extruded; and, for each FADH2, 6H+
• The ultimate electron acceptor is molecular oxygen, which is reduced to water.
Although most NADH is formed in the mitochondria during the TCA cycle ( p.106), it is also formed cytoplasmically e.g. in glycolysis ( p.128).
• There is no direct pathway for NADH to cross the IMM to enter the ETC. If there was, this would destroy the distinct oxidative/reductive compartments of the cell
• NADH can effectively cross the membrane by means of the malate/aspartate shuttle (Fig. 2.9)
• When cytoplasmic NADH is low, the glycerol-3-phosphate shuttle may be used (Fig. 2.10)
• Electrons enter the ETC at the level of FADH2 and so get less ATP per original NADH than with the malate/aspartate shuttle.
Fig. 2.8 The electron transport chain.
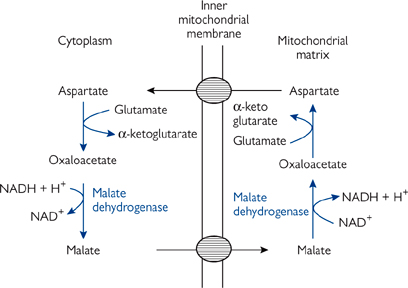
Fig. 2.9 Malate–aspartate shuttle.
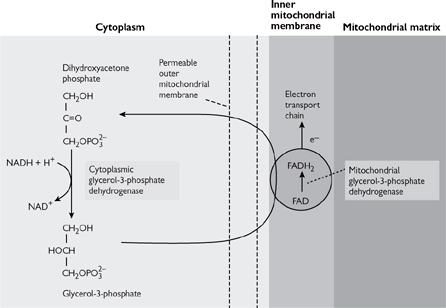
Fig. 2.10 Glycerol-3-phosphate shuttle.
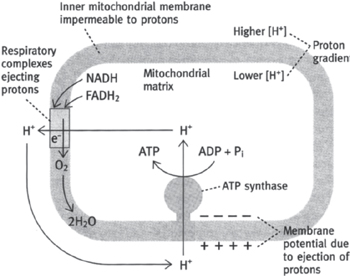
The chemiosmotic theory (Fig. 2.11) was proposed by Peter Mitchell1 in 1961 and is based on the following premise:
• The IMM is impermeable to protons, hence the mitochondrial matrix is a closed environment
• The proton pumping of the ETC complexes ( p.106) leads to the generation of the PMF (total magnitude of 0.224V)
• The PMF provides the energy for ATP synthesis
• Evidence: agents that collapse this PMF inhibit ATP formation
These compounds are weak lipophilic acids that carry protons across the IMM, e.g. 2,4-dinitrophenol and salicylic acid
• Proton flow through the ATP synthase protein (F0F1-ATPase, complex V) drives ATP synthesis ( p.110).
Electrons cannot flow through the ETC unless ADP is simultaneously phosphorylated to ATP.
• The most significant controlling factor for electron flow is the availability of ADP for conversion to ATP. In this way, the ADP concentration exercises what is known as ‘respiratory control’.
It has been proposed that mitochondria were originally free-living bacteria which became incorporated into cells in a symbiotic relationship. This idea is supported by the fact that bacteria also use a PMF to drive uptake of nutrients across their cell wall.
• Some antibiotics are proton ionophores that kill bacteria by collapsing their PMF. One such example is the topical antifungal, nystatin ( OHPDT2 p.440).
Fig. 2.11 Generation of ATP in mitochondria by the chemiosmotic mechanism.
The PMF across the IMM can be used to drive a number of processes.
The impermeability of the IMM to protons, except through the protein responsible for ATP synthesis, is a key feature of the chemiosmotic theory.
• This protein is known as the F0F1-ATPase, ATP synthase, or complex V (Fig. 2.12)
• The F0 subunit is an integral membrane protein which forms a proton channel
• F1 is a complex (α3, β3, γ, δ, and ε) that has the catalytic site for ATP synthesis
• The F0 and F1 subunits are functionally linked, such that protons can only flow when ATP is being synthesized (dependent on [ADP] = ‘respiratory control’).
The movement of protons through the F0 subunit induces the F1 subunit to physically rotate.
• This is proposed to propel the binding sites through their different transition states of loose (ADP+Pi), tight (ADP+Pi), and ATP release. Therefore it takes three protons to make one ATP by the ATP synthase (Fig. 2.13).
The F1 subunit can be dissociated from the F0 subunit by protease activity.
• When not linked to the F1, it can act as an ATPase
• ATP hydrolysis will drive the rotation of the F1 subunit. This is shown experimentally by attaching a fluorescent actin filament and seeing it rotate (‘the world’s smallest motor’).
The proton gradient is also used to drive the movement of compounds through specific transporters in the IMM.
• Most ATP is made in the mitochondrial matrix, yet is needed in the cytoplasm; conversely, most ADP is formed in the cytoplasm, but regenerated in the matrix
• An obligatory ATP/ATP exchanger (the adenosine nucleotide translocase, ANT) is present in the IMM. Although not proton-coupled, due to the fact that ATP is more negative than ADP (4– vs. 3–), it is driven by the membrane potential component of the PMF
• Pi is also required in the matrix for ATP synthesis (although most will be released from ATP hydrolysis in the cytoplasm)
• There is a H+/Pi co-transporter in the IMM, which effectively means that each ATP formed uses four protons. Hence 1 NADH = 2.5 ATP, 1 FADH2 = 1.5 ATP
• Pyruvate needs to cross the IMM to enter the TCA cycle
• There is a IMM pyruvate/H+ co-transporter
• Mitochondria also take up Ca2+ in response to a rise in intracellular levels
• Uptake will be electrogenically favourable due to the PMF
• Plays a part in regulating the TCA cycle ( p.104).
So far, it has been stressed that the only natural route by which the PMF can be dissipated is through the F0F1-ATPase and the synthesis of ATP.
• The only tissue for which this is not true is brown adipose tissue (‘brown fat’—brown due to its high mitochondria content)
• There is an uncoupling protein (thermogenin) in brown fat that allows the PMF to be dissipated without making ATP
• The energy is released as heat
• This is important in human babies, who cannot shiver to generate heat.
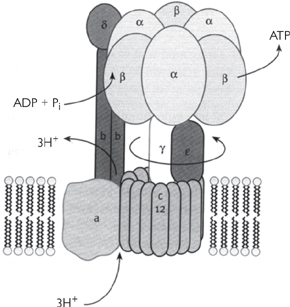
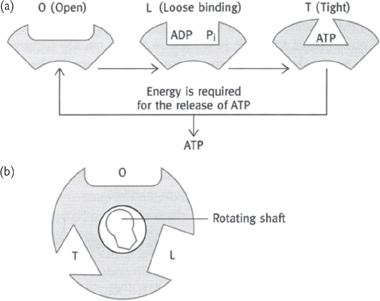
Fig. 2.13 The catalytic sites of ATP synthase as proposed in the Boyer model: (a) the changes that occur in a single site of one β subunit of F2 during the synthesis of ATP; (b) the three β subunits work in a co-operative manner and the conversion in one site is coordinated with that in the other two sites.
The daily turnover of ATP in the average 70kg man is approximately 40kg, yet cells contain relatively little ATP at any one time—it cannot be stored and ATP molecules have a half-life in the order of seconds. Therefore, ATP production must match usage. Intracellular ATP remains virtually constant.
Relative concentrations of:
• ADP controls the rate of ATP synthesis at a mitochondrial level through the process of respiratory control ( p.108). Unless there is ADP to make into ATP, the ETC does not run
• AMP is an important intracellular signal. As the normal intracellular concentration is very low, cells are very sensitive to even a small change
• When energy levels become lower, 2ADP → ATP + AMP
• A rise in AMP activates the glycolysis pathway via the PFK enzyme ( p.132) and stimulates cellular ATP production.
Fat is the long-term energy store for mammals.
• Fat constitutes about 20% of body weight of a well-nourished averagely sized individual (15kg out of 70kg)
• Fat has double the energy per gram dry weight than glycogen (39 vs. 18kJ g–1)
• In addition, fat has a low hydration level due to its hydrophobic nature
• If all the fat energy was stored as glycogen, body weight would be almost double!
• Energy release from fat is nowhere near as rapid as it is from glycogen due to the number of metabolic processes needed before it can enter the TCA cycle
• This is reflected in the way fat is used
• Contributes about 35% of total daily energy production.
As mentioned previously, release of energy stored in fat is not as rapid as from glycogen.
• Fat is a suitable energy supply for tissues with steady energy requirements.
• Cardiac muscle is almost exclusively aerobic (supported by high mitochondrial content)
• It has virtually no glycogen stores
• Cardiac muscle uses fatty acids (plus ketone bodies and lactate) for energy.
• Despite having large stores of glycogen, skeletal muscle uses fatty acids for about 85% of its energy needs while resting
• Glycogen breakdown provides glucose to generate energy during bursts of activity.
• The kidney has a very high energy requirement for the size of the organ
• Most energy is required in the cortex for reabsorption of filtered nutrients from the proximal convoluted tubule
• Fatty acids are the favoured fuel.
• Triacylglycerides from the diet are incorporated into micelles formed with the aid of bile salts in the intestinal lumen
• The triacylglycerides are broken down by luminal lipases into the constituent fatty acids and monoacylglycerides
• These can then cross the enterocyte cell wall via membrane transport proteins in the lipid bilayer
• Inside the enterocyte, they are reassembled and packaged into chylomicrons
• These are a mix of triacylglycerides, proteins (apolipoproteins, principally apoprotein B-48), and other lipids such as cholesterol
• Chylomicrons are also the vehicle for carrying fat-soluble vitamins
• Chylomicrons pass into the lymph system, which in turn drains into the venous circulation (into the vena cava near the heart)
• Peripheral tissues, especially adipose tissue and muscle, have membrane-bound lipoprotein lipases which once again break down the triacylglycerides into free fatty acids and monacylglycerides
• These can then be taken up into the cells (by a combination of diffusion and mediated transport)
• In adipose tissue, they will be resynthesized into triacylglycerides for storage
• In muscle, they will be oxidized for energy
• Free fatty acids can also be carried in the bloodstream, bound to albumin.
• Lipase activity in adipose tissue is regulated by the hormones glucagon, adrenaline, noradrenaline (norepinephrine), and adrenocorticotrophic hormone (ACTH). These hormones bind to G-protein coupled receptors (membrane proteins with seven transmembrane domains)
• These, in turn, activate adenylate cyclase, raising intracellular cAMP and activating PKA
• PKA phosphorylates triacylglycerol lipase, activating it to break down triacylglycerides
• The released fatty acids leave the cell and are transported to peripheral tissues bound to albumin in the plasma
• Conversely, insulin activates a phosphatase which dephosphorylates the lipase, thus inactivating it.
• Fatty acids are usually at a fairly low concentration (sub mM) under normal conditions
• Levels rise to about 1mM during starvation
• Ketone bodies are virtually absent under fed conditions
• This rises greatly (to around 5mM) during starvation
• In Type I diabetes, the uncontrolled production of ketones can cause metabolic acidosis ( OHCM8 p.634) ( p.170).
Once they have entered the cell, fatty acids will be oxidized in the mitochondrial matrix.
• On diffusing across the plasma membrane, the hydrophobic fatty acids associate with a cytoplasmic binding protein
• This complex moves to the mitochondrial membrane for uptake into matrix
• Medium-chain (C8–C10) fatty acids can cross the IMM directly.
Long-chain fatty acids need to be activated before they can cross the IMM.
• A CoA group is joined by a thioester linkage to the carboxyl group of the fatty acid
• Reaction driven by ATP hydrolysis
• Catalysed by acyl-CoA synthetase (also known as fatty acid thiokinase):
R-COO– + ATP + CoA-SH → R-CO-S-CoA + AMP+ PPi
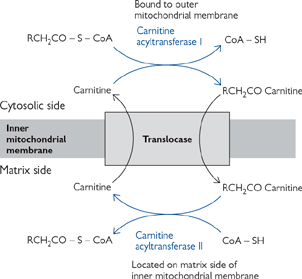
Activated fatty acids cannot cross the IMM unaided (Fig. 2.14).
• First, they are conjugated to carnitine, a zwitterionic alcohol, to form acyl carnitine
• This reaction is catalysed by carnitine acyl transferase
• Acyl carnitine crosses the IMM on a specific carrier, acyl carnitine translocase
• Acyl carnitine is exchanged for free carnitine
• This process is strongly inhibited by malonyl-CoA (thus preventing simultaneous fatty acid breakdown and synthesis; p.120)
• The acyl carnitine is reconverted to acyl-CoA and free carnitine in the mitochondrial matrix
• Reaction catalysed by carnitine acyl transferase II
• A number of diseases are linked to carnitine, acyl carnitine translocase, or acyl carnitine transferase deficiencies
• Carnitine deficiency leads to muscle weakness during long-term exercise (when fatty acids are an important source of energy)
Heart and kidney are also affected as they use fatty acids for the majority of their energy supply
Symptoms range from mild muscle cramps to severe weakness and even death.
Once in the mitochondrial matrix, acyl-CoA can be oxidized by the process known as β-oxidation (Fig. 2.15).
• Four-step cyclic reaction removes a C2 subunit in the form of acetyl-CoA. This can enter the TCA cycle → ATP
• There are different isoenzymes for reaction 1 depending on the length of the fatty acid being metabolized: very long-chain acyl-CoA dehydrogenase (VLCAD), long-chain (LCAD), medium-chain (MCAD), and short-chain (SCAD).
Fig. 2.14 Mechanism of transport of long chain fatty acyl groups into mitochondria where they are oxidized in the mitochondrial matrix.
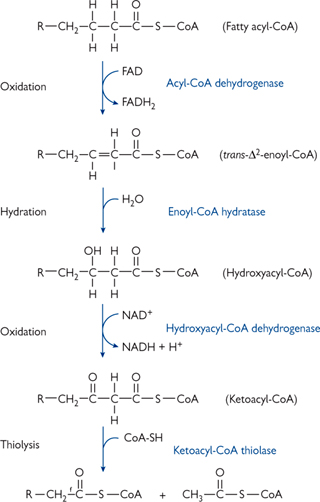
Fig. 2.15 One round of the four reactions of β-oxidation by which a fatty acyl-CoA is shortened by two carbon atoms with the production of a molecule of acetyl-CoA.
Not all fatty acids in our diet are of an even chain length.
• Although animals have even chain lengths (i.e. C2n), plants have an odd number of fatty acids
• β-oxidation eventually leaves a C3 unit (propionyl CoA). This is converted into the TCA cycle intermediate, succinyl-CoA.
Fatty acids can have differing degrees of saturation.
• One extra enzyme is required for monounsaturated fatty acid
• Normal rounds of β-oxidation occur until there is a cis-double bond between the C3 and C4 atoms
• An isomerase then rearranges the C=C bond so that it is trans-double bond between C2 and C3
This has formed the trans-enoyl-CoA compound on the β-oxidation pathway, which can continue as normal
• Any polyunsaturated fatty acid requires two extra enzymes, the isomerase plus a reductase
• β-oxidation rounds occur with the help of the isomerase until a fatty acid chain with a -C=C-C=C- (trans-double bond between C4 and C5 and cis-double bond between C2 and C3) is formed after the fatty acyl-CoA dehydrogenase step of β-oxidation
• This cannot be processed further without a reductase enzyme
The reductase utilizes NADPH to reduce this to -C-C=C-C- (trans-double bond between C3 and C4
This can then be isomerized to the trans-enoyl CoA (i.e. cis-double bond between C2 and C3) and metabolized (as previously for a monosaturated fatty acid).
• Known to be inherited diseases related to deficiencies in all of the acyl-CoA dehydrogenases
• Best characterized is deficiency in MCAD
• Thought to be one of the most common inborn errors of metabolism
• Symptoms include lethargy, vomiting, and often coma after fasting for more than 12h
Ketogenesis is blocked in liver by lack of β-oxidation of fatty acids
This in turn slows gluconeogenesis
Failure to be able to metabolize fat in muscle causes increase use of glucose, exasperating the hypoglycaemia
Medium-chain fatty acids metabolized by alternative pathways and excreted in urine (the disease can be diagnosed by urine analysis)
• Disorder can be managed by avoiding fasting
May be the cause of some cases of sudden infant death syndrome.
During times of plenty, the body will store energy. After the glycogen stores have been replenished (to ∼10% of liver weight), the liver switches to fat biosynthesis. Both excess sugars and amino acid carbon skeletons can be used to make fatty acids.
Fatty acids are made in the cytosol by a large complex of enzymes, collectively known as fatty acid synthase:
• Dimer of identical 260kDa subunits
• Each monomer has three domains joined by flexible linker regions
• Total of seven catalytic sites per subunit. The proximity of these sites allows intermediates to be handed efficiently from one active site to another without leaving the complex.
The reactions of fat synthesis are distinct from those of break down.
• Fatty acid synthase is located in the cytoplasm (break down in mitochondrial matrix)
• The intermediates of synthesis are covalently bound to the enzyme (rather than to CoA).
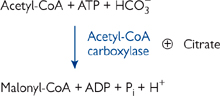
The committed step of fat synthesis is the carboxylation of acetyl-CoA to malonyl-CoA. This reaction is driven by ATP hydrolysis and thus effectively irreversible (Fig. 2.16).
• Biotin is an essential co-factor for acetyl-CoA carboxylase
• Allosterically activated by citrate.
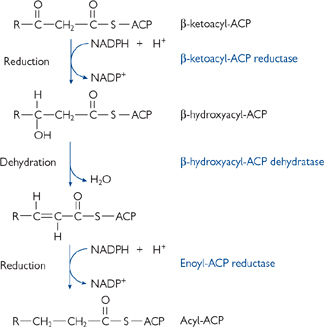
The reaction scheme is as follows (Fig. 2.17):
1. For the first round only, an acetyl-CoA is covalently linked to the acyl carrier protein (ACP), part of the fatty acid synthase protein monomer 1, via a flexible linker molecule (phosphopantetheine). It is then passed to the condensing enzyme (CE) in the other monomer (2)
2. Malonyl-CoA is covalently joined to the ACP of monomer 1
3. There follows a series of four reactions: condensation, reduction (with NADPH as the reductant), dehydration, and a final reduction (again using NADPH) (Figs 2.17, 2.18)
4. The elongated chain is transferred to the CE of monomer 1, and another malonyl-CoA is covalently linked to the ACP of monomer 2
• Further rounds continue until a palmitoyl (C16) unit is formed
• This is released by hydrolysis to give free palmitate.
Longer chain and unsaturated fatty acids are synthesized in the smooth ER.
• Palmitoyl CoA is the starting substrate
• Four similar reactions occur as previously (i.e. condensation, reduction, dehydration, reduction)
• >60% of fatty acids are >C18, with C20, C22, and C24 being the most common
• Unsaturated fatty acids are also common
• Catalysed by desaturase, cytochrome b5, and cytochrome b5 reductase
• Most common in animals are the C16 palmotoleic and C18 oleic acids which have a single C=C bond at C9
• As mammals cannot introduce double bonds past C9, such fatty acids have to come from the diet (essential fatty acids).
The rate of synthesis and breakdown of fatty acids reflects the energy state of the cell.
• When ATP levels in the cell are high, mitochondrial citrate rises as the ETC and the enzymes of TCA cycle are inhibited (Fig. 2.19)
• Citrate leaves the mitochondria on a specific carrier in exchange for malate
• In the cytosol, citrate is split into acetyl-CoA and oxaloacetate
Acetyl-CoA is converted into malonyl-CoA for fatty acid synthesis
Oxaloacetate is converted back into pyruvate
• Pyruvate can return into the mitochondrion, where it is converted into oxaloacetate by pyruvate carboxylase
• This process generates one NADH and one NADPH
• Each cycle of the fatty acid synthase reaction results in the oxidation of two NADPH, the second of which comes from the pentose phosphate pathway (PPP; p.138)
• Acetyl-CoA carboxylase is regulated by phosphorylation
• An AMP-sensitive kinase (AMPK) inactivates acetyl-CoA carboxylase when energy levels are low in the cell, thus inactivating fatty acid synthesis. This inhibition can be partially overcome allosterically by citrate. This effect of citrate is antagonized by high levels of palmitoyl-CoA, indicating an excess of fatty acids. Palmitoyl-CoA also inhibits the mitochondrial citrate exporter and the production of NADPH by the PPP
• Acetyl-CoA carboxylase is also under hormonal control
• Insulin activates it by dephosphorylation (via protein phosphatase 2A). Glucagon and adrenaline inactivate the protein phosphatase 2A via PKA
• Malonyl-CoA inhibits carnitine acyltranferase I, preventing substrates for β-oxidation entering the mitochondria.
Fig. 2.16 The committed step of fatty acid synthesis: acetyl-CoA to malonyl-CoA.
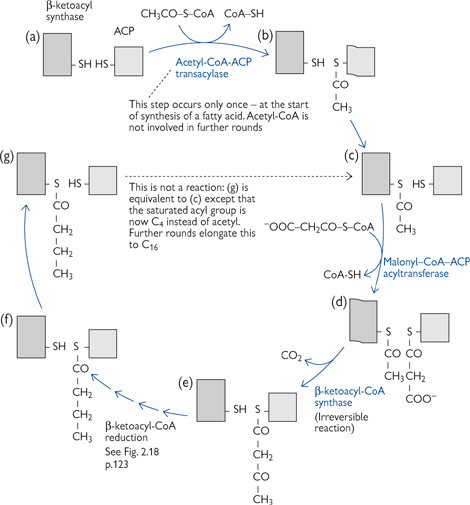
Fig. 2.17 The steps involved in the synthesis of fatty acids.
Fig. 2.18 Reductive steps in fatty acid synthesis, (e)–(f) in cycle shown in Fig. 2.17.
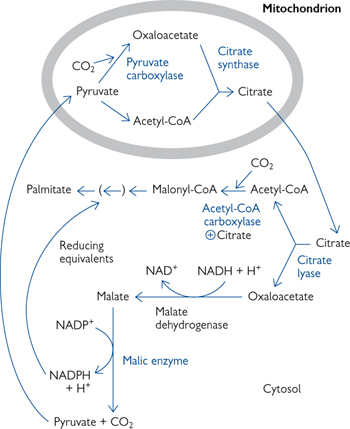
Fig. 2.19 Source of acetyl groups (acetyl-CoA) and reducing equivalents (NADPH) for fatty acid synthesis. The other NADPH comes from the PPP.
With a balanced metabolism of carbohydrate and fat, the acetyl-CoA from β-oxidation will enter the TCA cycle to ultimately produce energy in the form of ATP.
• During times of fasting and starvation, the liver maintains blood glucose levels by gluconeogenesis
• Oxaloacetate from the TCA cycle is the starting substrate. The removal of this intermediate prevents acetyl-CoA from entering the TCA cycle (‘fat burns in the flame of carbohydrate’)
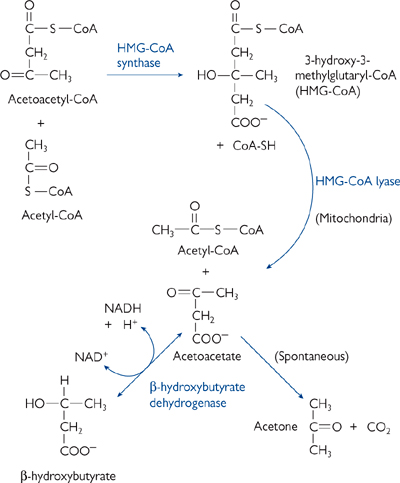
• The build-up of acetyl-CoA leads to a greatly increased rate of formation of ketone bodies in the mitochondria (ketogenesis)
• The major ketone bodies are acetoacetate and β-hydroxybutyrate (Fig. 2.20).
• The liver cannot metabolize ketone bodies as it lacks the enzyme β-ketoacyl-CoA transferase, and so they enter the bloodstream
• Ketone bodies are effectively a water-soluble, transportable form of acetyl groups
• Recipient tissues include heart, brain, renal cortex, and adrenal glands
Heart, renal cortex, and adrenal glands all use ketone bodies as a preferred fuel source
The brain switches over to getting 50–75% of its energy needs from ketone bodies (rather then the usual glucose) after a few days of starvation ( p.166)
This reduces the gluconeogenesis load on the body, preserving protein (muscle) from breakdown
• Ketone bodies are not only an efficient metabolic resource (releasing almost as many ATP as acetyl-CoA entering the TCA cycle directly) but also provide a survival advantage to the tissues that receive them from the liver.
It is important to appreciate that animals cannot make glucose from acetyl-CoA.
• Acetyl-CoA needs to combine with oxaloacetate to form any of the TCA cycle intermediates that can enter the gluconeogenic pathway. Therefore, no new intermediates are created (TCA cycle intermediates are essentially catalytic).
The levels of ketone bodies act as signals for availability of energy substrates.
• High levels of acetoacetate acts as a signal for abundantly available acetyl groups. This inhibits the further breakdown of fat in adipose tissue.
Disease conditions can cause confused signals. Most common is diabetes mellitus ( OHCM8 pp.198, 170).
• Lack of insulin secretion means that the liver does not absorb glucose, and so the lack of hepatic carbohydrate leads to ketogenesis. This is made worse by the lack of signals to adipose tissue to inhibit fat breakdown
• Ketone bodies ( OHCM8 p.842) are acidic and their accumulation (up to 200-fold the normal concentration), and the ensuing metabolic acidosis, can be severe enough to impair CNS function
• Acetoacetate is unstable and spontaneously decays to acetone. This can be smelt on the breath of people with uncontrolled diabetes.
Fig. 2.20 Ketone body production in the liver during excessive oxidation of fat in starvation or diabetes.
As with all metabolic pathways, their regulation is the key to integrating their functions. Extrinsic regulation of fat metabolism is controlled by a number of hormones: insulin, glucagon, adrenaline, and thyroxine.
• Insulin is the hormone that signals the well-fed state
• Activates acetyl-CoA carboxylase by dephosphorylation (via activating protein phosphatase 2A)
• Also increases the amount of lipoprotein lipase (‘clearing factor’ lipase) on the endothelial cells in adipose tissue
Increases the breakdown of circulating triacylglycerols and thus their uptake and storage in adipocytes
• Glucagon and adrenaline signal the need for energy release from fat
• Activate PKA via cAMP which:
Inhibits fat synthesis by phosphorylating acetyl-CoA carboxylase and, thus, inactivating it
Promotes breakdown of triacylglycerides in adipose tissue and release of fatty acids by activating lipases
Reduces the amount of lipoprotein lipase so that circulating triacylglycerols are available to other tissues (and not all taken up by adipose tissue)
• Thyroxine, the active thyroid hormone, is a long-term signal of growth and development
• Increases the oxidative metabolism of both carbohydrate and fat
The mechanism of thyroxine action involves up-regulation of gene transcription of the relevant metabolic enzymes.
Glucose intake after a meal is usually more than enough to meet the immediate energy needs of the body, and so the excess needs to be stored.
• Storage is primarily as the glucose polymer, glycogen
• Main sites of storage are the liver (10% of organ weight) and skeletal muscle (2%)
• Glycogen is a rapidly mobilizable storage form
• When these stores are replete, further excess glucose will be stored as fat.
Glucose is the primary fuel of a number of tissues when the body is in a fed state, with a daily consumption at rest of 160g.
• The brain uses approximately 75% (120g) of the total glucose used per day
• Ketone bodies fulfil much of this need during starvation
• Red blood cells have no mitochondria and so can only make ATP by glycolysis. They therefore have an obligate need for glucose, which they convert into lactate
• Renal medulla has a high energy need to power the membrane transport that occurs in reabsorption from ultrafiltrate
• Skeletal muscle uses glucose for immediate energy
• This comes from its store of glycogen
Muscle cannot release glucose into the blood, and so its glycogen stores are for its own use only
• Muscle also obtains glucose generated in the liver via the Cori cycle (Fig. 2.3)
• In pregnancy, the fetus uses glucose as its main energy source
• Glucose transporters in the brush-border and basolateral membranes of the placenta ensure that the fetus always has a good supply of glucose
The fetal demand for glucose can even result in maternal hypoglycaemia
• The placenta itself also uses glucose for glycolytic energy production, and the lactate is either released into the circulation or taken up by the fetus and used as an energy source.
Glycolysis (Greek for ‘splitting sweetness’) is a sequence of enzyme-catalysed reactions occurring in the cytoplasm of all cells.
• These reactions split a 6-carbon glucose into two 3-carbon pyruvate molecules
• Oxygen is not required for glycolysis and two ATP are produced per glucose
• Under aerobic conditions, these pyruvate molecules can enter the TCA cycle ( p.104) and the two NADH, the ETC ( p.106).
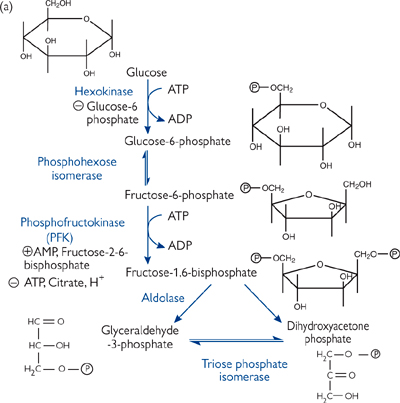
Glycolysis can be divided into two phases (Fig. 2.21):
• Glucose enters the cell on a facilitated glucose transporter (GLUT) and is immediately phosphorylated by hexokinase (glucokinase in liver)
• This irreversible reaction traps the glucose in the cell and maintains the glucose gradient for entry
• Glucose-6-phosphate (G-6-P) is isomerized to fructose-6-phosphate
• Fructose-6-phosphate is phosphorylated to fructose-1,6-bisphosphate (F-1,6-P) by phosphofructokinase (PFK)
• This irreversible reaction is known as the ‘committed step’ of glycolysis, as the only fate for F-1,6-P is to enter the next reaction in the glycolytic pathway
• PFK is the primary regulated step of the glycolysis pathway. PFK responds to both cellular energy needs and hormonal regulation
• Fructose-6-phosphate is cleaved into two 3-carbon molecules—glyceraldehyde-3-phosphate (GAP) and dihydroxyacetone phosphate (DHAP)
• Only GAP is a substrate for further steps in glycolysis
• DHAP is isomerized into GAP.
• The oxidizing power of NAD+ is used to form a high-energy bond between an inorganic phosphate molecule and the aldehyde group of GAP, to give 1,3-bisphosphoglycerate
• The hydrolysis of the acyl phosphate group at C1 gives enough energy to drive the formation of ATP from ADP + Pi. This is known as substrate-level phosphorylation
• The two-step rearrangement of 3-phosphoglycerate into phosphoenolpyruvate creates another high-energy phosphate group—this time an enol phosphate at C2
• A second substrate-level phosphorylation reaction produces an ATP and pyruvate.
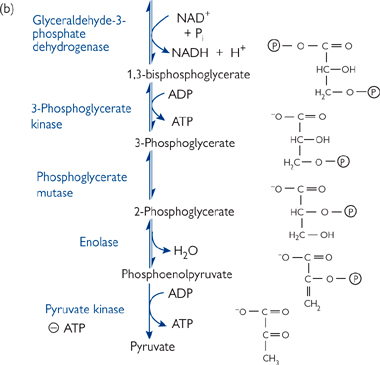
Fig. 2.21 The glycolytic pathway. (a) The energy-investment phase. (b) The energy-generation phase, which only glyceraldehyde-3-phosphate can enter.
• Glycolysis generates a net two ATP plus two NADH and two pyruvates
• Four ATP per glucose are formed in the energy-generation phase two for each C3 GAP molecule), but two ATP per glucose are invested in the energy-investment phase
• All of the reactions (except those catalysed by hexokinase, phosphoglycerate kinase, and pyruvate kinase) are reversed when glucose is made from pyruvate (gluconeogenesis, p.146)
• Under aerobic conditions, the two NADH molecules are reoxidized to NAD+ by the ETC to give an extra five ATP per glucose, and the pyruvate enters the TCA cycle (giving a further 25 ATP per glucose, thus a total of 30 ATP per glucose)
• If oxygen is limiting (anaerobic conditions, e.g. in vigorously exercising muscle), pyruvate is converted to lactate by lactate dehydrogenase
CH3-CO-COO– + NADH + H+ ↔ CH3-CHOH-COO– + NAD+
• This regenerates the NAD+ to allow glycolysis to continue
• Lactate may be exported from the cell to prevent it becoming acidotic
• Lactate is the usual fate of pyruvate in red blood cells, which lack mitochondria and therefore have no ETC or TCA cycle.
Glycolysis is regulated by the energy needs of the cell. There are three main points of regulation.
• Has high affinity (Km <0.1mM) and shows strong end-product inhibition by G-6-P in most tissues
• Inhibition by G-6-P is important as in the presence of high glucose concentrations and low rates of glycolysis, it prevents cellular depletion of Pi by hexokinase
• Liver has glucokinase, which is lower affinity (Km ∼ 7mM) and is not inhibited by G-6-P. This is a problem in fructose intolerance as, in the absence of end-product inhibition, the liver generates large quantities of fructose-6-phosphate, which cannot be metabolized further ( p.134). This causes liver ATP levels to drop, compromising hepatocyte cellular function.
• PFK is the major site of regulation of glycolysis
• There are several important allosteric regulators, both positive and negative.
• AMP: a rise in the cellular AMP level indicates low ATP (as 2ADP → ATP + AMP, catalysed by adenylate cyclase)
• Fructose-2,6-bisphosphate (F-2,6-bisP): formed by phosphofructokinase-2 (PFK-2) phosphorylating F-6-P to F-2,6-bisP
• PFK-2 is inhibited by ATP, and strongly activated by AMP
• The opposing fructose-2,6-phosphatase (F-2,6-Pase), which converts F-2,6-bisP to F-6-P, is inhibited by AMP. These two enzyme activities are found in the same protein (a ‘bi-directional enzyme’).
• H+ ions: if lactic acid builds up, then PFK will be inhibited by the increased protons
• This is a form of end-product negative feedback
• It is especially likely to occur when blood flow is inadequate, e.g. extreme exercise or an attack of angina pectoris ( OHCM8 p.110) in the heart
• ATP: high levels of ATP inhibit PKF as they indicate that the cell does not need glycolysis
• Citrate: fatty acids and ketone bodies are often the favoured cellular fuel, and their oxidation produces citrate, which inhibits PFK and decreases glucose utilization
• PFK is also under hormonal control, with the exception of the brain PFK isoform
• In liver, increases in intracellular cAMP inhibit glycolysis via a decrease in F-2,6-bisP, by inhibiting PFK-2/stimulating F-2,6-Pase
Glucagon and adrenaline activate adenylate cyclase by binding to G-protein-linked receptors in the hepatocyte plasma membrane
• The heart also has adrenaline receptors which cause an increase in cAMP but, in this case, the heart isozyme of PFK-2 is activated, increasing F-2,6-bisP and stimulating glycolysis
Increases ATP production to match adrenaline-signalled increased work load
• Muscle PFK is stimulated by insulin and adrenaline
• PFK regulation is especially important in type IIB (glycolytic) skeletal muscle fibres. These have a low capacity for oxidative phosphorylation and no triacylglycerol stores
• Nevertheless, during long periods of strenuous activity, muscle fibres must adapt to use fatty acids as a fuel. The rise in fatty acids inhibits:
Hexokinase (via G-6-P increase due to decreased glycolysis)
PFK (via increased cytoplasmic citrate as a result of increased mitochondrial acetyl-CoA
PDH (via rise in matrix acetyl-CoA causing pyruvate dehydrogenase kinase (PDK) to phosphorylate and inactivate PDH)
PDH inactivation reduces pyruvate entry rate into TCA cycle
Instead, increased amounts of pyruvate are converted to oxaloacetate, allowing the acetyl-CoA from fatty acids to be oxidized by the TCA cycle.
Different tissues express slightly different forms of the same enzyme (known as isozymes).
• For example, hexokinase and glucokinase are isozymes
• This can be useful in diagnostic testing, e.g. if a heart muscle enzyme isoform is found in the plasma it indicates that the individual has had a heart attack see ( OHCM8 p.112) ( p.18).
Although glucose is the major carbohydrate fuel, both galactose and fructose are important, with the latter making up a significant part of dietary carbohydrate.
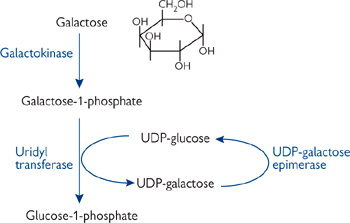
Galactose is metabolized by converting it into the glucose metabolite, G-6-P (Fig. 2.22). This is a four reaction process.
• Galactose is phosphorylated by galactokinase
• Galactose-1-phosphate is converted into UDP-galactose by reaction with UDP-glucose, giving glucose-1-phosphate. This is then isomerized to G-6-P
• UDP-galactose is isomerized back to UDP glucose for re-use.
Galactosaemia is a rare, inherited inability to metabolize galactose.
• A mild form is seen when galactokinase is deficient
• In the severe form, galactose-1-phosphate uridyl transferase enzyme is absent
• High blood and urine levels of galactose
• Infants fail to thrive, with symptoms including:
• Vomiting/diarrhoea after milk
• Enlargement of the liver and jaundice—even cirrhosis
These are due to toxic effects of galactose-1-phosphate
Due to build-up of reduced form of galactose (galactitol) in the lens
• Mental retardation (often delayed language skill acquisition)
Still persists even if patient has a galactose-free diet.
Fructose has a more simple entry pathway into metabolism (Fig. 2.23).
• In the liver, it is converted into fructose-1-phosphate by fructokinase
• This is then split into DHAP and glyceraldehyde
• Glyceraldehyde is converted into GAP by triose kinase
• DHAP and GAP are both intermediates of the glycolysis pathway ( p.128)
• In adipose tissue, hexokinase converts fructose into fructose-6-phosphate, which can continue directly through glycolysis.
Hereditary fructose intolerance prevents cleavage of fructose-1-phosphate to DHAP and GAP.
• Deficiency in fructose-1-phosphate aldolase
• Characterized by hypoglycaemia after fructose ingestion, and death in young children after prolonged ingestion
• Fructose-1-phosphate accumulates intracellularly, effectively depleting the cells of free Pi and therefore reducing their ability to make ATP.
Fig. 2.22 Galactose metabolism.
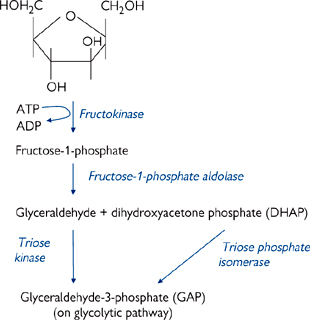
Fig. 2.23 Fructose metabolism.
PDH is a key regulatory enzyme for aerobic oxidation of glucose, as it commits pyruvate to acetyl-CoA to enter the TCA cycle. Other potential fates of pyruvate are conversion to lactate (anaerobic conditions), oxaloacetate (to replenish TCA cycle intermediates), or alanine (by transamination).
The PDH complex consists of a large number of subunits, with multiple copies of three catalytic and two regulatory enzymes, with five co-factors (all derived from water-soluble vitamins). Regulation is at two levels:
• Feedback inhibition by acetyl-CoA and NADH
• More important is the regulation of the PDH enzyme complex by phosphorylation.
PDH is inactivated by phosphorylation.
• The kinase responsible for PDH phosphorylation is itself part of the PDH complex
• The kinase is activated by ATP, acetyl-CoA, and NADH
• It is inhibited by CoA-SH, NAD+, pyruvate, and ADP
• The phosphatase that activates PDH is also part of the complex
• It is Mg2+ and Ca2+ dependent. Ca2+ is important during muscle contraction, as it will cause the activation of PDH when energy is required
• Adrenaline activates PDH in cardiac muscle via G-protein receptors
• Insulin activates PDH via Ca2+ in adipose tissue (increasing acetyl-CoA conversion into fat)
• These regulatory factors allow PDH activity to reflect the metabolic state of the mitochondrion
• An increase in the NADH/NAD+ or acetyl-CoA/CoASH ratio signals that the ETC is not operating fast enough to match NAD+ reduction to NADH. This could be due to lack of oxygen or a high ATP level (respiratory control is in operation).
• The result is an inactivation of PDH → a reduction in the rate of pyruvate entry into the TCA cycle.
The brain has a high energy requirement that is normally satisfied by aerobic glucose oxidation.
• Deficiencies in PDH correlate with severe neurological defects
• Often result in childhood death
• Raised blood levels of lactate, pyruvate, and alanine (with resulting acidosis)
• Alcoholism causes a reduction in thiamine (vitamin B1) absorption from the diet, and thiamine phosphorylation to thiamine pyrophosphate (TPP) in the liver
• TPP is one of the co-factors for PDH
• Reduction in PDH activity causes mental disorder (with memory loss, partial paralysis) known as Wernicke–Korsakoff syndrome ( OHCM8 pp.728, 800).
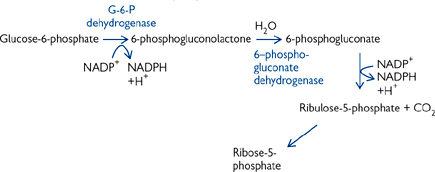
The pentose phosphate pathway (PPP) has several functions (Fig. 2.24), including:
• Generation of NADPH for biosynthetic reducing power, e.g. fat synthesis
• Production of ribose-5-phosphate for nucleic acid synthesis.
Reactions take place in the cytosol of cells involved in biosynthesis, e.g. adipose tissue.
• The need of the cell for NADPH or sugar intermediates will determine the flow through the PPP
• When more NADPH is needed than ribose-5-phosphate, one G-6-P is oxidized to CO2 for every five that are regenerated:
6 G-6-P + 12 NADP+ + 7 H2O → 5 G-6-P + 6 CO2 + 12 NADPH + 12 H+ + Pi
• When balanced amounts of ribose-5-phosphate and NADPH are needed:
G-6-P + 2NADP+ + H2O → ribose-5-phosphate + 2 NADPH + 2H+ + CO2
• When only ribose-5-phosphate is needed:
5 glucose-6-phosphate + ATP → 6 ribose-5-phosphate + ADP
NADPH is important in recycling of the antioxidant glutathione.
• Glutathione (GSH) is important in detoxifying harmful peroxides (-OOH) including H2O2 (catalysed by glutathione peroxidase). See protection of cells against ROS
• Oxidized GSH is regenerated by glutathione reductase using NADPH as its source of reducing power
• GSH is also important in red blood cells for keeping the methionine residues of haemoglobin in a reduced state.
Deficiency in glucose-6-phosphate dehydrogenase (G6PD) ( OHCM8 p.332) reduces the NADPH availability.
• Anything that increases the oxidative stress in cells will then cause problems due to the lack of reduced GSH. Examples include antimalarial drugs, e.g. primaquine ( OHPDT2 p.445) and flavobeans (broad beans)
• Symptoms include black urine, jaundice, haemolytic anaemia
• NADPH is important in maintaining the erythrocyte membrane integrity. Deficiencies in G6PD lead to weakened red blood cells that are more susceptible to haemolysis
• There are over 300 known mutations in this enzyme
• Frequency varies from <1% in northern Europeans, 10% in African Caribbeans, up to 25% in southern Europeans
The high prevalence in southern Europeans is due to its protective effects against malaria
Selective advantage may be due to malaria parasite needing PPP products and/or the extra stress due to the parasite causing the red blood cell host to lyse before the parasite matures.
(a) If cell has balanced need for ribose-5-phosphate and NADPH
(b) If cell requires more NAPH than ribose-5-phosphate, then the excess ribose-5-phosphate formed in part (a) can be converted into the glycolytic/gluconeogenic intermediate fructose-6-phosphate by the overall reaction
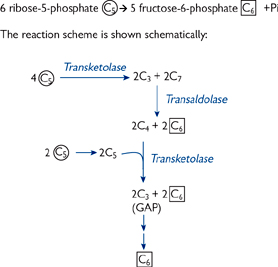
(c) If cell requires more ribose-5-phosphate than NADPH
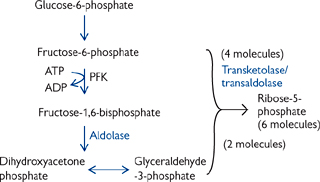
Fig. 2.24 Pentose phosphate pathway.
Glycogen is a readily mobilized storage form of glucose.
• Glycogen is a very large, branched polymer of glucose
• It has mainly β-1,4 glycosidic bonds, with branches about every tenth residue caused by α-1,6 bonds ( p.34)
• The many free 4-OH ends allow for rapid breakdown to release glucose.
There are separate pathways for breakdown (Figs 2.25, 2.26) and synthesis of glycogen.
Glycogen is broken down by the liberation of a glucose-1-phosphate (G-1-P) molecule, leaving the glycogen chain one residue shorter.
• The reaction is catalysed by glycogen phosphorylase
• The α-1,4 glycosidic bond is cleaved by phosphorolysis (cleavage of bond by orthophosphate), rather than by hydrolysis
• In most tissues, G-1-P is converted into G-6-P by phosphoglucomutase, which can then enter the glycolytic pathway to form energy
• As the main site of gluconeogenesis, the liver has the enzyme glucose-6-phosphatase. This converts G-6-P into glucose, which is released into the bloodstream.
Glycogen phosphorylase can only remove glucose residues from free chain ends until it is four residues from a branch point.
• Three residues are moved by a transferase to an adjacent chain for future breakdown by glycogen phosphorylase
• The remaining single residue is hydrolysed by β-1,6 glucosidase (debranching enzyme) to give glucose, leaving a linear chain for continued breakdown by glycogen phosphorylase
• Debranching enzyme and transferase activity are present in the same 160-kDa polypeptide chain.
McArdle’s disease ( OHCM8 p.718)—absence of muscle glycogen phosphorylase.
• Patients have a limited ability to perform strenuous exercise due to painful muscle cramps
• This is caused by a failure to utilize the (larger than normal) stores of glycogen to make ATP.
Glycogen is synthesized by the addition of glucose molecules to the 4-OH end of an existing chain of glycogen, using an activated form of glucose—UDP-glucose.
• Glycogen chain extension is catalysed by glycogen synthase:
G-1-P + UTP → UDP-glucose + PPi
Glycogenn + UDP-glucose → Glycogenn+1 + UDP
• There is also a branching enzyme
• When at least 11 residues have been added, it breaks off a chain of about seven glucose units and rejoins them to a free 6-OH group (i.e. as an β-1,6 linkage)
• The new branch must be at least four residues from the nearest existing branch.
The storage of glucose as glycogen is an energy-efficient process.
• One ATP equivalent is used in generating UDP-glucose
• Approximately 1 in 10 glucose monomers released on glycogen breakdown will be a branch point and released as glucose (→ G-6-P for further metabolism except in liver)
• Therefore, the metabolic cost is approximately 1.1 ATP per glucose
• Overall, this represents around 97% efficiency (based on one G-6-P yielding 31 ATP).

Fig. 2.25 Breakdown of glycogen is by the sequential liberation of a glucose-1-phosphate molecule.
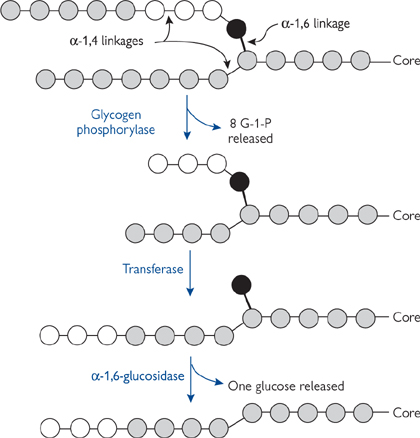
Fig. 2.26 Schematic representation of glycogen breakdown, including of a branch point.
The two separate pathways of glycogen synthesis and breakdown must be regulated, both to maintain suitable plasma glucose concentrations and also to avoid futile substrate cycling. There are two potential forms of regulation: intrinsic and extrinsic.
• Intrinsic—allows cells to respond to their own energy needs by breaking down glycogen when cell ATP and glucose levels fall, and to switch on glycogen synthesis when these concentrations rise
• Extrinsic (Fig. 2.27)—mediated by hormones or other stimuli
• Increases in intracellular levels of Ca2+ or cAMP will promote glycogen breakdown and inhibit synthesis, e.g. to prepare muscle cells for action or liver to release glucose for other tissues
• Insulin signals the fed state and enhances glycogen synthesis and inhibits breakdown, thus storing energy for use in the future. These effects are mediated via reversible phosphorylation of the synthesis/breakdown enzymes.
The enzyme directly responsible for glycogen breakdown, i.e. glycogen phosphorylase, can exist in two interconvertible forms (Fig. 2.28a):
• The b form is usually inactive
• The usually inactive b form can be converted into the active a form by phosphorylation
• Catalysed by glycogen phosphorylase kinase
• Glycogen phosphorylase a is deactivated by dephosphorylation by protein phosphatase 1 (PP1). This is the mechanism behind hormonally exerted extrinsic control
• Although glycogen phosphorylase b is usually inactive, it can be activated allosterically by molecules that signal the energy charge of the cell
• This represents the intrinsic control
• In muscle cells, high (AMP) will activate glycogen phosphorylase b, whereas high (ATP) and (G-6-P) inactivate it. All three compounds act at the same allosteric regulatory site
• The liver isoform of glycogen phosphorylase is different, in that active glycogen phosphorylase a is deactivated by the binding of glucose, but the b isoform is insensitive to AMP levels. This difference reflects the role of liver glycogen stores in supplying glucose for the rest of the body
• Glycogen breakdown is prevented when plasma glucose concentrations are high.
Glycogen phosphorylase kinase is a very large protein (1200kDa), made up of (αβγδ)4 subunits, and it can be controlled in two ways (Fig. 2.28b):
• It is converted from a low to a high activity form by phosphorylation by PKA
• As PKA is activated by cAMP, this is makes glycogen phosphorylase kinase sensitive to hormones such as adrenaline
• Glycogen phosphorylase kinase is phosphorylated on a serine residue on subunits α and β
• Glycogen phosphorylase kinase can be partially activated by Ca2+ at levels of ∼1μM because the γ subunit is calmodulin
• This is important in muscle, where contraction is triggered by Ca2+ release from the SR
• It will also make glycogen phosphorylase kinase sensitive to hormones which raise cytoplasmic Ca2+ (especially relevant in liver).
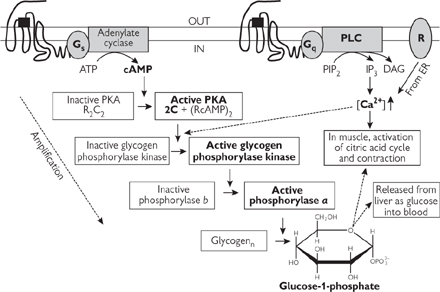
Fig. 2.27 Overall mechanism of activation of glycogen breakdown from the activation of membrane receptors (note how each step acts to amplify the signal). Glucagon acts via Gs-protein linked receptor, adrenaline via Gs or Gq-linked receptor (tissue dependent) and ‘R’ is the nicotinic acetylcholine receptor (nAChR) in muscle.
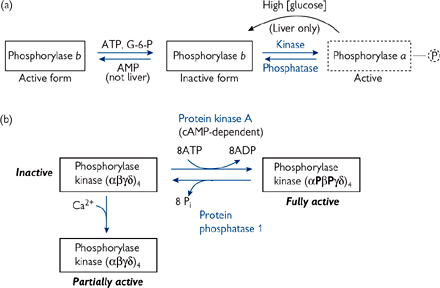
Fig. 2.28 Mechanisms of activation/inactivation of (a) glycogen phosphorylase and (b) glycogen phosphorylase kinase.
It is clearly important that glycogen synthetase is switched off when glycogen phosphorylase is activated and vice versa (i.e. that they are regulated reciprocally).
• Glycogen synthase also exists in two forms—the active a form and the inactive b form
• Conversion from the active a to the inactive b form requires phosphorylation
• The three most important kinases responsible are PKA, phosphorylase kinase, and the Ca2+-calmodulin CaM kinase II
• Thus, the hormones which turn on glycogen breakdown simultaneously turn off glycogen synthase (Fig. 2.29):
• Those which acted via cAMP, through activating PKA and phosphorylase kinase
• Those which raised [Ca2+], via phosphorylase kinase and CaM kinase II.
There must be a cellular mechanism present to reverse the effects of the phosphorylation steps (i.e. activation of glycogen phosphorylase kinase and glycogen phosphorylase, and inactivation of glycogen synthase).
• PP1 is the most important cell phosphatase regulating glycogen metabolism
• It dephosphorylates and thus inactivates glycogen phosphorylase kinase (and hence glycogen phosphorylase)
• It also dephosphorylates glycogen synthase, and thus activates it.
The activity of PP1 itself is regulated by phosphorylation.
• PP1 has two subunits—the catalytic 37kDa and the 160kDa glycogen-binding subunit
• The glycogen-binding subunit is phosphorylated by PKA, rendering it unable to bind the catalytic subunit, thus inactivating it.
Further inhibition of PP1 is brought about by an inhibitor protein, known as inhibitor 1. When phosphorylated by PKA, this small protein blocks the catalytic subunit of PP1.
Thus, cAMP not only activates the kinase cascade (Fig. 2.29), but also prevents PP1 from dephosphorylating the enzymes involved in glycogen metabolism.
• The hormonal signal of the fed state, insulin, activates glycogen synthetase and inhibits glycogen phosphorylase (Fig. 2.30)
• Insulin binds its plasma membrane receptor, itself a tyrosine kinase
• This catalyses the auto-phosphorylation of the receptor and the initiation of a protein kinase cascade
PKB is activated, which in turn phosphorylates and inactivates glycogen synthase kinase 3 (GSK3). (GSK3 normally keeps glycogen synthase phosphorylated and inactive)
PP1 is activated by phosphorylation, and so glycogen synthase is dephosphorylated and activated. Simultaneously, glycogen phosphorylase kinase and glycogen phosphorylase will be dephosphorylated and inactivated
The net result will be increased glycogen synthesis and decreased glycogen breakdown.
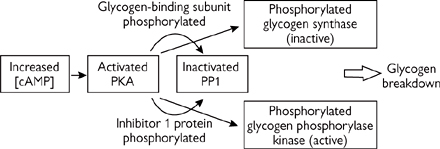
Fig. 2.29 Regulation of the process of glycogen breakdown.
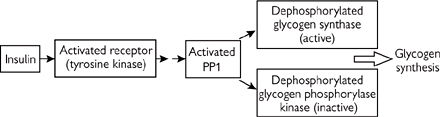
Fig. 2.30 Regulation of the process of glycogen synthesis.
Gluconeogenesis (Figs 2.31, 2.32) is the synthesis of glucose from non-carbohydrate precursors. This process plays different roles depending on the nutritional state and the tissue in question.
• In tissues that are generating sufficient energy and have surplus nutrients, glucose is produced to be stored as glycogen
• The liver synthesizes glucose for export to other glucose-dependent tissues (especially brain, red blood cells) during starvation and intense exercise
• Renal cortex also contributes about 10%
• NB: Mammals cannot convert fatty acids into glucose, as there is no enzyme to catalyse the reaction of acetyl-CoA into oxaloacetate
• The glycerol backbone of triacylglycerols is a gluconeogenic substrate
• The last unit of β-oxidation of an odd-chain fatty acid, propionyl-CoA, can also enter gluconeogenesis.
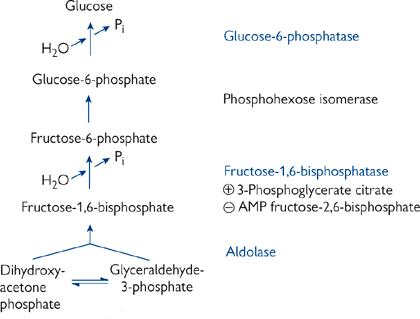
The gluconeogenesis pathway is not simply a reversal of glycolysis.
• Thermodynamics favour glycolysis direction of glucose → pyruvate
• There are three essentially irreversible reactions in glycolysis to be bypassed.
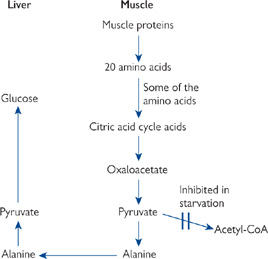
Fig. 2.31 Mechanism by which breakdown of muscle proteins supplies the liver with a source of pyruvate for gluconeogenesis during starvation.
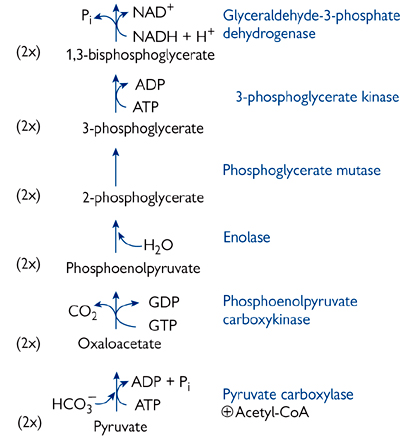
Fig. 2.32 The complete gluconeogenesis pathway from pyruvate to glucose. The highlighted enzymes are not shared with the glycolytic pathway.
Two enzyme-catalysed reactions involved:
Pyruvate + CO2 + ADP → oxaloacetate + ADP + Pi (pyruvate carboxylase)
• Reaction occurs in the mitochondrial matrix
• Requires biotin as co-factor
• Reaction driven by ATP hydrolysis
• Allosterically stimulated by acetyl-CoA
Signals cell is energy-replete, turning on storage pathway
Oxaloacetate + GTP → phosphoenolpyruvate + CO2 + GDP (phosphoenolpyruvate carboxykinase)
• Can occur in either matrix or cytoplasm
• Reaction is driven by GTP hydrolysis.
Allosterically regulated
• Stimulated by an increase in 3-phosphoglycerate and citrate
• Inhibited by increased AMP and fructose-2,6-bisphosphate
• These are the opposite to the signals to regulate glycolysis
• Enzyme only found in liver and renal cortex
• G-6-P has to enter across the smooth ER membrane, and products (glucose, phosphate) have to leave—there are specific transporters for each
• Deficiencies in either transporters or enzymes cause von Gierke’s disease
Failure to break down G-6-P during hypoglycaemia leads to inappropriate production of glycogen (stimulated by rise in G-6-P).
Although these three bypass reactions render gluconeogenesis energetically favourable, they do so at a cost.
• Conversion of pyruvate to glucose uses more ATP than glycolysis releases
• Gluconeogenesis bestows two major advantages that outweigh this:
• The ability to store excess non-carbohydrate nutrients as glycogen in time of plenty
• The role of the liver to effect nutrient redistribution between tissues, e.g. Cori cycle (Fig. 2.03).
In addition to local (intrinsic) control of the bypass reactions mentioned previously, gluconeogenesis is also under extrinsic hormonal control.
• Glucagon stimulates gluconeogenesis (cAMP leads to reduction in the levels of fructose-2,6-bisphosphate, an allosteric activator of fructose-1,6-bisphosphatase)
The rise in fructose-6-phosphate also inhibits glucokinase
• Insulin has the opposite effect
• Both glucagon and insulin affect glycolysis and gluconeogenesis by induction and repression of key enzymes in the pathways
A high plasma glucagon/insulin ratio increases the liver capacity for gluconeogenesis
A high insulin/glucagon ratio has the opposite effect
• Corticosteroids have the same effect as glucagon.
Alcohol inhibits gluconeogenesis in the liver.
• Detoxification of ethanol creates high levels of NADH in the cytosol
• This in turn promotes the formation of lactate from pyruvate, and malate from oxaloacetate, which effectively limits the availability of substrates for gluconeogenesis.
Protein from the diet (approx 70g per day) is broken down by sequential enzyme digestion.
• The endopeptidase (protease) pepsin is secreted in the stomach in an inactive form (pepsinogen) which is activated by cleavage of a peptide fragment from its amino terminus
• Either autoactivated when the pH <5 or by active pepsin
• Acidity of stomach lumen also denatures proteins and makes them more susceptible to hydrolysis
• Endopeptidases cleave internal peptide bonds and release large peptide fragments
• Pancreatic secretion of the endopeptidases trypsin, chymotrypsin, and elastase (serine proteases) and the exopeptidases carboxypeptidases A and B
• Work in neutral conditions of small intestine lumen, achieved by secretion of bicarbonate-rich pancreatic juice
• All the pancreatic proteases are secreted as inactive precursors (trypsinogen, chymotrypsinogen, proelastase, procarboxypeptidase A and B)
Trypsinogen is activated by enteropeptidase (enterokinase) released from the epithelial cells of the small intestine (enterocytes) and by active trypsin
The others are all activated by cleavage with trypsin
• Exopeptidases remove the last (carboxypeptidase) or the first (aminopeptidase) amino acid from a peptide chain
• Results in a mixture of amino acids and small peptides up to six amino acids long (oligopeptides)
Diseases which interfere with pancreatic secretion (e.g. pancreatitis, CFTR ( OHCM8 pp.166, 638)) will prevent proper protein digestion and thus lead to protein malabsorption and malnutrition. This can be overcome by either supplying preparations of exogenous pancreatic enzymes or dietary supplements of easily digested proteins
• The brush-border membrane of the enterocytes contain enzymes that continue digestion
• Endopeptidases, aminopeptidases, and dipeptidases continue the digestion to dipeptides, tripeptides, and free amino acids.
A mixture of dipeptides, tripeptides, and amino acids is taken up by enterocytes.
• Di- and tripeptides are taken up by a proton-coupled co-transporter
• Also responsible for absorption of β-lactam (aminopenicillin) antibiotics
• Amino acids are absorbed by a number of mainly sodium-coupled transport systems
• Di- and tripeptides are cleaved by intracellular peptidases into free amino acids
• Amino acids leave the enterocytes via the basolateral membrane and enter the circulation
• A few hydrolysis-resistant peptides (and antibiotics) may leave the cell intact.
Amino acids fall into different categories and can have different fates (Fig. 2.33).
• Essential amino acids (those the body cannot make): arginine, histidine, isoleucine, leucine, lysine, methionine, phenylalanine, threonine, tryptophan, and valine
• Arginine can be synthesized in the body, but not in large enough quantities, especially during periods of growth
• Lack of an essential amino acid will result in an inability to synthesis proteins containing that amino acid
• Non-essential amino acids can be made by the body: alanine, aspartate, asparagine, cysteine, glutamate, glutamine, glycine, proline, serine, and tyrosine
• Amino acids can be used for a variety of purposes
• Neurotransmitters, e.g. 5-hydroxytryptamine (5-HT)
• Deaminated, and then the remaining carbon skeleton is:
or
Converted into glucose via gluconeogenesis
or
• Not all amino acids can entertain all of these fates
• Those which can be degraded to pyruvate or TCA cycle intermediates are termed glucogenic
• Those which are converted to acetyl-CoA or acetoacetyl-CoA are termed ketogenic
Only leucine and lysine are solely ketogenic
• Those which can do either are termed mixed.
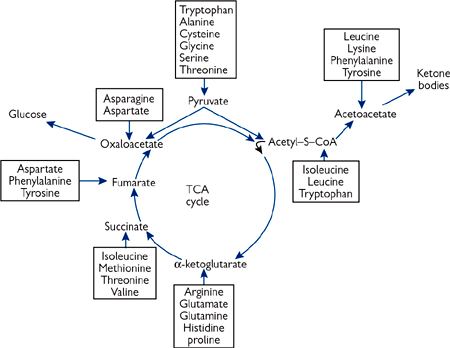
Fig. 2.33 The points of entry of amino acid carbon skeletons into the citric acid cycle and into ketone body synthesis.
Western diets are generally relatively high in protein, and excess amino acids cannot be stored.
• The carbon skeletons of amino acids can be used as an energy source
• First, the amino group is removed and excreted as urea ( p.154)
• This is done by transamination (class of enzyme: aminotransferases)
• Each amino acid has its own specific aminotransferase
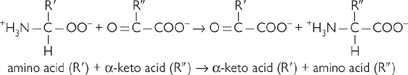
All have pyridoxal phosphate (a vitamin B6 derivative) as a co-factor
• Reactions are easily reversible and require no energy input
• The most common acceptor of the amino group is β-ketoglutarate
• Forms glutamate, which provides a pool of amino groups for making other non-essential amino acids or for deamination
• Other amino group acceptors include pyruvate (→ alanine) and oxaloacetate (→ aspartate).
Glutamate is deaminated by glutamate dehydrogenase
• The pooling of excess amino groups into glutamate means that only one deamination pathway is required
• The deamination reaction regenerates β-ketoglutarate and a free ammonium (), plus an NADH
• Glutamate dehydrogenase is allosterically regulated by increases in ADP and GDP. These compounds signal that amino acids need to be used as an energy source
• The deamination reaction takes place in the mitochondria of liver cells
• The major fate of is incorporation into urea for excretion ( p.154).
Other sites of ammonium production include:
• Brain: breakdown (and therefore inactivation) of the neurotransmitter γ-aminobutyric acid (GABA) to succinate and an ammonium ion
• The ammonium ion is combined with β-ketoglutarate to produce glutamate, and then another ammonium ion is incorporated to form glutamine. This is transported to the liver for deamination and urea production
• Muscle: formed from natural protein turnover, muscle catabolism during starvation, and from breakdown of excess ADP during severe exercise (2ADP → ATP + AMP; AMP → IMP (inosine monophosphate) + )
• An ammonium ion combines with β-ketoglutarate to form glutamate
Glutamate is used to transaminate pyruvate to form alanine and regenerate α-ketoglutarate
The alanine is released into the bloodstream and taken up by the liver
Following deamination, the pyruvate released can be oxidized (TCA cycle) or used for gluconeogenesis
• Intestinal cells: glutamine serves as an energy source. (Fig. 2.34).
Excess nitrogen can be excreted from the body either as urea or as ammonium ions.
• Urea is generated in the liver as a soluble, non-toxic way of eliminating excess ammonia
• The renal cortex can also deaminate glutamine
• The ammonium is used to assist with acidifying the urine ( p.502)
• This mechanism also conserves HCO3– which would otherwise need to be used in urea synthesis and would exacerbate any acidosis.
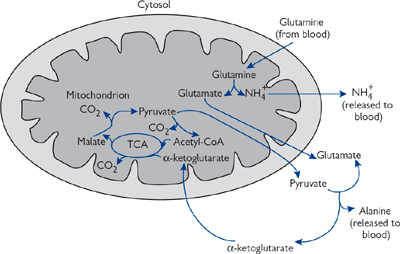
Fig. 2.34 Glutamine catabolism by rapidly dividing enterocytes.
Under all nutritional states, the body needs to excrete amino groups (i.e. ammonia).
• Protein intake >> need (generally true on a Western diet)
• Cannot store excess amino acids
• Will use/store carbon skeletons as energy source and excrete unwanted amino groups
• Protein catabolism will occur to free carbon skeletons for energy
• Excess amino groups will need to be excreted.
Free ammonia is toxic, and blood levels need to be kept low (25–40μM).
• If ammonium ion levels rise, reacts with α-ketoglutarate to form glutamate—at high levels in the brain this reduces the rate at which ATP can be formed → cells starved of energy.
Healthy adults are in ‘nitrogen balance’
• Approx. 80% of excess nitrogen excreted as urea (the remainder is as free ammonium ions and creatine)
• Most urea is synthesized by the liver, with the rate of synthesis strictly controlled to prevent ammonia build-up
• Urea is also used in the kidney as part of the urinary concentrating mechanism ( p.502).
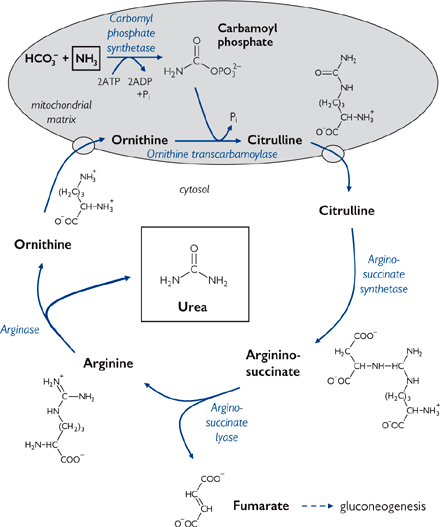
The urea cycle (Fig. 2.35) describes the formation of urea from one free ammonium ion and one donated from aspartate.
• The urea cycle takes place partly in the mitochondrial matrix, partly in the cytoplasm
• It involves two amino acids not found in proteins—ornithine and citrulline.
Control of the urea cycle is at two levels: acute and chronic
• Acute regulation is via carbamoyl-phosphate synthetase
• Regulated by the concentration of N-acetyl-glutamate
• N-acetyl-glutamate is formed by N-acetyl-glutamate synthase, the activity of which is stimulated by arginine, itself an intermediate of the urea cycle
• Chronic regulation: urea cycle enzymes are induced over 24–36h
• This is in response to increased levels of ammonia in liver cells
• Ammonia levels can vary 10–20-fold with diet and under starvation conditions when muscle is broken down
Under prolonged or severe starvation conditions, the ability for enzyme (protein) synthesis may be compromised.
• General strategy for treatment is to reduce the protein level in the diet, and to give a compound which aids nitrogen excretion (either by stimulating the urea cycle or another compensatory pathway)
• Ornithine transcarbamoylase deficiency is the most common urea cycle problem
• X-linked—generally, males more seriously affected
• Causes mental retardation and even death
• Symptoms: raised ammonia and amino acid levels, high blood ororate levels
• Treatment: give large quantities of benzoate and phenylacetate
• Benzoyl-CoA reacts with glycine to form hippurate, phenylacetyl-CoA reacts with glutamine to form phenylacetylglutamine
These excretable conjugates substitute for urea in the disposal of nitrogen
• Argininosuccinate synthetase/argininosuccinase deficiency
• Symptoms: usually benign—excrete high levels of citrulline/argininosuccinate respectively
• Treatment: arginine supplements to replace ornithine, thus allowing urea cycle to continue.
Not all tissues metabolize amino acids in the same way, and the metabolism by any one tissue often depends on the metabolic status of the body.
• The liver is the main site of amino acid degradation (deamination). It is also the major site of urea synthesis for nitrogen excretion
• During fasting, the liver is the main site of gluconeogenesis, using carbon skeletons from amino acids
• The liver plays a major role in the synthesis of the tripeptide glutathione ( p.156).
• Enterocytes take up glutamine and release it as alanine. This enables them to generate energy from it ( Fig. 2.34, p.153)
• Enterocytes are the only cells to contain glutamate reductase, the synthetic enzyme for citrulline. Citrulline produced in the gut is released into the plasma and taken up largely by the kidney which converts it to arginine (the intestinal-renal pathway). This arginine is converted to ornithine to increase the capacity of the urea cycle during periods of increased protein intake.
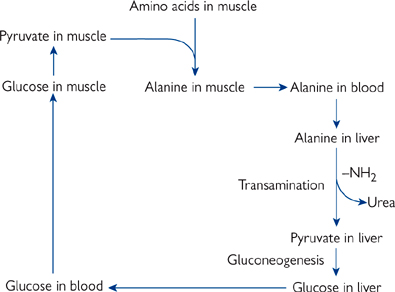
• During fasting and starvation, muscle protein is broken down so that the carbon skeletons can be used for gluconeogenesis by the liver
• The main amino acids released are alanine and glutamine (Fig. 2.36)
• Alanine is transported by the blood to the liver for deamination and gluconeogenesis
• Glutamine is taken up by enterocytes for energy and released as alanine.
• The renal cortex is the only tissue other than liver that can perform gluconeogenesis. It has a capacity of up to 10% of total glucose generation
• The renal cortex converts citrulline via arginine to creatine, which is used by skeletal muscle to store high-energy phosphate bonds as creatine phosphate
• Creatine phosphate spontaneously forms creatinine
• Creatinine ( OHCM8 p.683) is excreted by filtration by the kidneys, and its level in the blood can be used to assess renal function ( OHCM8 p.298) ( p.486)
• The kidney is the major site of carnitine synthesis, with liver to a lesser extent
• Carnitine is important in fatty acid metabolism ( p.116).
Fig. 2.36 The glucose–alanine cycle for transporting nitrogen to the liver as alanine, and glucose back to the muscles.
Not only do the cells of different tissues have specialized metabolic roles, but also the different compartments in individual cells.
• Mitochondria are the major site of energy (ATP) production in all cells except erythrocytes
• TCA cycle, ETC, oxidative phosphorylation all take place there
• Other metabolic roles include β-oxidation of fats, synthesis of urea, haem synthesis
• Mitochondria have their own separate genome (∼4% of the total cell DNA)
• The genome encodes 13 proteins, including some components of the electron transport chain and ATP synthase
• Also 12S and 16S ribosomes and 22 unique tRNAs
• Evolutionary origin of mitochondria suggests that they may have originally been free-living bacteria that became incorporated in cells in a symbiotic relationship (‘symbionts’)
• Mitochondria can replicate in cells
• They have their own protein-synthesizing apparatus
• Mitochondrial density can vary both up and down, e.g. up to 10-fold increase in resting skeletal muscle if it is repeatedly stimulated to contract over a prolonged period
Density also increases in hypoxia
• Mitochondrial DNA is inherited almost exclusively from the maternal side as the egg has several hundred thousand molecules of DNA compared to only a few hundred in the sperm
• Mitochondrial pathologies tend to be complex
• Not all mitochondria are affected to the same extent, and there can be large variations in severity and time of onset of diseases
• Eventually, the energy-generating capacity of the mitochondria falls below the level required to sustain the cellular function
• The nervous tissue and heart are highly dependent on oxidative phosphorylation, and therefore most susceptible to mitochondrial mutations
The first disease discovered to be caused by mutations in mitochondrial DNA was Leber hereditary optic neuropathy ( OHCM8 p.77), which causes blindness, with onset usually in adulthood (early to mid-life). Caused by mutations in the DNA for NADH-Q reductase (complex I)
• In addition, the continued presence of developmental isoforms of cytochrome c oxidase (complex IV) in neonates can lead to severe respiratory distress or ‘floppy baby syndrome’. Recovery occurs after several months in a high-oxygen environment.
• Smooth ER contains the cytochrome P450 class of enzymes
• These play an important role in detoxification of both endogenous and exogenous compounds
• They are also involved in the production of steroids
• Smooth ER is the site of elongation of fatty acid chains over C16 during the biosynthesis of lipids ( p.120)
• The final step in the gluconeogenic pathway in liver and renal cortex takes place in smooth ER (site of the enzyme glucose-6-phosphatase; p.146)
• Protein synthesis takes place on ribosomes attached to the cytoplasmic side of rough ER
• Protein modification and processing also occur in the rough ER lumen.
• Site of modification of proteins e.g. glycosylation
• Site of protein sorting for appropriate trafficking
• Proteins can be targeted, for example, to the plasma membrane, to organelles, or for secretion
• Manufacture site (along with ER) of new lipid membrane for incorporation into the plasma membrane or for other organelles e.g. lysosomes, peroxisomes.
• Lysosomes are the site of intracellular digestion of extracellular and intracellular components
• They are a membrane-bound compartment that is acidified to ∼pH5
• This is the appropriate acidity for activity of the enzymes within the lysosome lumen
• These enzymes are collectively known as hydrolases
Wide range of bonds broken, including C-C, C-N, C-S, O-P in lipids, proteins, carbohydrates, and nucleic acids
• The lysosomal membrane is largely impermeable
• Specific mechanisms exist to move compounds in/out of the lysosome
• Extracellular materials are taken into the cell by endocytosis, where the material is encapsulated and internalized in membrane-bound vesicles
• Phagocytosis involves the uptake of foreign particles such as microorganisms
• Pinocytosis is the uptake of material suspended in extracellular fluid
• These vesicles fuse with primary (inactive) lysosomes to form secondary lysosomes, also known as digestive vacuoles
• If the membrane of the primary lysosome is disrupted, the enzyme contents can be released into the cytoplasm. This causes digestion of cellular components and, ultimately, cell lysis
Occurs in gout when crystals of uric acid are phagocytosed
• Intracellular components undergo routine breakdown and resynthesis, including proteins, lipids, nucleic acid, mitochondria
• Those identified by the cell as due for breakdown are taken up by lysosomes in a process known as autophagy
• Most breakdown products are released from the liposome back into the cell cytoplasm for re-use
• Non-digestible material in vesicles (‘residual bodies’) can be removed from the cell by exocytosis
• Some residual bodies are pigmented (lipofuscin, or ‘age’ or ‘wear and tear’ pigment)
• Sometimes the enzymic contents of lysosomes are secreted from the cell to break down extracellular material in connective tissue or the prostate gland
• Inappropriate release of lysosomal enzymes occurs in I cell disease when the enzymes are mis-targeted and released from the cell on synthesis, damaging the extracellular matrix
• Other diseases are associated with missing individual lysosomal enzymes, resulting in a build-up of the substrate for the missing enzyme
• These are collectively known as lysosomal storage diseases
• The build-up of indigestible matter causes enlarged lysosomes, which can interfere with the normal cellular functions. Examples include lysosomal acid lipase (LAL) deficiency, characterized by impaired cholesterol metabolism (rare)
Cholesterol ester storage disease: low LAL activity (<5%) → hypercholesterolaemia, hepatomegaly, early onset of severe atherosclerosis
Wolman’s disease: no detectable LAL activity → usually fatal by one year of age.
• Peroxisomes (or microbodies) are small spherical or oval organelles with a fine network of tubules in their lumen
• Over 50 peroxisomal enzymes have been identified
• Some use or produce hydrogen peroxide (H2O2)—hence the name peroxisome
• They play essential role in lipid breakdown (especially oxidation of very long chain fatty acids C24 and C26), bile acid synthesis, synthesis of glycerolipids, glycerol ether lipids (plasmalogens), and isoprenoids
• Peroxisomes also contain enzymes for metabolizing D-amino acids, uric acid, and 2-hydroxy acids using molecular oxygen to form H2O2
Compounds are oxidized by the H2O2, which is itself then broken down to oxygen and water by catalase
By both forming and breaking H2O2 in the same organelle, the potential for cellular damage is limited
• Peroxisome biogenesis disorders (PBDs) are rare and associated with insufficiencies in the peroxisomal enzymes
• Tissues affected include liver, brain, kidney, skeletal system
• Symptoms include low plasmalogens, high levels of very long chain fatty acids, and build-up of bile acid precursors
• Most severe is Zellweger’s syndrome ( OHCM8 p.730)
Failure to traffic enzymes properly → non-functional peroxisomes; usually fatal by 6 months of age.
• Peroxides are highly reactive oxygen species that can damage membranes and other biomolecules
• As a protectant, cells contain a high level (∼5mM) of the tripeptide glutathione (GSH) (see pentose phosphate pathway)
• GSH is kept in its reduced form by glutathione reductase. The ratio of reduced glutathione (GSH) to oxidized (GS-SG) is ∼500:1
• Peroxides are detoxified by the glutathione peroxidase catalysed reaction
2GSH + ROOH → GS-SG + H2O + ROH
Glutathione peroxidase is very unusual in containing a modified amino acid containing a selenium (Se) atom
• The enzyme SOD is also responsible for detoxifying superoxides (O2–)
• Oxidized SOD coverts superoxide into O2 and itself becomes reduced:
SODox + O2– → SODred + O2
• The reduced SOD then reacts with a second superoxide and two protons to form hydrogen peroxide, reforming oxidized SOD:
SODred + 2H+ + O2– → SODox + H2O2
• The hydrogen peroxide formed by SOD is broken down by catalase:
2H2O2 → O2 + H2O
• Antioxidant vitamins C and E are further cellular defences against oxidative damage
• Being lipophilic, vitamin E is especially useful in protecting membrane lipids and those in low density lipoproteins from peroxidation.
• Vitamin C (ascorbate) is found in very high (mM) concentrations in cells and is maintained in the reduced state by GSH-mediated recycling.
Obviously not all of the metabolic processes that have been discussed in the preceding sections will be occurring at the same time in any one individual. Indeed, if this were the case, then there would be the danger of futile cycles that would be wasteful of energy. Therefore, it is important to have some concept of when and which pathways are largely active/inactive, and how this coordination of metabolism is brought about.
The major situations that will be considered are:
Humans eat intermittently, so need to consume calories in excess of their immediate need and store energy for later in the form of glycogen and triacylglycerides.
• In the affluent Western world, excess food consumption leading to obesity ( OHCS8 p.530) is the most common form of malnutrition.
What happens to the major digestion products of food (i.e. glucose, amino acids, and triacylglycerides) on ingestion?
• Glucose and amino acids are taken to the liver by the portal vein before they enter the main circulation
• Lipids are absorbed via the lymph system which drains into the vena cava i.e. they are not subjected to first pass metabolism by the liver
• Lipids are transported in lymph/plasma as chylomicrons ( pp.114, 560)
• A rise in blood glucose triggers the release of insulin from pancreatic β-cells ( p.604).
• Taken up by the liver and stored as glycogen (glycogen synthesis, p.140)
• Glucose can be metabolized to pyruvate en route to fat synthesis
Triacylglycerides synthesized in the liver are carried in the blood in the form of VLDLs ( p.28)
• Continues into main circulation
• Used by brain and testis (almost solely dependent on glucose), red blood cells and renal medulla (obligatory glucose users)
• Taken up by muscle cells and stored as glycogen
Insulin triggers insertion of GLUT4 transporters to increase uptake capacity
• Taken up by adipocytes for conversion into fat
Insulin triggers insertion of GLUT4 transporters to increase uptake capacity.
• Used by liver for protein synthesis
Deaminated to give β-keto acid (ultimately pyruvate) and ammonia
• Pyruvate used for fat and glucose/glycogen synthesis; ammonia excreted via urea cycle
Protein synthesis by all tissues.
• Triacylglycerides are absorbed, via the lymph, and enter the main circulation
• Taken up by adipose tissue and stored
• Used by muscle as an energy source.
In fasting conditions, the liver will have exhausted its glycogen stores (and will have been gluconeogenic), and these stores need to be replenished.
• Due to the insulin-stimulated insertion of higher affinity GLUT4 (Km ∼5mM) glucose transporters into the membrane of muscle and adipose cells, these tissues will preferentially take up glucose
• The liver takes up relatively little glucose via GLUT2 (Km ∼17mM) and remains gluconeogenic for several hours after
• It replenishes its glycogen stores from deaminated dietary amino acids and lactate from glycolytic tissue (e.g. red blood cells).
In comparison to the fed state, when all tissues use exogenous glucose as a metabolic fuel, in a fasting state the body needs to use the energy it has stored as glycogen and fat. In starvation, protein will also be broken down to provide energy.
• The pancreatic β-cells release glucagon, triggered by a fall in blood glucose
• Skeletal muscle is unresponsive to glucagon
• During fasting, the liver no longer uses glucose as a fuel source
• During prolonged fasting/starvation, glucose use by other tissues falls as well
• Within 24–36h, muscle has almost entirely switched to other fuel sources (fatty acids, ketone bodies), and the brain starts using ketone bodies
• By ∼3 weeks, the brain has largely switched to ketone bodies
Red blood cells, renal medulla, and, to a diminished extent, brain, are the only tissues still using glucose
• Protein is not an inert energy store like fat or glycogen—breakdown of proteins such as muscles and enzymes is a last resort of starvation.
• During the initial unfed state of fasting, liver glycogen is broken down (glycogenolysis) and glucose released into the circulation
• This glucose is used by tissues such as the brain, red blood cells, and muscle
• The alanine cycle becomes important
Alanine is generated in muscle cells by amination of pyruvate and released into the bloodstream
The alanine is taken up by the liver and deaminated; the nitrogen is excreted as urea, while the pyruvate is converted into glucose by gluconeogenesis
• The Cori cycle (Fig. 2.3, p.99) operates
Similar to the alanine cycle, except involves lactate rather than alanine.
• In addition to being gluconeogenic, the liver becomes ketogenic and proteolytic (liver glycogen stores will have been exhausted)
• Ketone bodies are formed from fatty acids released by lipolysis in adipose cells
• Circulating fatty acids can be used directly as fuel by tissues e.g. muscle
• Ketone bodies are used as fuel by brain and muscle
• Glycerol from triacylglyceride breakdown is used by liver for gluconeogenesis
• Protein hydrolysis takes place in muscle, with alanine and glutamine being the main amino acids released
• Alanine participates in the alanine cycle
• Glutamine is metabolized by enterocytes, and alanine released
Glutamine is also an important fuel for cells of the immune system
• Liver proteins are also hydrolysed, with the amino acids used as substrates for gluconeogenesis.
There are two metabolically distinct forms of exercise: anaerobic (e.g. sprinting) and aerobic (e.g. marathon running).
• Tends to be of short duration but very intense
• Energy for muscle contraction comes from intramuscular stores (e.g. glycogen, phosphocreatine)
• Due to oxygen delivery not matching demand, muscle cells are glycolytic
• High levels of lactic acid in cells will cause muscle weakness and cramp, and also the fall in intracellular pH (pHi) will inhibit glycolysis, thus limiting further lactate production.
• Glucose from muscle glycogen is again the main source of energy
• Glucose uptake from the blood is also increased by non-insulin-dependent insertion of GLUT4 into the muscle cell plasma membrane
Glucose is released from liver glycogenolysis
• Muscle glycogen stores can be increased by depletion with exhaustive exercise, then rest and a high carbohydrate diet (‘carbohydrate loading’)
• Muscle also increases oxidation of branched-chain amino acids, ammonium production, and alanine release.
• There is not enough stored glycogen or a large enough capacity for glucose uptake into muscle cells to provide the necessary energy for running long distances
• Metabolic adaptation is similar to that for fasting
• Increase in lipolysis as glycogen stores become depleted (stimulated by glucagon)
• Fatty acids used directly as fuel by muscle or as ketone bodies (produced by ketogenesis in liver)
Little rise in blood ketone concentrations (unlike in fasting) as use by muscle matches liver production
• Progressive switch over to preferential fatty acid oxidation by muscle
Acetyl-CoA carboxylase inhibited by increase in AMP and long-chain acyl-CoA esters; reduced malonyl-CoA level stimulates carnitine palmitoyltransferase I activity and fatty acid oxidation
Any glucose still used is metabolized to lactate which enters the Cori cycle.
During pregnancy, the fetus can be thought of as metabolically speaking simply extra tissues that will require nutrients.
• Mainly uses glucose for energy, but can also use lactate, fatty acids, ketone bodies, and amino acids.
The placenta requires nutrients itself, but also plays a major metabolic role in pregnancy.
• Metabolizes glucose to lactate
• Either taken up by the fetus and used as energy source or returned to circulation to establish a placenta–liver Cori cycle
• Synthesizes placental steroids (oestradiol and progesterone)
• Precursor is maternal cholesterol (LDL)
• Induces an insulin-resistant state in pregnant woman
• Secretes polypeptide hormone placental lactogen (similar in structure to growth hormone)
• Stimulates lipolysis in adipose tissue
• Combination of lactogen and steroid hormone effects are to maintain plasma nutrient levels so that the fetus is well catered for
• Perturbed fed–starve cycle in pregnant woman
• Fetal consumption of nutrients results in faster maternal return to starved state after eating
Plasma glucose, amino acid, and insulin levels fall rapidly, and glucagons and placental lactogen levels rise, stimulating lipolysis and ketogenesis
Fetal consumption can cause maternal hypoglycaemia
• In the fed state, maternal insulin and glucose levels are increased (and there is insulin resistance)
• These dramatic swings in nutrient and hormone levels are accentuated by maternal diabetes
Controlling blood glucose in such cases is difficult, but important
Maternal hyperglycaemia adversely affects fetal development.
During lactation, the mammary gland takes up nutrients from the circulation:
• Glucose for making lactose (the major sugar in milk) and for triacylglyceride synthesis
• Amino acids for protein synthesis
• Fatty acids for triacylglyceride synthesis
• Directly from diet (chylomicrons)
If these compounds are not taken in the diet in sufficient amounts, then they will be sourced from gluconeogenesis, proteolysis, and lipolysis.
• In the long term, this can cause maternal malnutrition and, ultimately, the quality of the milk will fall.
p.606, OHCM8 pp.198–205)• Formerly known as insulin-dependent diabetes mellitus (IDDM)
• Sometimes also referred to as juvenile-onset diabetes, although not limited to onset in childhood
• Caused by defective or absent pancreatic β-cells
• β-cells are destroyed by an autoimmune response
• Glucagon from β-cells is the only output from the endocrine pancreas
• Body believes it is in a continuously starved state irrespective of nutritional input
• Symptoms include hyperglycaemia, hyperlipoproteinaemia (raised plasma chylomicrons, VLDL), severe ketoacidotic episodes
• Hyperglycaemia results both from the failure of muscle and adipose tissue to take up glucose (no insulin-dependent GLUT4 insertion) and liver being continuously gluconeogenic
Liver gluconeogenesis is fuelled by protein breakdown including muscle wasting (hence type 1 diabetes is sometimes referred to as ‘fed starvation’)
If untreated, will result in death in the same way as starvation
• Hyperlipoproteinaemia is from low levels of insulin-sensitive lipoprotein lipase activity in adipose tissue capillaries
• Ketogenesis results from increased lipolysis in adipose tissue and fatty acid oxidation in liver
Ketogenesis can lead to potentially fatal ketoacidosis in type 1 diabetes on account of prolonged or repeated hypoglycaemic episodes
• Symptoms reversible by exogenous insulin
• Regular injections and monitoring of blood glucose levels necessary
Variable diet and exercise levels make this more challenging for the patient.
p.606, OHCM8 p.198)• Formerly known as non-insulin-dependent diabetes mellitus (NIDDM)
• Accounts for up to 90% of diagnosed diabetes
• Usual onset is middle to older age
• Strong correlation with obesity
• Much concern that Western diet of ‘junk’ food and accompanying obesity will result in sharp rise in type 2 diabetes and lowering of average age of onset, to even as low as childhood
• Patients have insulin resistance, i.e. their insulin receptors are not as sensitive to circulating insulin
• Pancreatic β-cells do not produce enough insulin to overcome this resistance (‘β-cell failure’)
• Patients show hyperglycaemia, hypertriglyceridaemia (from liver synthesis rather than adipose tissue lipolysis), and other obesity symptoms
• Tend not to see ketoacidosis in type 2 diabetes.
• Energy is taken in the form of food
• Energy is expended as ‘basal metabolism’ (maintenance and repair of the organism), thermic effect of food (energy expenditure rises after meals), physical activity (‘exercise’), and non-planned physical activity (‘fidgeting’). Typically, 5–10% of dietary energy is lost in faeces
• Any difference between energy intake and expenditure is reflected in a change in the body’s energy store.
Positive energy balance (intake > expenditure) is a normal part of growth or anabolism, e.g. during recovery from surgery or trauma. Positive energy balance beyond the needs of growth leads to fat accumulation and, ultimately, overweight and obesity ( p.180).
Negative energy balance occurs during dieting or in anorexia, in people who become physically active for long periods (e.g. Mike Stroud and Ranulph Fiennes lost almost all their bodily energy reserves during their Antarctic crossing in 1992–3), and during periods of catabolism following major trauma or during severe infection.
Energy intake is regulated by endocrine and neuroendocrine mechanisms.
• Leptin is a peptide hormone secreted from adipocytes in response to the amount of fat stored
• Increasing fat storage leads to increasing circulating leptin concentrations
• Leptin acts through hypothalamic receptors and a complex neuroendocrine system to reduce appetite. However, in humans this system is directed more towards avoiding starvation (leptin deficiency is associated with intense hunger)
• Variation in leptin levels within the normal range seems not to have major effects on appetite
• Treatment with recombinant human leptin has been remarkably successful in rare patients with complete leptin deficiency (characterized by massive childhood obesity, sexual immaturity, and T-cell dysfunction) but has little effect in the normal obese patient.
Energy intake is determined, to some extent, by diet composition. It is easier to overconsume energy when the diet is ‘energy dense’ (high kJ per 100g).
• Energy-dense foods are generally those with little water and a high fat or sugar content (‘junk foods’ for instance)
• Fibre-rich (more ‘natural’) foods are generally low in energy density
• The relationship between dietary fat intake and obesity is not clear-cut within populations, although it is clear when comparing one population with another.
The major component of energy expenditure is normally basal metabolism, accounting typically for 60% of daily energy expenditure.
• Basal metabolic rate is determined almost entirely by lean body mass
• Thyroid activity is also a determinant (hyperthyroidism ( OHCM8 p.210) increases basal metabolic rate)
• Physical activity is the major component of energy expenditure that can be manipulated
• Daily energy expenditure may be expressed as a ratio to resting metabolic rate—the ‘physical activity level’ (PAL)
• Sedentary people have a PAL around 1.4; highly active people (e.g. soldiers in field training) have PALs up to 2.5; elite endurance athletes may maintain even higher PAL values, e.g. 3–4 in Tour de France cyclists.
We ingest nutrients that yield energy and nutrients that are essential for health.
• Energy-providing nutrients are also called macronutrients (fat, carbohydrate, and protein)
• Micronutrients include vitamins and minerals
• The distinction between energy-yielding and other essential nutrients is not absolute. We need to ingest specific (‘essential’) fatty acids and some essential amino acids. Water and oxygen are also essential but are not usually thought of as nutrients.
Nutritional disorders may involve a deficiency, an excess, or an imbalance of nutrients.
• In developed countries, the most common nutritional disorder by far, in both humans and their pet animals, is obesity ( OHCM8 p.530)
• Under-nutrition is still prevalent in many parts of the world
• This includes British hospitals: a number of surveys of inpatients have shown alarming degrees of malnutrition, especially in elderly patients. Poor nutrition in sick patients may increase morbidity and mortality.
• Fat is mainly ingested as triacylglycerol (triglyceride) (95% of dietary fat) but includes some phospholipids (4–5%) and cholesterol (typically 500mg/day)
• Fat provides 9kcal/g. It contributes an average of 35% of dietary energy in the UK
• This has fallen over the last few years and is now in line with the recommendations of the UK’s Committee on Medical Aspects of Food Policy (COMA) made in 1994
• Lowering fat intake decreases serum cholesterol and may reduce energy intake
• The fatty acids of dietary fat may be saturated (typical of animal fat but present in all fats), monounsaturated (animal fat and vegetable oils, especially olive and rapeseed oils), or polyunsaturated (typical of sunflower and safflower oils; these are called n-6 or ω -6 fatty acids)
• The energy content is almost identical but the effects on serum cholesterol differ: saturated fat raises and monounsaturated and polyunsaturated fats lower serum cholesterol
• Average UK intake of saturated fatty acids (13% of dietary energy) is still greater than COMA’s recommendation of not more than 11% of energy
• The characteristic polyunsaturated fatty acids of fish oils ( OHCM8 p.236) belong to the n-3 or ω -3 family. These lower serum triglyceride, inhibit platelet aggregation, and have generally anti-inflammatory properties.
Carbohydrates are diverse. The energy yield is 4kcal/g.
• Simple sugars are energy-dense ( p.172)
• Complex carbohydrates are absorbed more slowly and, because they may be hydrated in foods (e.g. potato is 80% water), are low in energy density
• Polysaccharides that are not digested in the small intestine (typically plant cell wall material) are classed as fibre or non-glycaemic carbohydrate
• Bacterial fermentation in the colon produces gas and short-chain fatty acids that may have beneficial effects on colonic function including cancer protection.
Most people in the Western world are not short of protein.
• Typical protein intake is 60–90g/day, whereas 40–50g/day is probably sufficient for life
• Vegetarians not consuming a range of protein sources may be at risk of deficiency of particular essential amino acids. Wheat (low in lysine) and legume protein (low in cysteine, methionine) complement each other.
• Protein yields 4kcal/g but its importance is not primarily as an energy source.
Alcohol provides energy (7kcal/g) and in some groups of people makes a substantial contribution to energy intake.
Micronutrients have diverse functions in the body. Anyone eating a balanced and varied diet that meets energy requirements is unlikely to suffer from vitamin deficiencies and, for most people, there is no clear evidence of benefit from supplementation. There are exceptions.
• High folic acid ( OHCM8 p.326) intake in the periconceptual period reduces neural tube defects in babies and fortification of flour with folic acid is mandatory in the US and Australia (not yet in Europe)
• Women with heavy menstrual losses may be iron deficient
• In the developing world it is estimated that billions of people suffer from micronutrient deficiency (iron, zinc, vitamin A)
• Some vitamins (A, D, E, and K) are fat-soluble and are only absorbed in the presence of dietary fat
• Vitamin B12 (a water-soluble vitamin) requires a specific protein, intrinsic factor, for its absorption
• Intrinsic factor is secreted from the gastric mucosa and impaired secretion will result in vitamin B12 deficiency and pernicious anaemia ( OHCM8 p.328)
• In some parts of the world there are mineral deficiencies in the soil, e.g.: selenium in China, some parts of the USA, and Finland; iodine in many upland areas of Africa, Asia, and South America. Public health campaigns are then needed to encourage supplementation.
Measurement of enzyme activity plays an important and continually increasing role in medical diagnosis. There are basically two applications of diagnostic enzymology—measurement of the enzyme itself, or exploitation of enzyme specificity to measure the concentration of its substrate.
This is important in two areas: assessment of tissue damage (in which enzymes from the affected tissue are released into the circulation) and diagnosis of specific enzyme deficiencies.
• In the case of tissue damage, the enzyme is being measured in an abnormal site, usually in serum, and results are dependent on the half-life of the protein after release from the cells of origin
• Enzymes released from tissues are cleared relatively rapidly from the circulation (half-lives of the order 10–20h) and this provides current information about the damage
• Many enzymes are present in a variety of different tissues and simple measurement of a single enzyme may not be sufficient to identify the site of origin
Measurement of several different enzymes or additional analysis of isoenzyme forms which may be preferentially expressed in particular tissues may provide the necessary specificity
Isoenzyme forms of lactate dehydrogenase, creatine kinase, and alkaline phosphatase are most widely used in this regard ( OHCM8 p.702).
• Enzyme activity is determined with saturating substrate concentrations and can be measured by following the rate of change in the concentration of substrate or product or by measuring the amount of substrate remaining or product formed after a specified time
• To avoid problems due to substrate depletion, reverse reaction, and product inhibition, conditions should be chosen to measure the initial rate, and all relevant conditions such as temperature and buffer composition and pH should be standardized
In some cases, it is necessary to couple the enzyme reaction being measured to a second enzyme-catalysed reaction in order to generate a readily detectable product
In this situation, it is necessary to ensure that the coupled enzyme and any additional substrates are not rate-limiting
• For the investigation of specific enzyme deficiencies, the same technical considerations are relevant
• However, these investigations are required much less frequently and are usually performed in specialist centres with the necessary experience and expertise
• While enzyme measurement for assessment of tissue damage is usually performed on serum samples, diagnosis of enzyme defects requires direct analysis of affected tissues
• Some defects are expressed in readily accessible samples, such as blood cells or cultured fibroblasts, but others may require tissue biopsy
• With increasing identification of the genes responsible for many enzyme deficiencies, direct mutation analysis, avoiding the need for biopsy and complex enzymological studies, is becoming more widely available.
The specificity of many enzyme-catalysed reactions can be exploited to measure the concentration of their substrate. This is particularly important when dealing with the complex mixtures of related compounds found in biological samples such as blood or urine.
• For example, there are several enzymes which oxidize glucose with the necessary specificity for measuring blood glucose concentration
• For this type of analysis, it is important that the equilibrium of the reaction lies far to the right and that there is sufficient enzyme to ensure almost complete conversion of substrate to product within a short time.
There are over 300 defined enzyme deficiencies affecting the function and regulation of many different metabolic pathways.
• Most present in the first years of life—many within the newborn period
• Although identification of specific enzyme deficiencies is performed by a small number of specialist laboratories, clues to the nature of the underlying biochemical defect can usually be found on the basis of a number of widely available screening tests.
Inborn errors of metabolism can be divided into three main groups based on the consequences of the biochemical defect, which in turn is related to the type of metabolic pathway involved.
Conditions due to accumulation of toxic metabolites. These include the disorders of amino acid oxidation and the related organic acidurias, defects of the urea cycle, and the various forms of carbohydrate intolerance.
• The reaction to toxic intermediates is non-specific
• Most patients present in the newborn period, but there may be delayed onset, often with milder symptoms
• Clues to the diagnosis are a period of normality after birth before symptoms commence, precipitation of symptoms by feeding or intercurrent illness, and a positive family history
• Common symptoms include feeding difficulties, vomiting, irritability, hypotonia, drowsiness, and seizures.
• A small number of inborn errors fulfil criteria for universal newborn screening. However, this is widely performed only for phenylketonuria
• When there is already an affected child in a family, early diagnosis in subsequent siblings, before the onset of symptoms, is associated with much better prognosis. Specific tests will be indicated depending on the prior diagnosis
• In all cases, rapid assessment is essential once symptoms of toxicity appear
• The most widely available and useful screening tests are for urine organic acids and urine and plasma amino acids
• Specific measurement of acid–base status, blood ammonia, glucose, and ketones, and liver function tests are usually required in addition.
Conditions with impaired energy generation. Disorders of glycogen mobilization, pyruvate metabolism, gluconeogenesis, fatty acid oxidation, and the mitochondrial electron transport chain.
• Symptoms may be precipitated by fasting, rather than feeding
• Neurological dysfunction is again prominent, but there may also be specific problems related to energetic failure in other organs such as heart, liver, kidney, and skeletal muscle.
• Most patients will be screened as for patients in group 1, although blood lactate and pyruvate concentrations are often more relevant, and the lactate concentration in cerebrospinal fluid may be particularly helpful in patients with predominantly neurological dysfunction
• Fasting tests and muscle biopsy for morphology and enzymology may be indicated, but are usually performed in specialist units.
These include the lysosomal storage diseases and peroxisomal diseases.
• These conditions are generally of later onset and are often characterized by organomegaly, with or without progressive neurodegeneration
• Appearance of features such as characteristic facial appearance, skeletal deformities, and corneal clouding may provide additional clues.
• Apart from analysis of urine, glycosaminoglycans (GAGs) for the diagnosis of the mucopolysaccharidoses, there are no screening tests for this group of conditions
• Vacuolated lymphocytes or foamy macrophages in bone marrow may provide a clue to a lysosomal storage disease, and plasma very long-chain fatty acids are often elevated in peroxisomal diseases. However, diagnosis is usually based on specific enzyme assays
• Once an inborn error of metabolism has been suggested on the basis of the tests outlined, further investigation and management is generally undertaken by specialist centres where expertise in laboratory diagnosis, monitoring, and long-term treatment (where possible) is available
• As many inborn errors of metabolism present with non-specific symptoms which can mimic other conditions, such as infection, the key role for the primary physician is to suspect that an inborn error may be the cause of the patient’s problems and to arrange for the appropriate screening and routine laboratory tests to be performed as quickly as possible
• While the course of many inborn errors of metabolism is unaltered by any therapy, there are continuing advances in management, especially of conditions due to accumulation of toxic metabolites
• It is in this group, particularly, that delayed diagnosis may result in a much poorer prognosis, with a high risk of permanent brain damage.
Obesity is an excessive accumulation of body fat.
• A useful measurement is the body mass index (BMI) ( OHCM8 p.237):

• A BMI of 25–30kg/m2 is usually taken to represent overweight; a BMI >30kg/m2 obesity
• However, a weight lifter (for instance) may have a BMI of 30kg/m2 without excessive fat accumulation
• More specific measurements of body fat content can be made from skinfolds (calipers), electrical impedance, body density (usually involving underwater weighing), dual-energy X-ray absorptiometry (DXA), or isotopic techniques to measure body water.
Obesity results from an excess of energy intake over energy expenditure ( p.172).
• The imbalance may be very small but, over a long period, a large change in fat accumulation occurs
• An extra pat of butter (12g) each day could, in principle, lead to accumulation of almost 50kg of body fat over 10 years
• Measurements of energy expenditure in obese people universally show this to be increased compared with lean people (hence energy intake must also be high)
• There is no evidence for ‘slow metabolism’ maintaining obesity except in particular medical conditions such as hypothyroidism (see OHCM8 p.212), although it is almost impossible to know what caused the obesity to develop initially.
Obesity has a strong inherited component.
• Nevertheless, there is clearly an interaction between genes and environment because the present alarming increase in obesity incidence cannot represent a sudden change in the gene pool
• Rather, it represents the effects of an ‘obesogenic’ environment (plentiful food, sedentary lifestyle) on a genetic background evolved to protect the organism from food shortages
• Almost all adult obesity is polygenic
• A small number of single-gene mutations causing obesity are known, mostly in children and young people
• In those cases in which the gene has been identified, these are all in pathways involved with appetite regulation, not energy expenditure.
Obesity is a medical, not a cosmetic problem.
• Obesity strongly increases the risk of developing type 2 diabetes, coronary heart disease, hypertension, gallstones, polycystic ovaries, various cancers, sleep apnoea, and osteoarthritis.
The distribution of body fat may be almost as important in this respect as the total amount.
• Upper-body (‘abdominal’) obesity poses far more of a health risk than does lower-body obesity
• This is simply estimated by measurement of waist circumference
A waist circumference of >102cm (men) or 88cm (women) is a call for action.
Treatment involves increasing energy expenditure (physical activity), decreasing energy intake, or both.
• Treating obesity is notoriously difficult, with poor long-term results—prevention would be a better public health strategy
• Despite many ‘fad diets’, ultimately they must act by reducing energy intake
• Pharmacological treatments include orlistat, which reduces dietary fat absorption by inhibition of pancreatic lipase. Metformin is useful in the obese type 2 diabetic patient (see p.606). Sibutramine, which acts on central appetite-regulating pathways and rimonabant, a novel cannabinoid-receptor blocker which helps both smoking cessation and weight loss, have both been withdrawn because of side-effects. ‘Incretin’-based therapies (mimicking or increasing the action of glucagon-like peptide 1), used in type 2 diabetes to augment insulin secretion ( OHCM8 p.200), also have a useful weight-reducing effect.
• ‘Bariatric’ surgery, which reduces the size of the stomach or bypasses sections of the small intestine, can be very effective but because of cost and significant morbidity is restricted to the grossly obese or those with other medical complications.