The Global Carbon Cycle
11.1 Introduction
Although many elements are essential to living matter, carbon is the key element of life on Earth. The carbon atom’s ability to form long covalent chains and rings is the foundation of organic chemistry and biochemistry. The biogeochemical cycle of carbon is necessarily very complex, since it includes all life forms on Earth as well as the inorganic carbon reservoirs and the links between them. Despite being a complicated elemental cycle, it is extensively studied and to date, probably the best understood elemental biogeochemical cycle. The possibility of global climatic change brought about by the enhanced greenhouse effect of fossil fuel CO2 in the atmosphere has also prompted much carbon-related research.
There exists a multitude of review articles and books about the carbon cycle available with varied degrees of detail and points of emphasis: e.g., Bolin (1970a,b); Keeling (1973); Woodwell and Pecan (1973); Woodwell (1978); Bolin et al. (1979); Revelle (1982); Bolin and Cook (1983); Degens et al. (1984); Warneck (1988); Watson et al. (1990); IPCC (1992); Siegenthaler and Sarmiento (1993); Sundqvist (1993); Schimel et al. (1995); and Heimann (1997) to name a few.
This treatment of the carbon cycle is intended to give an account of the fundamental aspects of the carbon cycle from a global perspective. After a presentation of the main characteristics of carbon on Earth (Section 11.2), four sections follow: 11.3, about the carbon reservoirs within the atmosphere, the hydrosphere, the biosphere and the lithosphere; 11.4, which covers some important fluxes between the reservoirs; 11.5, which gives brief accounts of selected models of the carbon cycle; and finally 11.6, describing natural and human-induced fluctuations in the carbon cycle. A recurring theme in this chapter will be to explore how mechanisms with different time scales in the carbon cycle influence the atmospheric cycle of CO2. These time scales on which various components of the global carbon cycle interact with the atmosphere are indicated in Fig. 11-1. The reader should take note that the question of atmospheric CO2 concentration, despite being of profound importance in today’s debate about human induced climate change, is only one detail of the global carbon cycle. Carbon is present everywhere and indeed most material motions and transformations are linked in one way or another to the global carbon cycle.
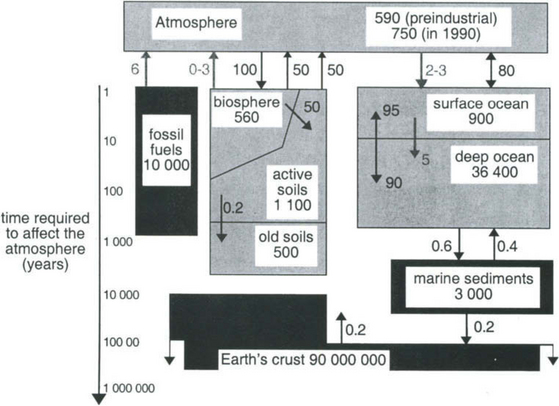
Fig. 11-1 Major reservoirs and fluxes of the global carbon cycle, including time scales. Numbers given are Pg C (1 Pg C = 1015 g C) Pg C/yr, respectively. (After Sundquist, 1993.)
The relevant time scales vary over many orders of magnitude, from millions of years (for processes controlled by the movement of the Earth’s crust) to days and even seconds for processes related to air-sea exchange and photosynthesis. Depending on the problem studied, models are usually constructed only to include processes that work on time scales judged to be relevant in the particular study. For example, most models used to study mankind’s perturbation of atmospheric CO2 exclude the geologic processes working on time scales longer than 5000 years and only include those processes that actively respond to atmospheric changes on the decadal time scale. Although the CO2 content in the atmosphere is modulated by changes in the exchange rates at the atmosphere-ocean and atmosphere-biosphere interface; the level of the CO2 concentration in the atmosphere is ultimately determined by geologic processes occurring on very long time scales. The
 controlled erosion rate, together with volcanism, releases carbon from the lithosphere into the ocean-atmosphere-biosphere system. This is counteracted by the sedimentation rate of carbon in the deep oceans. The balance between these two processes determines the long-term CO2 level in the atmosphere.
There are more than a million known carbon compounds, of which thousands are vital to life processes. The carbon atom’s unique and characteristic ability to form long stable chains makes carbon-based life possible. Elemental carbon is found free in nature in three allotropic forms: amorphous carbon, graphite, and diamond. Graphite is a very soft material, whereas diamond is well known for its hardness. Curiosities in nature, the amounts of elemental carbon on Earth are insignificant in a treatment of the carbon cycle. Carbon atoms have oxidation states ranging from +IV to –IV. The most common state is +IV in CO2 and the familiar carbonate forms. Carbonate exists in two reservoirs, in the oceans as dissolved carbon in the forms of H2CO3(aq), , and
, and , and in the lithosphere as solid carbonate minerals: CaCO3(s), CaMg(CO3)2, FeCO3. Carbon monoxide, CO, is a trace gas present in the atmosphere with carbon in oxidation state +II. Assimilation of carbon by photosynthesis creates the reduced carbon pools of the Earth. Reduced carbon is present with variable oxidation states that will be discussed further below. Methane, CH4, is the most reduced form of carbon with an oxidation state of – IV.
11.2 The Isotopes of Carbon
There are seven isotopes of carbon (10C, 11C, 12C, 13C, 14C, 15C, 16C) of which two are stable (12C and 13C). The rest are radioactive with half-lives between 0.74 s (16C) and 5726 years (14C). Only the stable isotopes and 14C (often referred to as “radiocarbon”) are included in this treatment of the carbon cycle.
The most abundant isotope is 12C, which constitutes almost 99% of the carbon in nature. About 1% of the carbon atoms are 13C. There are, however, small but significant differences in the relative abundance of the carbon isotopes in different carbon reservoirs. The differences in isotopic composition have proven to be an important tool when estimating exchange rates between the reservoirs. Isotopic variations are caused by fractionation processes (discussed below) and, for 14C, radioactive decay. Formation of 14C takes place only in the upper atmosphere where neutrons generated by cosmic radiation react with nitrogen:
The 14C content of the material in a carbon reservoir is a measure of that reservoir’s direct or indirect exchange rate with the atmosphere, although variations in solar also create variations in atmospheric 14C content activity (Stuiver and Quay, 1980, 1981). Geologically important reservoirs (i.e., carbonate rocks and fossil carbon) contain no radiocarbon because the turnover times of these reservoirs are much longer than the isotope’s half-life. The distribution of 14C is used in studies of ocean circulation, soil sciences, and studies of the terrestrial biosphere.
Fractionation is another major process responsible for creating inhomogeneities in the isotope distribution. Physical, chemical, and biological processes may be sensitive to the molecular weights of the molecules (atoms) involved. Thus exchanges between reservoirs can discriminate between different isotopes; for example when plants take up CO2 they preferentially take up 12C, this makes organic carbon on average lighter than atmospheric carbon. The definition of δ used to describe variations in isotope composition was introduced in Chapter 5. For 13C, δ13C, in parts per thousand, ‰, is defined by
Here 13RS is the 13C/12C ratio in the sample and 13R0 is the 13C/12C ratio the accepted standard PDB (PeeDee belemnite, after a Cretaceous belemnite rock from the PeeDee formation in North Carolina). Craig (1957a) has determined R0 to be 0.0112372.
The 14C content of a sample is described in a similar manner. The basis for 14R0 is an oxalic acid standard of the US National Bureau of Standards normalized for 13C fractionation and corrected for radioactive decay since a reference date January 1, 1950 (Stuiver and Polach, 1977). The absolute value of 14R0 is 1.176.10−12 (Stuiver et al., 1981).
14C content is usually reported in Δ14C units. The Δ14C scale was originally defined by Broecker and Olson (1959). The reasoning behind introducing the scale is that all variations in 14C due to fractionation should be eliminated by correcting for the sample’s observed 13C/12C ratio relative to that of postulated average terrestrial wood. The wood is assumed to have a δ13C value of – 25‰ and fractionation for the 14C isotope is assumed to occur as the square of that for 13C for all processes. The approximate expression for Δ14C proposed by Broecker and Olsson (1959) is
Δ14C is used frequently in modeling, since no corrections for fractionation are necessary when modeling fluxes between reservoirs.
11.3 The Major Reservoirs of Carbon
11.3.1 The Atmosphere
Carbon is present in the atmosphere mainly as CO2, with minor amounts present as CH4, CO and other gases. The CO2 content of the atmosphere is one of the best known quantities of the global carbon cycle. Accurate measurements were begun in 1957 (Keeling et al., 1976a,b; Bacastow and Keeling, 1981) with other groups following in the 1960s (Bischof, 1981) and 1970s (Pearman, 1981). One of the latest results of this research is shown in Fig. 11-2, which is a global picture of the variations in CO2 as function of latitude. The seasonal variations have a 6-month phase shift between the two hemispheres. The amplitude of the seasonal variations varies with latitude. The largest variations (10–15 ppmv) are seen at high latitudes, north of 50°N northern hemisphere. In southerly high latitudes the amplitude is only about 1 ppmv and along the equator there are small seasonal variations. The greater amplitude in the northern hemisphere is consistent with the occurrence of photosynthesis by extensive seasonal forests in that hemisphere that consume CO2 in the spring and summer and respirate it in the fall and winter. Another very obvious fact in the CO2 record is the increasing concentration caused by mankind’s perturbation of the carbon cycle. This is mainly due to the combustion of fossil fuel, but carbon mobilized from carbon pools on land, mainly oxidation of phytomass and soil organic carbon, is also significant. The atmospheric CO2 concentration at the end of 1997 was 365 ppmv at Mauna Loa. Estimates of the pre-industrial CO2 content from recent ice-core results (Etheridge et al., 1996) converge towards values close to 280 ppmv. Fossil fuel emissions (Marland and Boden, 1991; Marland and Rotty, 1984; Marland et al., 1989; Rotty, 1981) are well known: the trade in coal and oil has considerable economic value and is therefore well documented. Assuming that all fossil fuel produced is oxidized within a few years from its removal from the ground, a good estimate of the total emissions can be made. During the past decades there has been an average observed airborne fraction of about 0.55. (The observed airborne fraction is defined as the observed CO2 increase divided by the amount produced by fossil fuel combustion.) Since this quantity does not take any biospheric influences into account, it has limited value, although its use is widespread.
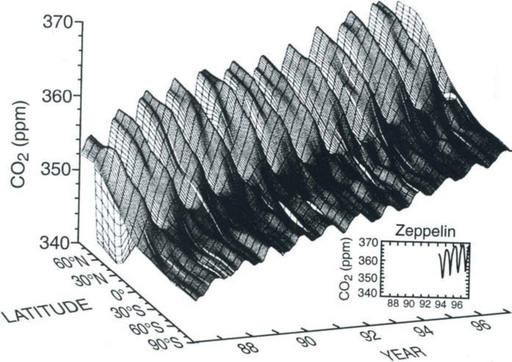
Fig. 11-2 Three-dimensional representation of the latitudinal distribution of atmospheric carbon dioxide in the marine boundary layer. The surface represents data smoothed in time and latitude. The Norwegian and Swedish flask sampling effort at Zeppelin Station is shown in the inset as flask monthly means. Data from the NOAA CMDL cooperative air sampling network were used. (Figure kindly provided by Dr Pieter Tans and Dr Thomas Conway of NOAA (CMDL).)
A recent development that has substantially raised our knowledge about the carbon cycle is the measurement of the O2/N2 atmospheric ratio (Heimann, 1997). Figure 11-3 shows the combined curves of CO2 for Mauna Loa and South Pole as well as the recent development of data regarding the oxygen to nitrogen ratio in the air. We can note that there is a clear decline of the oxygen ration in the atmosphere consistent with the consumption of oxygen through combustion of fossil fuel. In Fig. 11-2 we saw that the seasonal variability of CO2 is strongly dampened in the southern hemisphere; this is not true for atmospheric oxygen. To understand this one has to consider the carbonate chemistry in the oceans (see Section 10.4.2.5 of the previous chapter for an explanation of how dissolved inorganic carbon is dominated by carbonate and bicarbonate ions). Oxygen does not have the corresponding dissociation chemistry and will exchange freely between the surface waters and the atmosphere such that the seasonal cycle of oxygen in the surface waters is transferred into the atmosphere. The increase in CO2 simultaneous with a decrease in oxygen is consistent with a carbon dioxide source from oxidation of highly reduced (organic) carbon (fossil fuels, biomass, or soil carbon). In Fig. 11-4 the combined usage of CO2 and O2 is utilized to calculate what reservoirs must have been changing in size to explain the trends of both gases during the past years. There has apparently been a substantial terrestrial sink active during the early 1990s. This is discussed more later in the chapter.
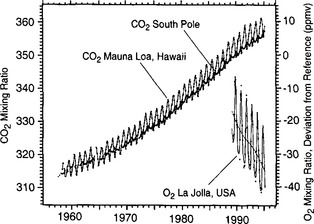
Fig. 11-3 Direct atmospheric measurements of the CO2 concentration (left-hand scale) at Mauna Loa (Hawaii) and the South Pole station (Keeling et al., 1995) together with the concurrently observed decrease in atmospheric oxygen content (right-hand scale) at La Jolla, CA after 1989. (Taken from Heimann (1997) with permission from the Royal Swedish Academy of Sciences.)
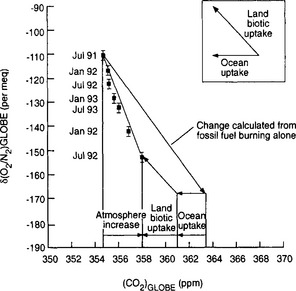
Fig. 11-4 Globally and annually averaged oxygen versus CO2 concentration from 1991 to 1994. The oxygen concentration is displayed as the measured O2/N2 ratio and expressed in “per meq” which denote the pm deviation from a standard ratio. The inset shows the directions of the state vector expected for terrestrial and oceanic uptake. The long arrow shows the expected atmospheric trend from fossil fuel burning if there were no oceanic and terrestrial exchanges. (Used with permission from Keeling et al. (1996). Nature 381: 218–221, Macmillan Magazines.)
There are a number of ways to estimate the pre-industrial atmospheric CO2 content. The total emissions (from fossil fuel combustion) during the period 1850 to 1982 are estimated at 173 Pg C with an uncertainty of less than 10 Pg (1 Pg = 1015 g). Assuming a constant airborne fraction of 0.54, a pre-industrial atmospheric CO2 content of 614 Pg (290 ppmv) is calculated (Bolin et al., 1981). This calculation does not take into account any biospheric emissions, nor is the assumption of a constant airborne fraction perfectly sound. Estimates of the pre-industrial CO2 content based on the carbonate chemistry of “old” ocean (water that has yet to be contaminated by anthropogenic carbon emissions) give values ranging between 250 (Chen and Millero, 1979) and 275 ± 20 ppmv (Brewer, 1978). In a critical examination of CO2 measurements performed in the 1880s, Wigley (1983) arrives at a CO2 level around 260–270 ppmv. Finally, measurements of CO2 content in air bubbles occluded in glacial ice from Antarctica and Greenland (Neftel et al., 1982; Barnola et al., 1983; Etheridge et al., 1996) give the least criticized data and indicate a value of 280 ±10 ppmv (see Fig. 11-5).
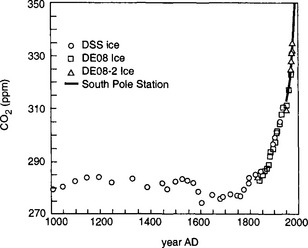
Fig. 11-5 CO2 content of air bubbles trapped in glacial ice from Greenland and Antarctica, showing a pre-industrial concentration of ca. 280 ppmv.
Approximately 1% of the atmospheric carbon budget is maintained by methane (Ehhalt, 1974). Current global background levels of CH4 are estimated at 1.7 ppmv, which corresponds to 3 Pg C (Blake and Rowland, 1988). Sources of methane are both natural and anthropogenic today. Important natural sources include fluxes from wetlands and enteric fermentation in wild animals (elephants and bison). Anthropogenic sources include rice paddies (to the extent they are placed in areas not previously part of natural wetlands), cattle (which have increased much more since the second world war than the decline in elephants and bison), coal mines, and leakage from gas fields (Crutzen, 1991; IPCC, 1990, 1992). Biomass burning is another substantial source of atmospheric methane. During the initial stages of burning there is usually an open flame in which essentially all carbon compounds are oxidized to CO2. After the open flames have subsided there is, however, a long period of time when the remaining coals are fuming, releasing a multitude of less oxidized compounds (see Fig. 11-6) (Crutzen and Andreae, 1990; Hao et al., 1996; Levine, 1994). Leakages from gasfields in the Former Soviet Union (FSU) were notorious. During the 1990s the increase rate of atmospheric methane has decreased substantially probably to an extent due to infrastructure development in Russia combined with a general decrease in the gas extraction in FSU. The main sink for methane in the atmosphere is oxidation by the hydroxyl radical (·OH).
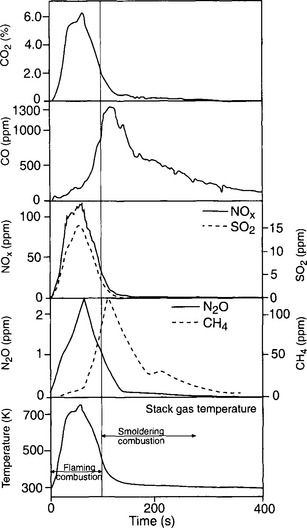
Fig. 11-6 Concentrations of gases in the smoke from an experimental fire of Trachypogon grass from Venezuela as a function of time and the stack gas temperature. The dotted line separates the flaming phase from the smoldering phase. Concentrations are in percent by volume for CO2, in volume mixing ratios (ppm) for the other species (1% = 10 000 ppm). (Used with permission from Crutzen and Andreae (1990). Science 250: 1669–1678, AAAS.)
Oxidation of methane is one of the sources of atmospheric CO. Another internal source of importance is the oxidation of terpenes and isoprenes emitted by forests (Crutzen, 1983). Important are also biomass burning activities (Crutzen and Andreae, 1990; Hao et al., 1996; Levine, 1994). The carbon monoxide concentration in the atmosphere ranges from 0.05 to 0.20 ppmv in the remote troposphere (with considerable differences between the northern and southern hemispheres) which means that about 0.2 Pg of carbon is present as CO in the atmosphere.
Apart from CO2, CH4, and CO there are many gases containing carbon present in the atmosphere, terpenes, isoprenes, various compounds of petrochemical origin and others. We will not discuss them further, although some, like dimethylsulfide (DMS, (CH3)2S), are of great importance in the biogeochemical cycles of other elements. The total amount of atmospheric carbon in forms other than the three discussed is estimated at 0.05 Pg C (Freyer, 1979).
11.3.2 The Hydrosphere
Oceanic carbon is mainly present in four forms: dissolved inorganic carbon (DIC), dissolved organic carbon (DOC), particulate organic carbon (POC), and the marine biota itself. The marine biota, although it is a small carbon pool with a standing crop of about 3 Pg C (De Vooys, 1979) has a profound influence on the distribution of many elements in the sea (Broecker and Peng, 1982). Primary production in the photic zone is the major input of organic carbon in the oceans (Mopper and Degens, 1979). Labile (reactive) organic compounds are efficiently reoxidized in the mixed layer, whereas less than 10% of the primary production is distributed into the reservoirs of POC and DOC. Williams (1975) has used 14C techniques to determine the average age of deep water DOC to be 3400 years. The DOC is thus clearly older than the turnover time of water in the deep oceans (100–1000 years) indicating the persistent nature of the dissolved organic compounds in the seas.
A detailed characterization of DOC is difficult to make; a large number of compounds have been detected but only a small portion of the total DOC has been identified. Identified species include amino acids, fatty acids, carbohydrates, phenols and sterols. The amount of carbon in the oceans as DOC is estimated to 1000 Pg and the amount present as POC is about 30 Pg (Mopper and Degens, 1979).
DIC concentrations have been studied extensively since the appearance of a precise analytical technique (Dyrssen and Sillén, 1967; Edmond, 1970). The aquatic chemistry of CO2 has been treated extensively; reviews can be found in Skirrow (1975), Takahashi et al. (1980), and Stumm and Morgan (1981). When CO2 dissolves in water it may hydrate to form H2CO3(aq) which in turn dissociates to and
and . The conjugate pairs responsible for most of the pH buffer capacity in seawater are
 and B(OH)3/
 (with some minor contributions from silicate and phosphate). Although the predominance of
 at the oceanic pH of 8.2 actually places the carbonate system close to a pH buffer minimum, its importance is maintained by the high DIC concentration (≈2 mM). Ocean water in contact with the atmosphere will, if the air-sea gas exchange rate is short compared to the mixing time with deeper waters, reach equilibrium according to Henry’s Law.
Two further reactions to be considered are the ionization of water and the borate equilibrium:
In order to be able to solve for hydrogen ion concentration we define total borate (SB) and total carbon (ΣC ≡ DIC) as
 represents the sum of CO2(aq) and H2CO3. Alkalinity, a capacity factor, representing the acid neutralizing capacity of the aqueous solution, is given by the following equation (ignoring influences from some minor components like phosphate and silicate) (see also Chapter 5):
Given any two of the four quantities ΣC, Alk, pH, , the other two can always be calculated provided appropriate equilibrium constants are available (the equilibrium constants depend on temperature, salinity and pressure). Hydrogen ion concentration, for example, be calculated from Alk and ΣC with the equation
K1 and K2 are the dissociation constants for H2CO3. Alkalinity and ΣC are the analyzed values and ΣB is calculated from salinity. can then be calculated by
where KH is the Henry’s Law constant for CO2 described in Chapter 5. At the pH of ocean water (about 8) most of the DIC is in the form of and
and (Fig. 11-7) with a very small proportion being [H2
 ]. Although [H2
 ] changes in proportion to CO2(g), the ionic forms changes little as a result of the various acid-base equilibria. This fact is responsible for the “buffer” factor (buffer here refers to buffering of CO2 exchange) also known as the “Revelle” factor (Revelle and Suess, 1957). See Chapter 4 for an application of this factor. The buffer factor is defined by
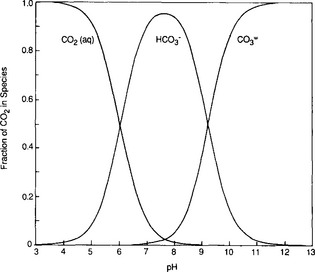
Fig. 11-7 Distribution of dissolved carbon species in seawater as a function of pH. Average oceanic pH is about 8.2. The distribution is calculated for a temperature of 15°C and a salinity of 35‰. The equilibrium constants are from Mehrbach et al. (1973).
Figure 11-8 shows how , pH, and β are dependent on ΣC and Alk. Note that in Fig. 11-8 that organic carbon formation (or the opposite process, respiration) is moving parallel to the alkalinity in the diagram (apart from a small alkalinity change due to nitrate and phosphate uptake) axis whereas calcium carbonate formation represents a vector that decreases DIC by one unit for every two units of alkalinity (moles and equivalents respectively). For current atmospheric
 , prevailing temperature and salinity, β is about 14 in polar regions and about 10 in equatorial waters. The significance of β ∼ 10 is that for a 10% increase in atmospheric
 only a 1% increase in ΣC is necessary to reach a new equilibrium. The buffer factor’s large value is important since it greatly constrains the ocean’s ability to take up increases in atmospheric CO2. Average DIC and Alk concentrations for the world oceans can be seen in Fig. 11-9. With an average DIC of 2.35 mmol/kg seawater and a world oceanic volume of 1370 × 106 km3 the DIC carbon reservoir is estimated to be 37 900 Pg C (Takahashi et al., 1981). The surface waters of the ocean contain a minor part of the DIC 700 Pg C. Nevertheless, the surface waters play an important role as a means of communication between the atmosphere and the deep oceans. Although DIC is a large carbon reservoir with lively exchange with the atmosphere, its importance as a sink for anthropogenic CO2 emission is restricted by several factors. The static uptake capacity of the seawater (solubility and “buffer” factor), the slowness of attainment of equilibrium between the ocean water and atmosphere, the ventilation of the deep ocean, and the oceanic sedimentation rate all impose constraints on the role of the oceans as a sink for atmospheric CO2. The sluggish deep water formation rates essentially dictated by the fact that the oceans are heated from above which creates a very stable stratification creates a central bottleneck in the carbon cycle. Despite a very rapid exchange of carbon between the surface waters and the atmosphere the carbon is not transported away from the atmosphere. The turnover time of carbon dioxide in the atmosphere is short (a few years) but the ability of the carbon cycle to transport excess carbon (like anthropogenic releases of fossil fuel) away from the atmosphere is much longer (decades to hundreds of years). A significant consequence of this is that releases of CO2 into the atmosphere will create a perturbation of the atmospheric concentration of CO2 that will require hundreds of years to fully equilibrate.
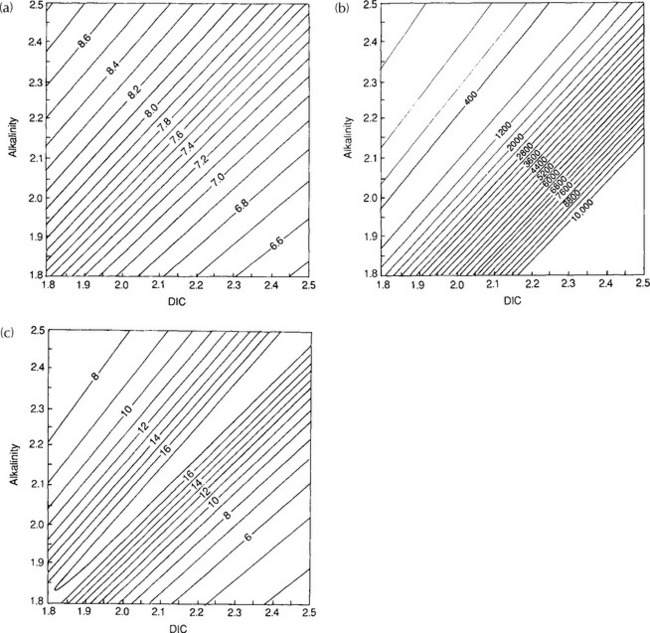
Fig. 11-8 Isolines of pH (a), (b), and the Buffer factor (c) plotted as functions of DIC and alkalinity. The lines have been calculated for a temperature of 15°C and a salinity of 35‰. The equilibrium constants for K1 and K2 are from Mehrbach et al. (1973), K0 from Hansson (1973) and B calculated from salinity according to the formula given by Culkin (1965).
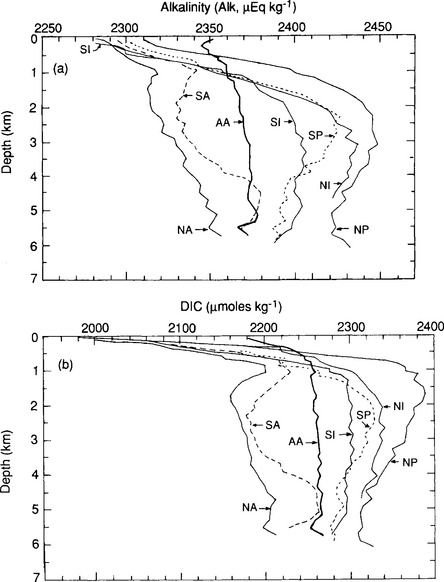
Fig. 11-9 (a) The vertical distributions of alkalinity (Alk) and dissolved inorganic carbon (DIC) in the world oceans. Ocean regions shown are the North Atlantic (NA), South Atlantic (SA), Antarctic (AA), South Indian (SI), North Indian (NI), South Pacific (SP), and North Pacific (NP) oceans. (Modified with permission from T. Takahashi et al., The alkalinity and total carbon dioxide concentration in the world oceans, in B. Bolin (1981). “Carbon Cycle Modelling,” pp. 276–277, John Wiley, Chichester.)
Oceanic surface water is everywhere supersaturated with respect to the two solid calcium carbonate species calcite and aragonite. Nevertheless carbonate precipitation is exclusively controlled by biological processes, specifically the formation of hard parts (i.e., shells, skeletal parts etc.). The very few existing accounts of spontaneous inorganic precipitation of CaCO3(s) (so-called “whitings”) come from the Bahamas region of the Caribbean (Morse et al., 1984).
The detrital rain of carbon-containing particles can be divided into two groups: the hard parts comprising calcite and aragonite and the soft tissue containing organic carbon. The composition of the soft tissue shows surprising uniformity, the average composition being (CH2O)106 (NH3)16PO4 (see Chapter 10, Section 10.3.1). The average composition of the particulate matter (here a composite of organic and inorganic particles) settling through the water column and subsequently being dissolved in the deep ocean is given by P:N:C:Ca:S = 1:15:131:26:50 (Broecker and Peng, 1982) with a CaCO3-C/Org-C ratio of 1:4. Calculating an average composition of the carbon that actually is deposited in sediments is more difficult since the areas of deposition are different for organic and inorganic carbon. More than 90% of the deposition of organic material takes place on the continental shelves; soft tissues falling into the deep oceans are consumed by heterotrophic organisms before isolation from the water column within the sediments.
The solubility of calcite and aragonite increases with increasing pressure and decreasing temperature in such a way that deep waters are undersaturated with respect to calcium carbonate, while surface waters are supersaturated. The level at which the effects of dissolution are first seen on carbonate shells in the sediments is termed the lysocline and coincides fairly well with the depth of the carbonate saturation horizon. The lysocline commonly lies between 3 and 4 km depth in today’s oceans. Below the lysocline is the level where no carbonate remains in the sediment; this level is termed the carbonate compensation depth.
The variations in 14C seen in the deep oceans of the world (Fig. 11-10) show features created by radioactive decay. The radiocarbon distribution is an important tool for determining the replacement times of the deep oceans. Great care has to be taken when interpreting the 14C distribution to take into account mixing between waters of different origin. This is especially true in the Atlantic, since the degree of isotopic equilibrium reached between the air and surface waters is different in the two source areas of Atlantic deep water, the Arctic and Antarctic surface waters (Broecker, 1979). This complication makes the apparent 14C age in seawater not simply a measure of the time elapsed since isolation from the atmosphere but a complex blending of the effects of water-mass mixing and uneven degrees of isotopic equilibrium in the ocean.
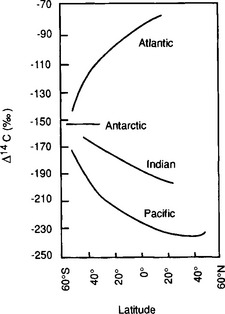
Fig. 11-10 The Δ14C values of the cores of the North Atlantic, Pacific, and Indian Oceans deep waters. The oldest waters are encountered near 40°N in the Pacific Ocean. (Modified with permission from M. Stuiver et al. (1983). Abyssal water carbon-14 distribution and the age of the world oceans, Science 219, 849–851, AAAS.)
Care must also be taken to not confuse the 14C perturbation, e.g. from nuclear weapons testing with the ΔCO2 perturbation lifetime. The former is largely due to fast isotopic exchange while the latter is controlled by a slower mass flux.
11.3.3 The Terrestrial Biosphere
Large amounts of carbon are found in the terrestrial ecosystems and there is a rapid exchange of carbon between the atmosphere, terrestrial biota, and soils. The complexity of the terrestrial ecosystems makes any description of their role in the carbon cycle a crude simplification and we shall only review some of the most important aspects of organic carbon on land. Inventories of the total biomass of terrestrial ecosystems have been made by several researchers, a survey of these is given by Ajtay et al. (1979).
Primary production maintains the main carbon flux from the atmosphere to the biota. In the process of photosynthesis, CO2 from the atmosphere is reduced by autotrophic organisms to a wide range of organic substances. The complex biochemistry involved can be represented by the formula
Gross primary production (GPP) is the total rate of photosynthesis including organic matter consumed by respiration during the measurement period, while net primary production (NPP) is the rate of storage of organic matter in excess of respiration. There are two main routes taken to estimate the world NPP and standing phytomass. The first method is to classify the biosphere into ecosystems in which, from measurements of estimates, values for the primary productivity and phytomass are assigned. The alternative method is to use estimates made by prognostic models simulating the effects of environmental factors on productivity and phytomass.
The possible effects of increased atmospheric CO2 on photosynthesis are reviewed by Goudriaan and Ajtay (1979) and Rosenberg (1981). Increasing CO2 in a controlled environment (i.e., greenhouse) increases the assimilation rate of some plants, however, the anthropogenic fertilization of the atmosphere with CO2 is probably unable to induce much of this effect since most plants in natural ecosystems are growth limited by other environmental factors, notably light, temperature, water, and nutrients.
Estimates of terrestrial biomass vary considerably, ranging from 480 Pg C (Garrels et al., 1973) to 1080 Pg C (Bazilevich et al., 1970). Bazilevich et al. attempted to estimate the magnitude of the biomass before mankind’s perturbation of the ecosystems. The latest work that undoubtedly had the most data available estimates the total terrestrial biomass, valid as of 1970, as 560 Pg C (Olson et al., 1983).
Terrestrial biomass is divided into a number of subreservoirs with different turnover times. Forests contain approximately 90% of all carbon in living matter on land but their NPP is only 60% of the total. About half of the primary production in forests yields twigs, leaves, shrubs, and herbs that only make up 10% of the biomass. Carbon in wood has a turnover time of the order of 50 years, whereas turnover times of carbon in leaves, flowers, fruits, and rootlets are less than a few years. When plant material becomes detached from the living, plant carbon is moved from the phytomass reservoir to litter. “Litter” can either refer to a layer of dead plant material on the soil or all plant materials not attached to a living plant. A litter layer can be a continuous zone without sharp boundaries between the obvious plant structures and a soil layer containing amorphous organic carbon. Decomposing roots are a kind of litter that seldom receives a separate treatment due to difficulties in distinguishing between living and dead roots. Average turnover time for carbon in litter is thus about 1.5 years, although caution should be observed when using this figure. For tropical ecosystems with mean temperatures above 30°C the litter decomposition rate is greater than the supply rate so storage is impossible. For colder climates NPP exceeds the rate of decomposition in the soil. The average temperature at which there is balance between production and decomposition is about 25°C. The presence of peat, often treated as a separate carbon reservoir, exemplifies the difficulty in defining litter. The total amount of peat is estimated at 165 Pg C (Ajtay et al., 1979). Figure 11-11 illustrates this very strongly. The tropics have an extremely high NPP but very little carbon in the soil; whereas all higher latitude areas have the opposite relationship. The dynamics of the carbon reservoirs is very different on either side of the balance isotherm. Also thought provoking is the fact that a very large proportion of the areas that are covered today with carbon-rich soils have appeared in areas covered by ice shields during ice ages; much of the carbon in these soils today has probably been deposited since the last glaciation. A climatic change that moves the balance isotherm polewards would most likely give rise to a net flux of carbon to the atmosphere from regions that today are close to balance or in carbon accumulation zones. The zones of soil carbon accumulation are also the zones most likely to experience growth limitation due to lack of nutrients since the continuous deposition of carbon will always retain some nutrients (e.g., N and P). Another observation regarding Fig. 11-11 is that land-use changes occurring today in the tropics mobilize carbon to the atmosphere by the decrease in standing biomass; the companion flux of soil carbon oxidized upon plowing of virgin land is much smaller than for opening new agricultural land in temperate regions. This is something that occurred in Europe and North America during the nineteenth century. Many of these lands are today being abandoned because of changes in agricultural practice; this gives rise to a net flux of carbon from the atmosphere to the standing biomass and soils (Sedjo, 1992). In the perspective of national carbon balances there are several complications; the net uptake today in temperate regions is only possible due to an early release of carbon due to land use changes. This illustrates two aspects of carbon exchanges and the terrestrial biosphere, the time scales of exchange can be long and simultaneously human behavior can alter the reservoirs rapidly upon change of human habits (see Fan et al., 1998).
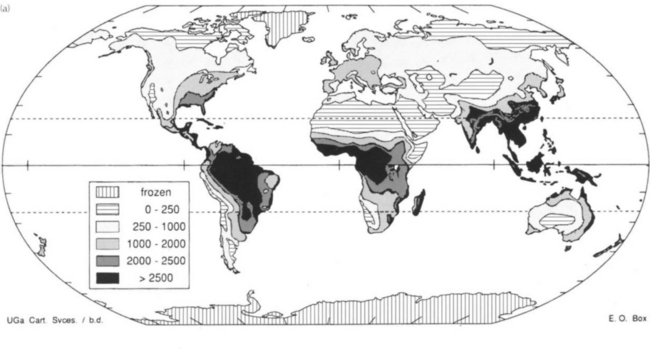
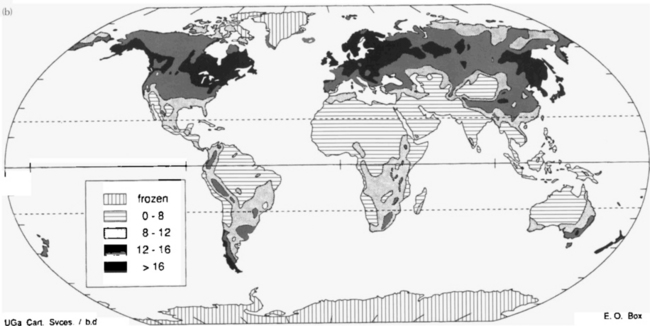
Fig. 11-11 (a) Global distribution of carbon produced annually, in grams of dry matter/m2 per year. (b) Global distribution of carbon preserved in soils, in kg/m2. (Both figures from Box and Meentemeyer (1991), used with permission from Elsevier Publishers.)
There is a group of organic compounds in terrestrial ecosystems that are not readily decomposed and therefore make up a carbon reservoir with a long turnover time. There are also significant structural differences between the marine and terrestrial substances (Stuermer and Payne, 1976). The soil organic matter of humus is often separated into three groups similar in structural characteristics but with differing solubility behavior in water solutions. Humic acids, fulvic acids, and humin are discussed in Chapter 8. Schlesinger (1977) presented an assessment of the various carbon pools for temperate grassland soil (Fig. 11-12). The undecomposed litter (4% of the soil carbon) has a turnover time measured in tens of years, the 22% of the soil carbon in the form of fulvic acids is intermediate with turnover times of hundreds of years. The largest part (74%) of the soil organic carbon (humins and humic acids) also has the longest turnover times (thousands of years).
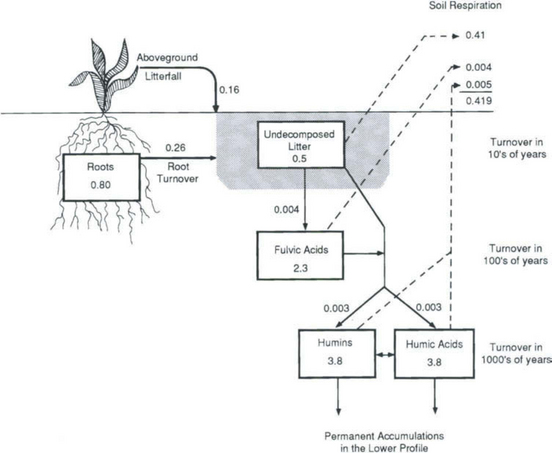
Fig. 11-12 Detrital carbon dynamics for the 0–20 cm layer of chernozem grassland soil. Carbon pools (kg C/m2) and annual transfers (kg C/m2 per year) are indicated. Total profile content down to 20 cm is 10.4 kg C/m2. (Reproduced with permission from W. H. Schlesinger (1977). Carbon balance in terrestrial detritus, Ann. Rev. Ecol. Syst. 8, 51–81, Annual Reviews, Inc.)
11.3.4 The Lithosphere
Although the largest reservoirs of carbon are found in the lithosphere, the fluxes between it and the atmosphere, hydrosphere, and biosphere are small. It follows that the turnover time of carbon in the lithosphere is many orders of magnitude longer than the turnover times in any of the other reservoirs. Many of the current modeling efforts studying the partitioning of fossil fuel carbon between different reservoirs only include the three “fast” spheres; the lithosphere’s role in the carbon cycle has received less attention.
Fossil fuel burning is an example of mankind’s ability to significantly alter fluxes between reservoirs. The burning of fossil fuel transfers carbon from the vast pool of reduced carbon in the lithosphere to the atmosphere, and hence to the biosphere, hydrosphere, soils and sediments. The elemental carbon reservoir is estimated from average carbon contents in different types of rocks, ranging from 0.9% elemental carbon in shales to 0.1% in igneous and metamorphic rocks (Kempe, 1979b) and the relative abundance of the rock types. The resulting estimate is 2 × 10⁷ Pg C (Hunt, 1972), a single reservoir several orders of magnitude larger than the sum of all reservoirs discussed so far. Of the 2 × 10⁶ Pg of recycled elemental carbon (recycled carbon has traveled at least once through the lithospheric cycle) in the lithosphere only 104 Pg make up the economically extractable reserves of oil and coal. Most of the reduced carbon species in the Earth’s crust are highly dispersed and probably never will be used as fuels. The carbonate minerals distributed in sedimentary rocks represent a carbon reservoir that is even larger than the elemental carbon reservoir. About three-fourths of the carbon in the Earth’s crust is present as carbonates. Several forms exist; the dominant biogenic forms are calcite and aragonite. Both are stoichiometrically CaCO3 but calcite has six-coordinated Ca atoms and is capable of substituting several percent Mg into its lattice. Aragonite has nine-coordinated Ca atoms and several percent Sr can be incorporated into its lattice. Both forms can precipitate depending on the Ca/Mg ratio in the solution; for the present ocean Mg-calcite or aragonite are precipitated. Dolomite (CaMg(CO3)2) is a carbonate mineral of wide importance formed by diagenetic disintegration of Mg-rich calcites. Formation of dolomite is slow today and largely confined to evaporitic settings (Holland, 1978). The invasion of land by plants 600 million years ago, at the beginning of the Phanerozoic era increased the availability of CO2 in the soil. There was a marked decrease of dolomitic sediments and increase in limestone sediments coherent with the appearance of terrestrial vegetation (Fig. 11-13).
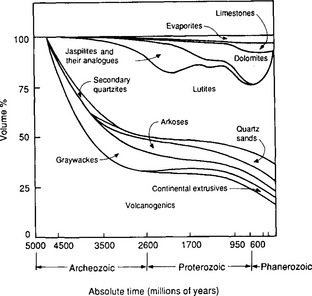
Fig. 11-13 Volume percent of sedimentary rocks as a function of age. (Modified with permission from A. B. Ronov (1964). On the post-Cambrian geochemical history of the atmosphere and hydrosphere, Geochemistry 5, 493–506, American Geological Institute.)
11.4 Fluxes of Carbon between Reservoirs
Carbon is released from the lithosphere by erosion and resides in the oceans ca. 105 years before being deposited again in some form of oceanic sediment. It remains in the lithosphere on the average 108 years before again being released by erosion (Broecker, 1973). The amount of carbon in the ocean–atmosphere–biosphere system is maintained in a steady state by geologic processes; the role of biological processes is, however, of profound importance for the partitioning of carbon between the “fast” reservoirs.
Chemical weathering of crustal material can both add and withdraw carbon from the atmosphere. This has been discussed in Chapter 8. The oxidation of reduced carbon releases CO2 to the atmosphere,
whereas dissolution of carbonates is associated with uptake of CO2:
Silicates also lead to uptake of CO2. Weathering of a non-aluminum silicate like Mg-olivine may be written
An example of aluminosilicate weathering is the reaction of the feldspar albite to a montmorillonite-type mineral
In the weathering of carbonates, one mole of rock CO2 is mobilized for each mole of atmospheric CO2 consumed. The reverse reaction (sedimentation of carbonate in the oceans) will again release one mole equivalent of CO2(g). For the weathering of silicates there is a 1:1 relationship between CO2(g) consumed and produced, in contrast to the 1:2 relationship for carbonate weathering. Estimates of global erosion rates are based either on average river data (Livingstone, 1963; Kempe, 1979b) or on global material balance calculations performed by extrapolating the material balance from a well documented area to the world (Kempe, 1979b).
The freshwater cycle is an important link in the carbon cycle as an agent of erosion and as a necessary condition for terrestrial life. Although the amount of carbon stored in freshwater systems is insignificant as a carbon reservoir (De Vooys, 1979; Kempe, 1979a), about 90% of the material transported from land to oceans is carried by streams and rivers.
Pure water in equilibrium with atmospheric CO2 has a pH of about 5.6 at ambient temperatures. Although rainwater pH is affected by other airborne species with acid-base characteristics (Charlson and Rodhe, 1982), calculating the flux of carbon carried from the atmosphere to the surface by pH 5.6 rainwater is a good approximation, if a bit large. According to the weathering reaction, half the bicarbonate in stream water originates in the atmosphere. Rainwater clearly is unimportant as source for this carbon. Air within soils is the major source of CO2 taking part in weathering reactions with carbonates and silicates. Bacterial decomposition of organic material together with root respiration maintain high partial pressures of CO2 in soil air ( Chapter 7 and Kempe, 1979a). Approximately 0.4 Pg C/yr are withdrawn from the atmosphere by weathering reactions, 0.1 Pg C/yr is released by oxidation of elemental carbon, yielding a net flux of 0.3 Pg C/yr from atmosphere to lithosphere (Holland, 1978). The importance of the presence of liquid water on the face of the Earth, despite the relatively small numbers indicated above, is of profound importance for the state of the planet. The process of precipitating carbonate minerals would probably not proceed without water; a consequence would then be that most of the carbon presently deposited in the lithosphere would be present as CO2 in the atmosphere much like the atmospheres on Venus and Mars.
Garrels and Mackenzie (1971) calculated global river loads based on Livingstone’s (1963) data. From these figures Kempe (1979a) deduced a total flux of 0.84 Pg/yr with rivers where about half is in the form of DIC and the rest being approximately evenly distributed between PIC, DOC, and POC.
Kempe (1979b) also estimates the flux of carbon from the lithosphere to oceans from glacial erosion (0.033 Pg/yr), global dust production (0.06 Pg/yr) and marine erosion (0.0045 Pg/yr) to give a combined flux of 0.1 Pg/yr. Although there is a general consensus that geologic processes control the amount of carbon in the ocean-atmosphere system, the mechanisms are debated. Walker (1977) assumes a steady-state model where the weathering rate is dependent on the CO2 partial pressures in the atmosphere. An increase in will give a higher weathering rate, which results in an increase of the cation content of the oceans. The increased cation concentration yields a higher precipitation rate of carbonates which removes carbon, thereby restoring the original balance. The long-term atmospheric carbon dioxide budget is thus governed by a volcanic source and consumption by the weathering of silicates. Volcanism does not depend on atmospheric
 , but weathering does. The equilibrium level of CO2 is therefore determined by the demand that the weathering sink must just balance the volcanic source. Holland (1978) presents somewhat different arguments and deduces, from balance calculations, indications of a juvenile carbon flux from the Earth’s interior of 0.08 Pg C/yr.
The exchange of carbon between the terrestrial biosphere and atmosphere goes through two channels. CO2 is the major route with CH4 making up about 1% of the exchange. Methane is mainly produced by enteric fermentation by animals, and anaerobic production in paddy fields, freshwater lakes, swamps, and marshes. Ehhalt (1974) estimates an upper limit for the herbivore production of methane from an assumption that 10% of the dry plant matter produced on land is consumed by herbivores and the food to methane conversion ratio for cattle is valid for all herbivores (cattle have the highest measured ratio). The present upper limit is 0.17 Pg C/yr with a range down to 0.08 Pg C/yr. Interestingly, the increase in world cattle population since the early 1940s accounts for about 25% of this figure. Methane emissions to the atmosphere from freshwater lakes, swamps and marshes are in the range of 0.15–0.22 Pg C/yr. The total flux of methane to the atmosphere is thus 0.5 Pg C/yr.
Carbon monoxide emissions from the terrestrial biosphere are small, but forest fires produce 0.02 Pg C/yr. Degradation of chlorophyll is dying plant material seems to be the largest CO-producing mechanism at 0.04–0.2 Pg C/yr (Freyer, 1979).
The exchange of CO2 between the atmosphere and terrestrial biota is one of the prime links in the global carbon cycle. This is seen by studying the variations of 13C in the atmosphere. Figure 11-14 presents atmospheric Δ13C for the years 1956 and 1978. The lines are consistent with addition or subtraction of CO2 with a Δ13C of about – 27‰, which could be derived from either fossil fuel or plant CO2. It cannot be oceanic because surface water DIC has a Δ 13C of about +2‰ (Kroopnick, 1980). This confirms that the annual variations are primarily due to exchange with the terrestrial biosphere, and not caused by seasonal exchange with the oceans. This result has now been further confirmed by the already mentioned O2/N2 measurements (Heimann, 1997 and Fig. 11-3).
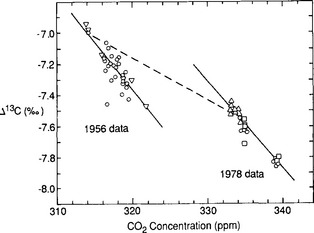
Fig. 11-14 Change in the relation between δ13C and concentration of atmospheric CO2 over 22 years. Mean change is shown as a dashed line. Solid lines show mixing relations for 1956 and 1978. __ denotes inferred northern hemispheric means for 1956 and 1978. (Modified with permission from C. D. Keeling et al. (1979). Recent trends in the 13C/12C of atmsopheric carbon dioxide, Nature 277, 121–123, Macmillan Magazines.)
Many estimates of total terrestrial net primary production are available, ranging between 45.5 Pg C/yr (Lieth, 1972) and 78 Pg/yr (Bazilevich et al., 1970). Ajtay et al. (1979) have revised the various estimates and methods involved, they also reassess the classifications of ecosystem types and the extent of the ecosystem surface area using new data and arriving at a total NPP of 60 Pg C/yr. Gross primary production is estimated to be twice net primary production, i.e., 120 Pg C/yr. This implies that about 60 Pg C/yr are returned to the atmosphere during the respiratory phase of photosynthesis. It is well known that carbon dioxide uptake by plants follows daily cycles; most plants take up CO2 during the day and emit it at night. These diurnal patterns give rise to large variations in close to the vegetation sites (Fig. 11-15). The diurnal cycles that produce local changes are superimposed on the yearly cycles that give the hemispheric
 variations seen in Fig. 11-2.
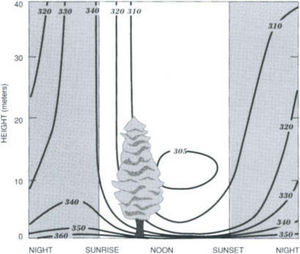
Fig. 11-15 Variation in the vertical distribution of carbon dioxide in the air around a forest with time of day. (Reprinted with permission from B. Bolin (1970). The carbon cycle. In “The Biosphere,” p. 51, W. H. Freeman, NY.)
The subsequent fate of the assimilated carbon depends on which biomass constituent the atom enters. Leaves, twigs, and the like enter litterfall, and decompose and recycle the carbon to the atmosphere within a few years, whereas carbon in stemwood has a turnover time counted in decades. In a steady-state ecosystem the net primary production is balanced by the total heterotrophic respiration plus other outputs. Non-respiratory outputs to be considered are fires and transport of organic material to the oceans. Fires mobilize about 5 Pg C/yr (Baes et al., 1976; Crutzen and Andreae, 1990), most of which is converted to CO2. Since bacterial heterotrophs are unable to oxidize elemental carbon, the production rate of pyroligneous graphite, a product of incomplete combustion (like forest fires), is an interesting quantity to assess. The inability of the biota to degrade elemental carbon puts carbon into a reservoir that is effectively isolated from the atmosphere and oceans. Seiler and Crutzen (1980) estimate the production rate of graphite to be 1 Pg C/yr. River transport of organic carbon, estimated earlier as 0.1 Pg C/yr, brings the sum of non-respiratory outputs to 7 Pg C/yr. Total respiration should therefore be around 50 Pg C/yr. This figure is in agreement with estimates of soil respiration rates determined from compilations of ecosystem types and their measured soil respiration rates (Ajtay et al., 1979).
The exchange of carbon dioxide between ocean and atmosphere has been studied extensively, since the prevailing view is that fossil fuel derived CO2 not remaining in the atmosphere has entered the oceans (Siegenthaler and Sarmiento, 1993). To appraise the ocean-atmosphere exchange we make use of the radiocarbon distribution in the oceans. All 14C is produced in the atmosphere, hence all radiocarbon in the oceans must have entered through the air-sea interface. Under a steady-state assumption the net influx of 14C must be balanced by the total decay within the oceans. Using our knowledge of the 14C distribution in the oceans (Fig. 11-10) and the radiocarbon decay constant for 14C we can calculate the flux of carbon by the following simple relations:
where Fma is the flux from the ocean mixed layer to atmosphere, Fam is the flux from atmosphere to mixed layer, k is the 14C decay rate, Ra, Rm, and R0 are the 14C ratios in atmosphere, mixed layer, and average ocean respectively, V0 is the ocean volume, and C0 an average DIC concentration of the oceans. Solving for Fam we obtain the following:
The gross flux of carbon from atmosphere to ocean is thus ca. 80 Pg C/yr. There are several complications with the above calculation. The isotopic ratios must be steady-state values, which are unavailable due to the changes resulting from atmospheric atom bomb testing. The few available pre-bomb measurements from the late 1950s (Broecker et al., 1960) together with Δ14C determinations in corals (Druffel and Linick, 1978) are invaluable tools for determining a steady state Rm value. Nevertheless, we must be aware of the great sensitivity of the flux estimate to the Rm value since Fam is dependent on the reciprocal of Ra – Rm, which is a small number. Equation (9) can be reformulated to include the variations of surface water and the variations of Δ14C in surface waters. Figure 11-16 shows latitudinal distributions of
 in the Atlantic and Pacific Oceans (Tans et al., 1990). Surface water Δ14C exhibits considerable variations with very low values in the Antarctic surface waters. This flux has also been constrained with 13C studies (Quay et al., 1992).
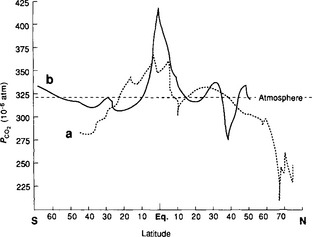
Fig. 11-16 Partial pressure of CO2 in surface ocean water along the GEOSECS tracks: (a) the Atlantic western basin data obtained between August 1972 and January 1973; (b) the central Pacific data along the 180° meridian from October 1973 to February 1974. The dashed line shows atmospheric CO2 for comparison. The equatorial areas of both oceans release CO2 to the atmosphere, whereas the northern North Atlantic is a strong sink for CO2. (Modified with permission from W. S. Broecker et al. (1979). Fate of fossil fuel carbon dioxide and the global carbon budget, Science 206, 409–418, AAAS.)
The two prime mechanisms of carbon transport within the ocean are downward biogenic detrital rain from the photic zone to the deeper oceans and advection by ocean currents of dissolved carbon species. The detrital rain creates inhomogeneities of nutrients illustrated by the characteristic alkalinity profiles (Fig. 11-9). The amount of carbon leaving the photic zone as sinking particles should not be interpreted as the net primary production of the surface oceans since most of the organic carbon is recycled within the photic zone; only about 10% settles as detritus (Bolin et al., 1979). There is considerable patchiness in the rate of oceanic primary production (Fig. 11-17) with high values in areas of intense upwelling, while areas of slow sinking motions (the subtropical gyres) show photosynthesis rates only one-tenth as large. De Vooys (1979) gives a thorough account of the many methods employed and uncertainties involved in estimating the net primary production of the aquatic environments. We adopt an estimate of total primary production of 50 Pg C/yr but note that the range of estimates is huge (15–126 PgC/yr).
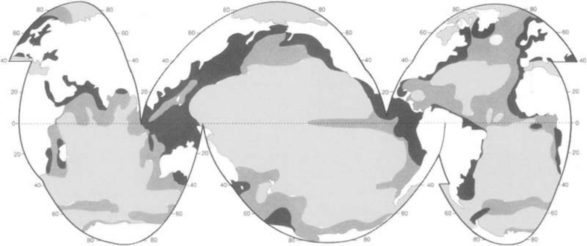
Fig. 11-17 Distribution of primary production in the world oceans (Degens and Mopper, 1976).
If 10% of the total primary production settles as detrital material, about 5 Pg C leaves the photic zone annually. The CaCO3 to organic carbon ratio in the detritus is usually taken as 1:4 (Broecker and Peng, 1982) which signifies a carbonate flux around 1 Pg C/yr. The inorganic/organic ratio can actually vary; Chen (1978) obtained ratios between 1:10 and 1:3 in a water column study. The detrital rain is balanced by a small river input of carbon and upwelling of deep water enriched in carbon from the decomposition of the detritus at depth. To balance the carbon budget of the photic zone, oceanic circulation must provide a net transport of about 5 Pg C/yr from deeper layers to the surface. Comparing Fig. 11-17 with a map of upwelling areas clearly shows that upwelling and primary production are coupled processes. We can also study Fig. 11-16 where the high values in equatorial regions are caused by the upwelling of carbon-rich and cold, deep water. This water is supersaturated with respect to atmospheric CO2 when it upwells. This state enhanced further upon warming. The North Atlantic has low
 values caused by biological depletion of carbon and cooling of waters flowing northward (i.e., the Gulf Stream). The yearly circulation of carbon through the atmosphere from equatorial upwelling regions to high latitudes is around 0.01 Pg C/yr (Bolin and Keeling, 1963).
In a steady-state ocean the sediment deposition rate of a nutrient like phosphorus ought to be balanced by riverborne influx to the oceans; 1.5–4.0 Tg P are transported to the oceans by rivers (Richey, 1983). Assuming a C/P molar ratio of 106:1 in the sedimentary organic material, the corresponding carbon flux is in the range of 0.06 to 0.16 Pg C/yr. The sedimentation rate of organic material is also estimated from the total annual sedimentation rate of 6.1 × 10¹⁵ g/yr by applying an average organic carbon content of 0.5% (Kempe, 1979b), resulting in 0.03 Pg C/yr. Kempe (1979b) estimates inorganic sedimentation at 0.09–0.22 Pg C/yr based on an oceanic calcium balance calculation and the carbonate content in dated deep-sea cores.
11.5 Models of the Carbon Cycle
The descriptive account of the carbon cycle presented above is a first-order model. A variety of numerical models have been used to study the dynamics and response of the carbon cycle to different transients. This subject is an extensive field because most scientists modeling the carbon cycle develop a model tailored for their particular problem.
Box models have a long tradition (Craig, 1957b; Revelle and Suess, 1957; Bolin and Eriksson, 1959) and still receive a lot of attention. Most work is concerned with the atmospheric CO2 increase, with the main goal of predicting global CO2 levels during the next hundred years. This is accomplished with models that reproduce carbon fluxes between the atmosphere and other reservoirs on time scales of 10–100 years, but does not include deep ocean circulation or sedimentary phenomena in detail. To study changes over thousands of years, the whole oceans, terrestrial biota, and soils must be considered. Extension to even longer time scales must deal with all geologic processes. On the other hand, many processes simulated in the fossil fuel studies can then be omitted or treated as instantaneous.
Simple three-box models with the atmosphere assumed to be one well-mixed reservoir and the oceans described by a surface layer and a deep-sea reservoir have been used extensively. Keeling (1973) has discussed this type of model in detail. The two-box ocean model is refined by including a second surface box, simulating an “outcropping” (deep-water forming) polar sea (e.g., Keeling and Bolin, 1967, 1968), and to include a better resolution of the main thermocline (e.g., Björkström, 1979). The terrestrial biota are included in a simple manner (e.g., Bolin and Eriksson, 1959) in some studies; Fig. 11-18 shows a model used by Machta (1972) where the role of biota is simulated by one reservoir connected to the atmosphere with a time lag of 20 years.
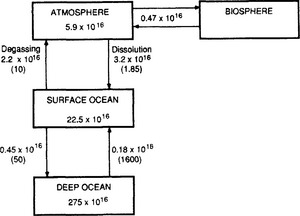
Fig. 11-18 A four-box model of the global carbon cycle. Reservoir inventories are given in moles and fluxes in mol/yr. The turnover time of CO2 in each reservoir with respect to the outgoing flux is shown in brackets. (Reprinted with permission from L. Machta, The role of the oceans and biosphere in the carbon dioxide cycle, in D. Dryssen and D. Jagner (1972). “The Changing Chemistry of the Oceans,” pp. 121–146, John Wiley.)
The inadequacy of the two-box model of the ocean led to the box-diffusion model (Oeschger et al., 1975). Instead of simulating the role of the deep sea with a well-mixed reservoir in exchange with the surface layer by first-order exchange processes, the transfer into the deep sea is maintained by vertical eddy diffusion. In its original formulation, the box-diffusion model assumed that the eddy diffusivity remained constant with depth. Siegenthaler (1983) further developed the diffusion model to include polar outcropping areas. The box-diffusion model is in widespread use: for example an ambitious attempt (Peng et al., 1983) to stimulate the changes in total carbon, 13C and 14C during the last hundred years uses a version of the Oeschger model combined with four boxes simulating the terrestrial system.
Box models and box-diffusion models have few degrees of freedom and they must describe physical, chemical, and biological processes very crudely. They are based on empirical relations rather than on first principles. Nevertheless, the simple models have been useful for obtaining some general features of the carbon cycle and retain some important roles in carbon cycle research (Craig and Holmén, 1995; Craig et al., 1997; Siegenthaler and Joos, 1992).
There has been a tremendous development of various types of prognostic models of the carbon cycle during the past decades with increased refinement of both oceanic processes (see Siegenthaler and Sarmiento, 1993; Sarmiento et al., 1992, 1998), terrestrial processes (Bonan, 1995a; Bunnell et al., 1977; Cao and Woodward, 1998; Collatz et al., 1992; Denning et al., 1996a, b; Dickinson et al., 1986; Dorman and Sellers, 1989; Foley et al., 1996; Knorr and Heimann, 1995; Law et al., 1996; Law and Simmonds, 1996; Nemry et al., 1996; Potter et al., 1993; Sellers et al., 1996a, b) and atmospheric transport calculations (Erickson et al., 1996; Fung et al., 1983; Heimann and Keeling, 1989; Heimann et al., 1989; Hunt et al., 1996; Six et al., 1996). Description of these models is beyond the scope of this volume, to describe but define the forefront of the modeling research today.
11.6 Trends in the Carbon Cycle
Throughout this chapter many of the arguments are based on an assumption of steady state. Before the agricultural and industrial revolutions, the carbon cycle presumably was in a quasi-balanced state. Natural variations still occur in this unperturbed environment; the Little Ice Age, 300–400 years ago, may have influenced the carbon cycle. The production rate of 14C varies on time scales of decades and centuries (Stuiver and Quay, 1980, 1981), implying that the pre-industrial radiocarbon distribution may not have been in steady state.
Measurements of CO2 concentrations in air bubbles trapped in glacial ice (Berner et al., 1980; Delmas et al., 1980; Jouzel et al., 1993; Raynaud et al., 1993) show that atmospheric was about 200 ppmv toward the end of the last glaciation 20000 years ago (Fig. 11-19).
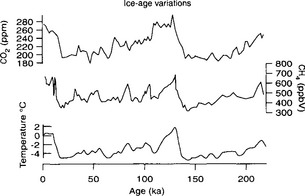
Fig. 11-19 Paleorecord of carbonaceous gases together with temperature. (After Jouzel et al., 1993.)
Today, fossil fuel combustion undoubtedly accounts for a significant portion of the anthropogenic emissions although it is rivaled by carbon mobilized by deforestation and land-use changes (Woodwell et al., 1983). The industrial revolution marked the onset of large-scale fossil fuel combustion in the early part of the 19th century. Around 1860 the emissions had reached 0.1 Pg C/yr (Fig. 11-20). The increase has been steady since that time although the rate of increase has changed during the past century. In 1860 essentially only coal was used; the use of oil began at the end of the 19th century followed by gas in the early decades of this century. Total fossil fuel emissions increased by 4% per year between 1860 and the beginning of the First World War, when fossil fuel consumption had reached 0.9 Pg C/yr (90% of which was coal). For the next 30 years (1914–1945) the yearly increase was about 1%, but after the Second World War the growth rate returned to 4%. Figure 11-21 shows the marked changes in fossil fuel use since 1973. In this period the annual rate of increase diminished to less than 2%, and striking changes in fuel mix occurred. Oil and gas use increased more rapidly than coal from the turn of the century to 1973 so that emissions from oil surpassed those from coal in the late 1960s.
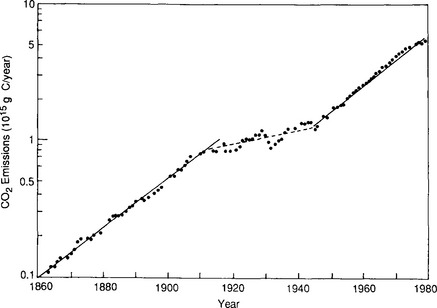
Fig. 11-20 Rate of transfer of carbon to the atmosphere due to fossil fuel combustion according to Rotty (1981).
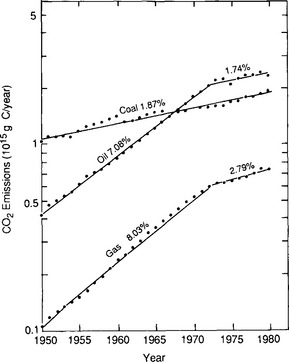
Fig. 11-21 Annual CO2 emissions from each type of fossil fuel with growth rates (Rotty, 1981).
The projection of future emissions of fossil fuel CO2 is subject to a number of uncertainties. The growth rate has already shown great variations and the reserves of fossil fuels are not accurately known. Estimates of reserves range between 5000 and 10 000 Pg C, much of which would be costly to exploit with present techniques.
The atmospheric CO2 content increased by about 1 ppmv per year during the period 1959–1978 (Bacastow and Keeling, 1981) with the South Pole increase lagging somewhat behind the Mauna Loa (19.5°N,155.6°W) data. This difference is consistent with our knowledge of interhemispheric mixing times and the fact that most fossil fuel emissions occur in the northern hemisphere (see also Conway et al., 1994a).
In Fig. 11-22 (Heimann, 1997) the variability of the carbon cycle on interannual scales is shown. These processes still remain to be elucidated in detail but regional climate variability alters regional fluxes significantly. One can easily find indications of strong El Niño events in the record. El Niño has two main influences: one on the Pacific Ocean that is capped by warm water and thus a weaker source of atmospheric CO2 from the upwelling waters, and the other being alterations of the temperature and precipitation fields in large areas. The latter proves to create a large flux of carbon to the atmosphere, mainly from drought stricken tropical regions (notably northeast Brazil). The effect on the terrestrial components typically overshadows the decreased oceanic source during El Niño events (Gaudry et al., 1987; Craig, 1998). Interannual variability in atmospheric CO2 can also be induced by trends in global climate on other time scales; there are indications of changes in temperature and growing season during the latest decades (Bacastow et al., 1985; Conway et al., 1994b; Dai and Fung, 1993; Goulden et al., 1996, Keeling et al., 1995, 1996; Kindermann et al., 1996; Myneni et al., 1998). There are obviously many exciting questions regarding this issue that remain.
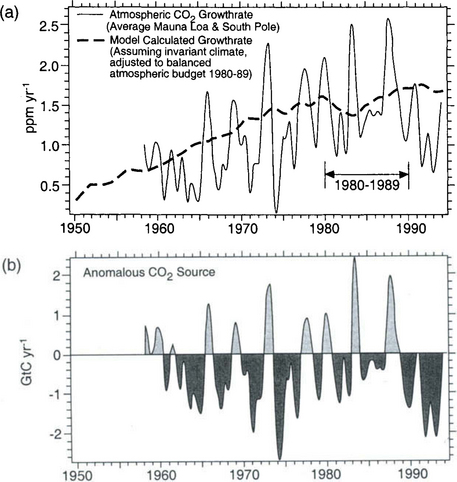
Fig. 11-22 (a) Interannual fluctuations of the growth rate of atmospheric CO2 determined from the average of the seasonally adjusted records of the Mauna Loa and South Pole stations (see Fig. 11-3). (Data from Keeling et al., 1995.) The dashed line is the growth rate that would result from an atmospheric balance which takes into account the documented CO2 inputs from fossil fuel and changes in land use together with the uptake rates computed by an ocean and a terrestrial model. (b) Anomalous, presumably climate driven CO2 source as implied by the difference between the solid and dashed line shown in part (a). (Both parts taken from Heimann (1997), with permission from the Royal Swedish Academy of Sciences.)
Fossil fuel emissions alter the isotopic composition of atmospheric carbon, since they contain no 14C and are depleted in 13C. Releasing radiocarbon-free CO2 to the atmosphere dilutes the atmospheric 14C content, yielding lower 14C/C ratios (“the Suess effect”). From 1850 to 1954 the 14C/C ratio in the atmosphere decreased by 2.0 to 2.5% (Fig. 11-23) (Suess, 1965; Stuiver and Quay, 1981). Then, this downward trend in 14C was disrupted by a series of atmospheric nuclear tests. Many large fission explosions set off by the United States with high emission of neutrons took place in 1958 in the atmosphere and the Soviet Union held extensive tests during 1960–1963. Figure 11-24 shows the atmospheric Δ14C trend during recent years. The two superpowers have ceased performing atmospheric bomb tests, which resulted in the spike-like injections of 14C in the early 1960s. The further fate of these spikes in the global biogeochemical cycle has proven to be an unintentional but valuable tool when deducing carbon fluxes between reservoirs.
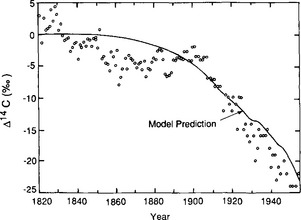
Fig. 11-23 Comparison between the Peng et al. (1983) model-derived Suess effect curve (solid line) and the observed 14C/12C trend (points) for atmospheric CO2 as reconstructed by Stuiver and Quay (1981) from measurements of tree rings. (Reproduced with permission from W. Broecker et al. (1983). A deconvolution of tree ring based δ13C record, J. Geophys. Res. 88, 3609–3620, American Geophysical Union.)
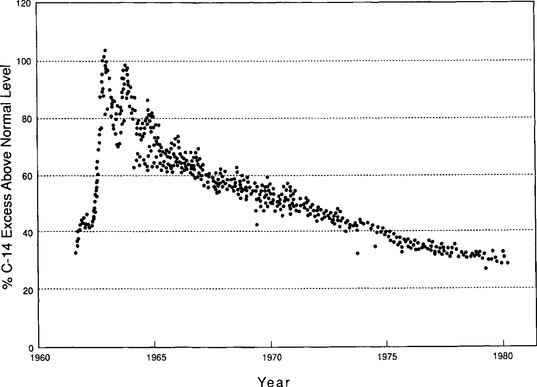
Fig. 11-24 Carbon-14 in the troposphere and the ocean surface water 1962–1981. 14C values for ocean surface water during this period range from 0–15% with no trend over time. (Modified with permission from R. Nydal and K. Lövseth (1983). Tracing bomb 14C in the atmosphere, J. Geophys. Res. 88, 3621–3642, American Geophysical Union.)
Agriculture has the explicit goal of harvesting organic matter and no accumulation of carbon in agricultural ecosystems is to be expected. It is important to recognize that an increased carbon fixation rate is not equivalent to an increased storage of carbon. Carbon accumulation in ecosystems is determined by the balance between net primary production and heterotrophic respiration, changes in both must be considered in the search for the missing carbon.
Eutrophication by the release of nitrogen and phosphorus in various forms could contribute significantly to the biotic storage of carbon. Anthropogenic releases of N and P correspond to the fixation of 9.6 and 17.6 Pg C/yr, respectively, if all N and P released was stored as trees in forests (Houghton and Woodwell, 1983). Most of the released nutrients are not available to be stored as wood, consequently the increased storage is probably much smaller than the potential value. Houghton and Woodwell (1983) conclude after considering eutrophication and other alterations of the environment that there is little evidence for an increased storage of carbon in the ecosystem of the Earth. This picture has later been modified; at least regionally there are likely increases of growth due to release of nutrients (McGuire et al., 1992, 1997; Schimel et al., 1996).
The terrestrial biota seem unable to take up much of the excess CO2. In fact, a careful assessment of the impact of deforestation and land-use changes indicate that the terrestrial biota has been a considerable source of CO2 during the past century (Bolin, 1977; Woodwell et al., 1983). A complex effort to deduce mankind’s impact on terrestrial biota using a bookkeeping model based on historical records on land use in all parts of the world (Moore et al., 1981; Houghton et al., 1983; Woodwell et al., 1983) gives the curves in Fig. 11-25. Woodwell et al. (1983) arrive at a carbon release in 1980 of 1.8 to 4.7 Pg C/yr from deforestation, which is comparable to the 5 Pg released from fossil fuels. Freyer and Belacy (1983) constructed a 13C/12C record from tree-ring studies (Fig. 11-26). Using a global carbon cycle model with box-diffusion model for the oceans and a simple four-box model for soil and land-biota, Peng et al. (1983) make use of this record of δ13C changes in the atmosphere to deduce the CO2 contribution from forest and soils. The CO2 emissions arrived at for 1980 are about 1.5 Pg C/yr, similar to the minimum values of Woodwell et al. (1983), but the trends during the past century differ significantly (Fig. 11-27). There are numerous indications that the terrestrial biosphere has significant interannual variability that creates variability in the atmospheric CO2 concentration.
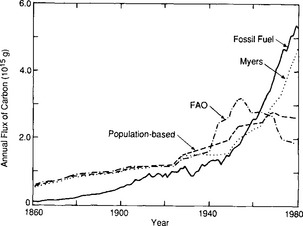
Fig. 11-25 Release of carbon from the biota and soils globally according to various estimates. The fossil fuel flux is from data of Rotty. (Modified with permission from G. M. Woodwell et al. (1983). Global deforestation: Contribution to atmospheric carbon dioxide, Science 222, 1081–1086, AAAS.)
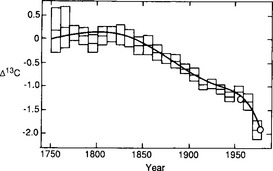
Fig. 11-26 Decade-averaged Δ13C data of Northern hemisphere tree ring records from 1750–1979 and 7th-degree polynomial fit of the data. The vertical extension of blocks represents 95% confidence limits of the mean. The open circles give the 13C change of –0.65% in atmospheric CO2 observed from 1956 to 1978 by Keeling et al. (1979). (Adapted from Peng et al., 1983.)
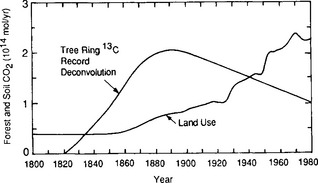
Fig. 11-27 Contrast between the 13C/12C derived forest-soil CO2 scenario obtained from Peng et al. (1983) with that based on land use and stored carbon response functions obtained by Houghton et al. (1983). (Reproduced with permission from W. Broecker et al. (1983). A deconvolution of tree ring based δ13C record, J. Geophys. Res. 88, 3609–3620, American Geophysical Union.)
The role of carbon dioxide in the Earth’s radiation budget merits this interest in atmospheric CO2. There are, however, other changes of importance. The atmospheric methane concentration is increasing, probably as a result of increasing cattle populations, rice production, and biomass burning (Crutzen, 1983). Increasing methane concentrations are important because of the role it plays in stratospheric and tropospheric and because it is important to the radiation budget of the world.
As we have seen, civilization is altering the global carbon cycle in several ways. Even though our knowledge of the most relevant processes in the carbon cycle has increased considerably, it remains limited. Figure 11-1 summarizes the carbon cycle as described in this chapter. There are a number of central observations to point out regarding this figure. The amount of fossil fuel still remaining is sufficient to increase the atmospheric CO2 content many-fold. The amount of carbon stored in soils and standing biomass is small compared to the fossil fuel reserves; it is sometimes argued that the planting of trees could decrease the impact of our fossil fuel releases. Even if we double the standing biomass (an unrealistic vision since most land is needed for food production) the amount of carbon stored will be small compared to the total amount of fossil fuel available. Most of the terrestrial biosphere and soil carbon reservoirs are easily changed on short time scales; even if there can be net storage during a decade (what seems to be the case during the 1990s) this carbon can very rapidly return to the atmosphere. Because the transport of carbon into the deep oceans is a slow process, release of CO2 to the atmosphere will perturb the atmospheric concentration for several centuries even if emissions cease. We must also note that the airborne fraction observed during the past decades might very well change as a response to climatic change; for example if the ocean surface becomes warmer there will be an increased stability of the water column yielding a slower transport of water the abyss as well as a decreased solubility of carbon dioxide in the water. Both these effects thus make the oceans less prone to taking up the excess CO2. Revisiting Fig. 11-19 we can also note that the observed perturbations during the past 200 years are extreme compared to the observed variations that have occurred during the past 200000 years; CO2 has increased from a pre-industrial global-mean value of about 280 ppmv to today’s (December 1998) value of 366 ppmv. The climate system will undoubtedly respond to these dramatic changes in radiative forcing although the details of the response remain uncertain. The use of fossil fuels thus passes a potential climate change problem onwards to coming generations; if the climatic impacts of the enhanced greenhouse effect prove to create severe difficulties for mankind or nature centuries will be required to repair the atmosphere. Despite the uncertainties regarding the climatic impacts (IPCC, 1990, 1992; Kattenberg et al., 1996) of the enhanced greenhouse effect this feature of the carbon cycle remains as a fundamental argument to avoid using fossil fuels whenever possible and actively seeking alternatives for the future.
Aber, J. D., Driscoll, C. T. Effects of land use, climate variation, and N deposition on N cycling and C storage in northern hardwood forests. Global Biogeochem. Cycles. 1997; 11:639–648.
Ajtay, G. L., Ketner, P., Duvigneaud, P. Terrestrial primary production and phytomass. In: Bolin B., Degens E. T., Kempe S., Ketner P., eds. The Global Carbon Cycle. Cambridge, MA: Wiley; 1979:129–181.
Anklin, M., Barnola, J. M., Schwander, J., Stauffer, B., Raynaud, D. Processes affecting the CO2 concentrations measured in Greenland ice. Tellus. 1995; 47B:461–470.
Arrhenius, S. On the influence of the carbonic acid in the air upon the temperature of the ground. Philos. Mag. 1896; 41:237–276.
Bacastow, R. B. Modulation of atmospheric carbon dioxide by the Southern Oscillation. Nature. 1976; 261:116–118.
Bacastow, R. B. Dip in the atmospheric CO2 level during the mid-1960s. J. Geophys. Res. 1979; 84:3108–3114.
Bacastow, R. B., Björkström, A. Comparison of ocean models for the carbon cycle. In: Bolin B., ed. Carbon Cycle Modeling. New York: Wiley; 1981:29–79.
Bacastow, R. B., Keeling, C. D. Atmospheric carbon dioxide concentration and the observed airborne fraction. In: Bolin B., ed. Carbon Cycle Modeling. New York: Wiley; 1981:103–112.
Bacastow, R. B., Adams, J. A., Keeling, C. D., Moss, D. J., Whorf, T. P., Wong, C. S. Atmospheric carbon dioxide, the Southern Oscillation, and the weak 1975 El Niño. Science. 1980; 210:66–68.
Bacastow, R. B., Keeling, C. D., Whorf, T. P. Seasonal amplitude increase in atmospheric CO2 concentration at Mauna Loa, Hawaii, 1959–1982. J. Geophys. Res. 1985; 90:10529–10540.
ORNL-5194 Baes, C. F., Goeller, H. E., Olson, J. S., Rothy, R. M., The Global Carbon Dioxide Problem. Oak Ridge National Laboratory, New York, 1976. 1–72.
Bakwin, P. S., Tans, P. P., Zhao, C., Ussler, W., III., Quesnell, E. Measurements of carbon dioxide on a very tall tower. Tellus, Ser. B. 1995; 47:535–549.
Barnola, J. M., Raynaud, D., Neftel, A., Oeschger, H. Comparison of CO2 measurements by two laboratories on air from bubbles in polar ice. Nature. 1983; 303:410–413.
Barnola, J. M., Anklin, M., Porcheron, J., Raynaud, D., Schwander, J., Stauffer, B. CO2 evolution during the last millennium as recorded by Antarctic and Greenland ice. Tellus. 1995; 47B:264–272.
Barrie, L. A. Arctic air pollution: an overview of current knowledge. Atmos. Environ. 1986; 20:643–663.
Bazilevich, N. I., Rodin, L., Ye, L., Roznov, N. N. Geographical Aspects of Biological Productivity. In: Pap. V Congr. USSR Geogr. Soc. Oak Ridge, TN: USSR; 1970.
Berger, A. Milankovitch theory and climate. Reviews of Geophysics. 1988; 26(4):624–657.
Berner, W., Oeschger, H., Stauffer, B. Information on the CO2 cycle from ice core studies. Radiocarbon. 1980; 22:227–235.
Bischof, W. The CO2 content of the upper polar troposphere between 1963–1979. In: Bolin B., ed. Carbon Cycle Modeling. Leningrad: Wiley; 1981:113–116.
Björkström, A. A model of CO2 interaction between atmosphere, oceans, and land biota. In: Bolin B., Degens E. T., Kempe S., Ketner P., eds. The Global Carbon Cycle. New York: Wiley; 1979:403–457.
Blake, D. R., Rowland, F. S. Continuing worldwide increase in tropospheric methane 1978 to 1987. Science. 1988; 239:1129–1131.
Bolin, B. Changes of land biota and their importance for the carbon cycle. Science. 1970; 196:613–615.
Bolin, B. The carbon cycle. Scient. Am. 1970; 223(3):124–132.
Bolin B., ed. Carbon Cycle Modeling. New York: Wiley, 1981.
Bolin, B., Bischof, W. Variations of the carbon dioxide content of the atmosphere in the northern hemisphere. Tellus. 1970; 22:431–442.
Bolin B., Cook R., eds. The Major Biogeochemical Cycles and Their Interactions. SCOPE 21. Wiley, New York, 1983.
Bolin, B., Eriksson, E. Changes of the carbon dioxide content of the atmosphere and sea due to fossil fuel combustion. In: Bolin B., ed. Atmosphere and Sea in Motion. New York: The Rockefeller Institute Press; 1959:130–142.
Bolin, B., Keeling, C. D. Large-scale atmospheric mixing as deduced from the seasonal and meridional variations of carbon dioxide. J. Geophys. Res. 1963; 68:3899–3920.
Bolin B., Degens E. T., Kempe S., Ketner P., eds. The Global Carbon Cycle. SCOPE; 13. Wiley, 1979.
Bolin, B., Björkström, A., Keeling, C. D., Bacastow, R., Siegenthaler, U. Carbon cycle modeling. In: Bolin B., ed. Carbon Cycle Modeling. New York: Wiley; 1981:1–28.
Bonan, G. B. Atmosphere-biosphere exchange of carbon dioxide in boreal forests. J. Geophys. Res. 1991; 96:7301–7312.
Bonan, G. B. Land-atmosphere CO2 exchange simulated by a land surface process model coupled to an atmospheric general circulation model. J. Geophys. Res. 1995; 100:2817–2831.
Bonan, G. B. Sensitivity of a GCM simulation to inclusion of inland water surfaces. J. Clim. 1995; 8:2691–2704.
Bonan, G. B. A land surface model (LSM version 1. 0) for ecological, hydrological, and atmospheric studies: Technical description and user’s guide. In: NCAR Tech. Note NCAR/TN-417+STR. New York: Natl. Cent. for Atmos. Res. ; 1996.
Bonan, G. B. The NCAR land surface model (LSM version 1. 0) coupled to the NCAR community climate model. In: NCAR Tech. Note NCAR/TN-429+STR. Boulder, CO: NCAR; 1996.
Bonan, G. B. Sensitivity of a GCM simulation to subgrid infiltration and surface runoff. Clim. Dyn. 1996; 12:279–285.
Bonan, G. B. Effects of land use on the climate of the United States. Clim. Change. 1997; 37:449–486.
in press Bonan, G. B. The land surface climatology of the NCAR Land Surface Model (LSM 1. 0) coupled to the NCAR Community Climate Model (CCM3). J. Clim. 1998.
Box, E. O. Estimating the seasonal carbon source-sink geography of a natural, steady-state terrestrial biosphere. J. Appl. Meteorol. 1988; 27:1109–1124.
Box, E. O., Meentemeyer, V. Geographic modeling and modern ecology. In: Esser G., Overdieck D., eds. Modern Ecology. Boulder, CO: Elsevier; 1991:773–804.
Braswell, B. H., Schimel, D. S., Linder, E., Moore, B., III. The response of global terrestrial ecosystems to interannual temperature variability. Science. 1997; 278:870–872.
Brewer, P. G. Direct observation of the oceanic CO2 increase. Geophys. Res. Lett. 1978; 5(12):997–1000.
Broecker, W. S. Factors controlling CO2 content in the oceans and atmosphere. In: Woodwell G. M., Pecan E. V., eds. Carbon and the Biosphere. Amsterdam: United States Atomic Energy Commission; 1973:32–50.
Broecker, W. S. A revised estimate for the radiocarbon age of North Atlantic Deep Water. J. Geophys. Res. 1979; 84:C6. Broecker, W. S., A revised estimate for the radiocarbon age of North Atlantic Deep Water. J. Geophys. Res. 1979; 84:3218–3226.
Radiocarbon Suppl. 1 Broecker, W. S., Olson, E. A. Lamont radiocarbon measurements VI. Am. J. Sci. 1959; * 111–132.
Broecker, W. S., Peng, T. -H. Tracers in the Sea. Eldigio Press; 1982.
Broecker, W. S., Gerard, R., Ewing, M., Heezen, B. C. Natural radiocarbon in the Atlantic Ocean. J. Geophys. Res. 1960; 65:9. Broecker, W. S., Gerard, R., Ewing, M., Heezen, B. C., Natural radiocarbon in the Atlantic Ocean. J. Geophys. Res. 1960; 65:2903–2931.
Broecker, W. S., Takahashi, T., Simpson, H. J., Peng, T. -H. Fate of fossil fuel carbon dioxide and the global carbon budget. Science. 1979; 206:409–418.
Bunnell, F. L., Tait, D. E. N., Flanagan, P. W., Van Cleve, K. Microbial respiration and substrate weight loss, I. A general model of the influences of abiotic variables. Soil Biol. Biochem. 1977; 9:33–40.
Cao, M., Woodward, F. I. Dynamic responses of terrestrial ecosystem carbon cycling to global climate change. Nature. 1998; 393:249–252.
Spring, 1990 CDIAC. Carbon Dioxide Information Analysis Center Communications. Palisades, New York: Oak Ridge National Laboratory; 1990.
Charlson, R. J., Rodhe, H. Factors controlling the acidity of natural rainwater. Nature. 1982; 295:683–685.
Chen, C. -T., Millero, F. J. Gradual increase of oceanic CO2. Nature. 1979; 277:205–206.
Chen, C. -T. A. Decomposition of calcium carbonate and organic carbon in the deep oceans. Science. 1978; 201:735–736.
Ciais, P., Tans, P. P., Trolier, M., White, J. W. C., Francey, R. J. A large northern hemisphere terrestrial CO2 sink indicated by the 13C/12C ratio of atmospheric CO2. Science. 1995; 269:1098–1102.
Coe, M. T., Bonan, G. B. Feedbacks between climate and surface water in northern Africa during the middle Holocene. J. Geophys. Res. 1997; 102:11087–11101.
Collatz, G. J., Ball, J. T., Grivet, C., Berry, J. A. Physiological and environmental regulation of stomatal conductance, photosynthesis, and transpiration: a model that includes a laminar boundary layer. Agric. For. Meteorol. 1991; 54:107–136.
Collatz, G. J., Ribas-Carbo, M., Berry, J. A. Coupled photosynthesis-stomatal conductance model for leaves of C4 plants. Aust. J. Plant Physiol. 1992; 19:519–538.
Conway, T. J., Tans, P., Waterman, L. S., Thoning, K. W., Masarie, K. A., Gammon, R. H. Atmospheric carbon dioxide measurements in the remote global troposphere, 1981–1984. Tellus. 1988; 40B:81–115.
Conway, T. J., Tans, P. P., Waterman, L. S., Atmospheric CO2 records from sites in the NOAA/CMDL air sampling networkBoden T. A., et al, eds. Trends ’93: A Compendium of Data on Global Change. Rep. ORNL/CDIAC-65. Oak Ridge Natl. Lab., Oak Ridge, TN, 1994. 41–119.
Conway, T. J., Tans, P. P., Waterman, L. S., Thoning, K. W., Kitzis, D. R., Masarie, K. A., Zhang, N. Evidence for internanual variability of the carbon cycle from the National Oceanic and Atmospheric Administration/Climate Monitoring and Diagnostics Laboratory Global Air Sampling Network. J. Geophys. Res. 1994; 99:22831–22855.
Craig, H. Isotopic standards for carbon and correction factors for mass-spectrometric analysis of carbon dioxide. Geochim. Cosmochim. Acta. 1957; 12:133–149.
Craig, H. The natural distribution of radiocarbon and the exchange time of carbon dioxide between atmosphere and sea. Tellus. 1957; 9:1–17.
Craig, H., Horibe, Y., Sowers, T. Gravitational separation of gases and isotopes in polar ice caps. Science. 1988; 242:1675–1678.
Craig, S. G. The response of terrestrial carbon exchange and atmospheric CO2 concentrations to El Niño SST forcing. In: Report CM-94, Int. Meteorol. Inst. in Stockholm, Dept. of Meteorol. Oak Ridge, Tenn: Stockholm Univ. ; 1998.
Craig, S. G., Holmén, K. J. Uncertainties in future CO2 projections. Global Biogeochem. Cycles. 1995; 9:139–152.
submitted, 1998 Craig, S. G., Holmén, K. J. Atmospheric CO2 simulated by the National Center for Atmospheric Research Community Climate Model. 2. Interannual variability. J. Geophys. Res. 1998.
Craig, S., Holmén, K., Björkström, A. Net terrestrial carbon exchange from mass balance calculations: an uncertainty estimate. Tellus, Ser. B. 1997; 49:136–148.
Craig, S. G., Holmén, K. J., Bonan, G. B, Rasch, P. J. Atmospheric CO2 simulated by the National Center for Atmospheric Research Community Climate Model. 1. Mean fields and seasonal cycles. J. Geophys. Res. 1998; * 13213–13235.
Crutzen, P. J. Atmospheric interactions-homogeneous gas reactions of C, N, and S containing compounds. In: Bolin B., ed. The Major Biogeochemical Cycles and Their Interactions. Wiley; 1983:67–112.
Crutzen, P. J. Methane’s sinks and sources. Nature. 1991; 350:380–381.
Crutzen, P. J., Andreae, M. O. Biomass burning in the Tropics: impact on atmospheric chemistry and biogeochemical cycles. Science. 1990; 250:1669–1678.
Crutzen, P. J., Zimmerman, P. H. The changing photochemistry of the troposphere. Tellus. 1991; 43:135–151.
Chapter 4 Culkin, F. The major constituents of sea water. In: Riley J. P., Skirrow G., eds. Chemical Oceanography. New York: Academic Press; 1965:121–161.
Dai, A., Fung, I. Y. Can climate variability contribute to the “missing” CO2 sink? Global Biogeochem. Cycles. 1993; 7:599–609.
De Vooys, C. G. N. Primary production in aquatic environments. In: Bolin B., Degens E. T., Kempe S., Ketner P., eds. The Global Carbon Cycle. London: Wiley; 1979:259–292.
Degens, E. T., Mopper, K. Factors controlling the distribution and early diagenesis of organic material in marine sediments. In: Riley J. P., ed. Chemical Oceanography. New York: Academic Press; 1976:59–113.
(Part C) Degens, E. T., Kempe, S., Spitzy, A. Carbon dioxide: a biogeochemical portrait. In: Hutzinger O., ed. The Handbook of Environmental Chemistry. New York: Springer-Verlag, 1984.
Delmas, R. J. A natural artefact in Greenland ice-core CO2 measurements. Tellus. 1993; 45B:391–396.
Delmas, R. J., Ascencio, J. -M., Legrand, M. Polar ice evidence that atmospheric CO2 20 000 yr BP was 50% of present. Nature. 1980; 284:155–157.
Denning, A. S., Collatz, G. J., Zhang, C., Randall, D. A., Berry, J. A., Sellers, P. J., Colello, G. D., Dazlich, D. A. Simulations of terrestrial carbon metabolism and atmospheric CO2 in a general circulation model. Part 1: Surface carbon fluxes. Tellus, Ser. B. 1996; 48:521–542.
Denning, A. S., Randall, D. A., Collatz, G. J., Sellers, P. J. Simulations of terrestrial carbon metabolism and atmospheric CO2 in a general circulation model. Part 2: Simulated CO2 concentrations. Tellus, Ser. B. 1996; 48:543–567.
Denning, A. S., Investigations of the transport, sources, and sinks of atmospheric CO2 using a general circulation model. Atmos. Sci. Pap. ; 564. Colo. State Univ., New York, 1995.
Denning, A. S., Fung, I. Y., Randall, D. A. Latitudinal gradient of atmospheric CO2 due to seasonal exchange with land biota. Nature. 1995; 376:240–243.
Dickinson, R. E., Henderson-Sellers, A., Kennedy, P. J., Wilson, M. F. Biosphere-Atmosphere Transfer Scheme (BATS) for the NCAR Community Climate Model. In: NCAR Tech. Note TN-275+STR. Fort Collins: Nat. Cent. for Atmos. Res. ; 1986.
Dorman, J. L., Sellers, P. J. A global climatology of albedo, roughness length and stomatal resistance for atmospheric general circulation models as represented by the simple biosphere model (SiB). J. Appl. Meteorol. 1989; 28:833–855.
Dörr, H., Münnich, K. O. Annual variation in soil respiration in selected areas of the temperate zone. Tellus, Ser. B. 1987; 39:114–121.
Dougherty, R. L., Bradford, J. A., Coyne, P. I., Sims, P. L. Applying an empirical model of stomatal conductance to three C-4 grasses. Agric. For. Meteorol. 1994; 67:269–290.
Druffel, E. M., Linick, T. W. Radiocarbon in annual coral rings of Florida. Geophys. Res. Lett. 1978; 5:913–916.
Dyrssen, D., Sillén, L. G. Alkalinity and total carbonate in sea water. A plea for P-T-independent data. Tellus. 1967; 19(1):113–120.
Edmond, J. M. High precision determination of titration alkalinity and total carbon dioxide concentration of sea water by potentiometric titration. Deep-Sea Res. 1970; 17:737–750.
Ehhalt, D. H. The atmospheric cycle of methane. Tellus. 1974; 26:58–70.
Enting, I. G. A lattice statistics model for the age distribution of air bubbles in polar ice. Nature. 1985; 315:654–655.
Enting, I. G. The incompatibility of ice-core CO2 data with reconstructions of biotic CO2 sources, II. The influence of CO2-fertilised growth. Tellus. 1992; 44B:23–32.
Enting, I. G., Wigley, T. M. L., Heimann, M., Future emissions and concentration of carbon dioxide: Key ocean/atmosphere/land analyses. Tech. Pap. 31, Div. of Atmos. Res., Comm. Sci. and Ind. Res. Org. Melbourne, Victoria, Australia. 1994.
Enting, I. G., Trudinger, C. M., Francey, R. J. A synthesis inversion of the concentration and d13C of atmospheric CO2. Tellus, Ser. B. 1995; 47:35–52.
Enting, I. G., Trudinger, C. M., Francey, R. J. and Granek, H. Synthesis inversion of atmospheric CO2 using the GISS tracer transport model, Tech. Pap. 29, Div. of Atmos. Res., Comm. Sci. and Ind. Res. Org. Melbourne, Victoria, Australia
Erickson, D. J., Rasch, P. J., Tans, P. P., Friedlingstein, P., Ciais, P., Maier-Reimer, E., Six, K., Fischer, C. A., Walters, S. The seasonal cycle of atmospheric CO2: A study based on the NCAR Community Climate Model (CCM2). J. Geophys. Res. 1996; 101:15079–15097.
Etheridge, D. M., Steele, L. P., Langenfelds, R. L., Francey, R. J. Natural and anthropogenic changes in atmospheric CO2 over the last 1000 years from air in Antarctic ice and firn. J. Geophys. Res. 1996; 101:4115–4128.
Fan, S., Gloor, M., Mahlman, J., Pacala, S., Sarmiento, J., Takahashi, T., Tans, P. A large terrestrial carbon sink in North America implied by atmospheric and oceanic carbon dioxide data and models. Science. 1998; 282:442–446.
Farquhar, G. D., Sharkey, T. D. Stomatal conductance and photosynthesis. Ann. Rev. Plant Physiol. 1982; 33:317–345.
Farquhar, G. D., von Caemmerer, S., Berry, J. A. A biochemical model of photosynthetic CO2 assimilation in leaves of C3 species. Planta. 1980; 149:78–90.
Feely, R. A., Gammon, R. H., Taft, B. A., Pullen, P. E., Waterman, L. S., Conway, T. J., Gendron, J. F., Wisegarver, D. P. Distribution of chemical tracers in the eastern equatorial Pacific during and after the 1982–1983 El Niño/Southern Oscillation event. J. Geophys. Res. 1987; 92:6545–6558.
Feux, A. N., Baker, D. R. Stable carbon isotopes in selected granitic, mafic, and ultramafic igneous rocks. Geochim. Cosmochim. Acta. 1973; 37:2509–2521.
Field, C. B., Randerson, J. T., Malmström, C. M. Ecosystem net primary production: Combining ecology and remote sensing. Remote Sens. Environ. 1995; 51:74–88.
Flowers, E. C., McCormick, R. A., Kurfis, K. R. Atmospheric turbidity over the United States, 1961–1966. J. Appl. Meteorol. 1969; 8:955–962.
Foley, J. A., Prentice, I. C., Ramankutty, N., Levis, S., Pollard, D., Sitch, S., Haxeltine, A. An integrated biosphere model of land surface processes, terrestrial carbon balance, and vegetation dynamics. Global Biogeochem. Cycles. 1996; 10:603–628.
Francey, R. J., Tans, P. P., Allison, C. E., Enting, I. G., White, J. W. C., Trolier, M. Changes in oceanic and terrestrial carbon uptake since 1982. Nature. 1995; 373:326–330.
Freyer, H. -D. Atmospheric cycles of trace gases containing carbon. In: Bolin B., Degens E. T., Kempe S., Ketner P., eds. The Global Carbon Cycle. Boulder, CO: Wiley; 1979:101–128.
Freyer, H. D., Belacy, N. 13C/12C records in Northern Hemispheric trees during the past 500 years — anthropogenic impact and climatic superpositions. J. Geophys. Res. 1983; 88:6844–6852.
Friedli, H., Lötscher, H., Oeschger, H., Siegenthaler, U., Stauffer, B. Ice core record of the 13C/12C ratio of atmospheric CO2 in the past two centuries. Nature. 1986; 324:237–238.
Friedlingstein, P., Fung, I., Holland, E., John, J., Brasseur, G., Erickson, D. and Schimel, D. On the contribution of CO2 fertilization to the missing biospheric sink. Global Biogeochem. Cycles9, 541–556.
Fung, I. Y. Analysis of the seaonal and geographical patterns of atmospheric CO2 distributions with a three-dimensional tracer model. In: Trabalka J. R., Reichle D. E., eds. The Changing Carbon Cycle: A Global Analysis. New York: Springer-Verlag; 1986:459–473.
Fung, I. Y., Prentice, K. C., Matthews, E., Lerner, J., Russell, G. Three-dimensional tracer model study of atmospheric CO2: Response to seasonal exchanges with the terrestrial biosphere. J. Geophys. Res. 1983; 88:1281–1294.
Fung, I. Y., Tucker, C. J., Prentice, K. C. Application of Advanced Very High Resolution Radiometer vegetation index to study atmospherebiophere exchange of CO2. J. Geophys. Res. 1987; 92:2999–3015.
Garrels, R. M., Mackenzie, F. T. Evolution of Sedimentary Rocks. New York: Norton; 1971.
Garrels, R. M., Mackenzie, F. T., Hunt, C. Chemical Cycles and the Global Environment. New York: W. Kaufmann; 1973.
Gaudry, A., Monfray, P., Polian, G., Lambert, G. The 1982–1983 El Niño: a 6 billion ton CO2 release. Tellus. 1987; 39B:209–213.
Gillette, D. A., Box, E. O. Modeling seasonal changes of atmospheric carbon dioxide and carbon 13. J. Geophys. Res. 1986; 91:5287–5304.
Goudriaan, J., Ajtay, G. L. The possible effects of increased CO2 on photosynthesis. In: Bolin B., Degens E. T., Kempe S., Ketner P., eds. The Global Carbon Cycle. Los Altos, California: Wiley; 1979:237–249.
Goulden, M. L., Munger, J. W., Fan, S. -M., Daube, B. C., Wofsy, S. C. Exchange of carbon dioxide by a deciduous forest: Response to interannual climate variability. Science. 1996; 271:1576–1578.
Grace, J., Lloyd, J., McIntyre, J., Miranda, A. C., Meir, P., Miranda, H. S., Nobre, C., Moncrieff, J., Massheder, J., Malhi, Y., Wright, I., Gash, J. Carbon dioxide uptake by an undisturbed tropical rain forest in southwest Amazonia, 1992 to 1993. Science. 1995; 270:778–780.
Haas-Laursen, D. E., Hartley, D. E., Conway, T. J. Consistent sampling methods for comparing models to CO2 flask data. J. Geophys. Res. 1997; 102:19059–19071.
Hack, J. J. Parameterization of moist convection in the National Center for Atmospheric Research community climate model (CCM2). J. Geophys. Res. 1994; 99:5551–5568.
Hack, J. J., Boville, B. A., Briegleb, B. P., Kiehl, J. T., Rasch, P. J., Williamson, D. L. Description of the NCAR Community Climate Model (CCM2). In: NCAR Tech. Note NCAR/TN-382+STR. New York: Nat. Cent. for Atmos. Res. ; 1993.
Hack, J. J., Boville, B. A., Kiehl, J. T., Rasch, P. J., Williamson, D. L. Climate statistics from the National Center for Atmospheric Research community climate model (CCM2). J. Geophys. Res. 1994; 99:20785–20813.
Hansen, J., Ruedy, R., Sato, M., Reynolds, R. Global surface air temperature in 1995: Return to pre-Pinatubo level. Geophys. Res. Lett. 1996; 23:1665–1668.
Hansson, I. A new set of acidity constants for carbonic acid and boric acid in sea water. Deep-Sea Research. 1973; 20:461–478.
Hao, W., Ward, D. E., Olbu, G., Baker, S. P. Emissions of CO2, CO and hydrocarbons from fires in diverse African savanna ecosystems. J. Geophys. Res. 1996; 101:23577–23584.
Heimann, M. A review of the Contemporary Global Carbon Cycle and as Seen a Century Ago by Arrhenius and Högbom. Ambio. 1997; 26:17–24.
Heimann, M., Keeling, C. D., A three-dimensional model of atmospheric CO2 transport based on observed winds: 2. Model description and simulated tracer experimentsPeterson D. H., ed. Aspects of Climate Variability in the Pacific and Western Americas. Geophys. Monogr. Ser.; vol. 5. AGU, Boulder, CO, 1989. 237–275.
Heimann, M., Keeling, C. D., Tucker, C. J., A three-dimensional model of atmospheric CO2 transport based on observed winds: 3. Seasonal cycle and synoptic time scale variationsPeterson D. H., ed. Aspects of Climate Variability in the Pacific and Western Americas. Geophys. Monogr. Ser.; vol. 55. AGU, Washington, DC, 1989. 277–303.
Holland, H. D. The Chemistry of the Atmosphere and Oceans. Washington, DC: Wiley-Interscience; 1978.
Holtslag, A. A. M., Boville, B. A. Local versus nonlocal boundary-layer diffusion in a global climate model. J. Clim. 1993; 6:1825–1842.
Houghton, R. A., Emissions of carbon from land-use change. paper presented at the 1993 Global Change Institute on the Carbon Cycle, Off. Interdisciplinary Earth Stud. Univ. Corp. Atmos. Res. Snowmass, Colorado, July 18–30. 1993.
Houghton, R. A., Woodwell, G. M. Effect of increased C, N, P, and S on the global storage of C. In: Bolin B., Cook R. B., eds. The Major Biogeochemical Cycles and Their Interactions. New York: Wiley; 1983:327–343.
Houghton, R. A., Woodwell, G. M. Global climatic change. Scient. Am. 1989; 260:36–47.
Houghton, R. A., Hobbie, J. E., Melillo, J. M., Moore, B., Peterson, B. J., Shaver, G. R., Woodwell, G. M. Changes in the carbon content of terrestrial biota and soils between 1860 and 1980: a net release of CO2 to the atmosphere. Ecol. Monogr. 1983; 53:235–262.
Hunt, E. R., Jr., Piper, S. C., Nemani, R., Keeling, C. D., Otto, R. D., Running, S. W. Global net carbon exchange and intra-annual atmospheric CO2 concentrations predicted by an ecosystem process model and three-dimensional atmospheric transport model. Global Biogeochem. Cycles. 1996; 10:431–456.
Hunt, J. M. Distribution of carbon in crust of Earth. Bull. Am. Assoc. Pet. Geol. 1972; 56:2273–2277.
IPCC. Climate change. In: Houghton J. T., Jenkins G. J., Ephraums J. J., eds. The IPCC Scientific Assessment. New York: Cambridge University Press, 1990.
IPCC. Climate change. In: Houghton J. T., Callander B. A., Varney S. K., eds. The Supplementary Report to The IPCC Scientific Assessment. Cambridge: Cambridge University Press, 1992.
IPCC. Climate change 1994. In: Houghton J. T., Meira Filho L. G., Bruce J., Lee Hoesung, Callander B. A., Haites E., Harris N., Maskell K., eds. Radiative Forcing of Climate Change and An Evaluation of the IPCC IS92 Emission Scenarios. Cambridge: Cambridge University Press, 1995.
Jansen, E., Deglaciation, impact on ocean circulation. Encyclopedia of Earth System Science; Vol. 2. Academic Press, Cambridge, 1992.
Jones, P. D. The influence of ENSO on global temperatures. Clim. Monitor. 1988; 17:80–89.
Jones, P. D. Hemispheric surface air temperature variations: a reanalysis and an update to 1993. J. Climate. 1994; 7:1794–1802.
Jones, P. D., Wigley, T. M. L., Wright, P. B. Global temperature variations between 1861 and 1984. Nature. 1986; 322:430–434.
Jones, P. D., Raper, S. C. B., Bradley, R. S., Diaz, H. F., Kelly, P. M., Wigley, T. M. L. Northern Hemisphere surface air temperature variations: 1851–1984. J. Clim. Appl. Meteor. 1986; 25:161–179.
Jones, P. D., Raper, S. C. B., Wigley, T. M. L. Southern Hemisphere surface air temperature variations: 1851–1984. J. Clim. Appl. Meteor. 1986; 25:1213–1230.
Jouzel, J., Barkov, N. I., Barnola, J. M., Bender, M., Chappelaz, J., Genthon, C., Korlyakov, V. M., Lipenkov, V., Lorius, C., Petit, J. R., Raynaud, D., Raisbeck, G., Ritz, C., Sowers, T., Steivenard, M., Yiou, F., Yiou, P. Extending the Vostok ice-core record of palaeoclimate to the penultimate glacial period. Nature. 1993; 364:407–412.
Kattenberg, A., Giorgi, F., Grassl, H., Meehl, G. A., Mitchell, J. F. B., Stouffer, R. J., Tokioka, T., Weaver, A. J., Wigley, T. M. L. Climate models-projections of future climate. In: Houghton J. T., et al, eds. Climate Change 1995: The Science of Climate Change. Cambridge University Press; 1996:285–357.
Keeling, C. D. The carbon dioxide cycle. Reservoir models to depict the exchange of atmospheric carbon dioxide with the oceans and land plants. In: Rasool S., ed. Chemistry of the Lower Atmosphere. Cambridge, U. K. : Plenum Press; 1973:251–329.
Keeling, C. D. Industrial production of carbon dioxide from fossil fuels and limestone. Tellus. 1973; 25:174–198.
Keeling, C. D. Standardization of notations and procedures. In: Bolin B., ed. Carbon Cycle Modeling. New York: Wiley; 1981:81–101.
Keeling, C. D., CO2 emissions — Historical record, globalBoden T. A., Sepanski R. J., Stoss F. W., eds. Trends 91: A Compendium of Data on Global Change. Rep. ORNL/CDIAC-46. Oak Ridge Natl. Lab., New York, 1991. 382–385.
Keeling, C. D. Surface ocean CO2. In: Heimann M., ed. The Global Carbon Cycle. Oak Ridge, TN: Springer-Verlag; 1993:413–429.
Keeling, C. D., Bacastow, R. B. Impact of industrial gases on climate. In: Energy and Climate. Heidelberg: National Academy of Sciences; 1977:72–95.
Keeling, C. D., Bolin, B. The simultaneous use of chemical tracers in oceanic studies I. General theory of reservoir models. Tellus. 1967; 19:566–581.
Keeling, C. D., Bolin, B. The simultaneous use of chemical tracers in oceanic studies II. A three-reservoir model of the North and South Pacific Oceans. Tellus. 1968; 20:17–54.
Keeling, C. D., Whorf, T. P., Atmospheric CO2-Modern record, Mauna LoaBoden T. A., Sepanski R. J., Stoss F. W., eds. Trends 91: A Compendium of Data on Global Change. Rep. ORNL/CDIAC-46. Oak Ridge Natl. Lab., Washington, DC, 1991. 12–15.
Keeling, C. D., Bacastow, R. B., Bainbridge, A. E., Ekdahl, C. A., Guenther, P. R., Waterman, L. S., Chin, J. F. S. Atmospheric carbon dioxide variations at Mauna Loa Observatory, Hawaii. Tellus. 1976; 28(6):538–551.
Keeling, C. D., Adams, J. A., Ekdahl, C. A., Guenther, P. R. Atmospheric carbon dioxide variations at the South Pole. Tellus. 1976; 28(6):552–564.
Keeling, C. D., Mook, W. G., Tans, P. P. Recent trends in the 13C/12C ratio of atmospheric carbon dioxide. Nature. 1979; 277:121–123.
Keeling, C. D., Bacastow, R. B., Carter, A. F., Piper, S. C., Whorf, T. P., Heimann, M., Mook, W. G., Roeloffzen, H., A three-dimensional model of atmospheric CO2 transport based on observed winds: 1. Analysis of observational dataPeterson D. H., ed. Aspects of Climate Variability in the Pacific and Western Americas. Geophys. Monogr. Ser.; vol. 55. AGU, Oak Ridge, TN, 1989. 165–236.
Keeling, C. D., Piper, S. C., Heimann, M., A three-dimensional model of atmospheric CO2 transport based on observed winds: 4. Mean annual gradients and interannual variationsPeterson D. H., ed. Aspects of Climate Variability in the Pacific and Western Americas. Geophys. Monogr. Ser.; vol. 55. AGU, Washington, DC, 1989. 305–363.
Keeling, C. D., Whorf, T. P., Wahlen, M., van der Plicht, J. Interannual extremes in the rate of rise of atmospheric carbon dioxide since 1980. Nature. 1995; 375:666–670.
Keeling, C. D., Chin, J. F. S., Whorf, T. P. Increased activity of northern vegetation inferred from atmospheric CO2 measurements. Nature. 1996; 382:146–149.
Keeling, R. F., Piper, S. C., Heimann, M. Global and hemispheric CO2 sinks deduced from changes in atmospheric O2 concentration. Nature. 1996; 381:218–221.
Kempe, S. Carbon in the freshwater cycle. In: Bolin B., Degens E. T., Kempe S., Ketner P., eds. The Global Carbon Cycle. Washington, DC: Wiley; 1979:317–342.
Kempe, S. Carbon in the rock cycle. In: Bolin B., Degens E. T., Kempe S., Ketner P., eds. The Global Carbon Cycle. New York: Wiley; 1979:343–377.
Kiehl, J. T. Sensitivity of a GCM climate simulation to differences in continental versus maritime cloud drop size. J. Geophys. Res. 1994; 99:23107–23115.
Kiehl, J. T., Hack, J. J., Bonan, G. B., Boville, B. A., Briegleb, B. P., Williamson, D. L., Rasch, P. J. Description of the NCAR Community Climate Model (CCM3). In: NCAR Tech. Note NCAR/TN420+STR. New York: Natl. Cent. for Atmos. Res. ; 1996.
Kiehl, J. T., Hack, J. J., Bonan, G. B., Boville, B. B., Williamson, D. L., Rasch, P. J. The National Center for Atmospheric Research Community Climate Model: CCM3. J. Clim. 1998; 11:1131–1150.
Kindermann, J., Würth, G., Kohlmaier, G. H., Badeck, F. -W. Interannual variations of carbon exchange fluxes in terrestrial ecosystems. Global Biogeochem. Cycles. 1996; 10:737–755.
Knorr, W., Heimann, M. Impact of drought stress and other factors on seasonal land biosphere CO2 exchange studied through an atmospheric tracer transport model. Tellus, Ser. B. 1995; 47:471–489.
Komhyr, W. D., Gammon, R. H., Harris, T. B., Waterman, L. S., Conway, T. J., Taylor, W. R., Thoning, K. W. Global atmospheric CO2 distribution and variations from 1968–1982 NOAA/GMCC CO2 flask sample data. J. Geophys. Res. 1985; 90:5567–5596.
Koyama, T. Gaseous metabolism in lake sediments and paddy soils and the production of atmospheric methane and hydrogen. J. Geophys. Res. 1963; 68:3971–3973.
Kroopnick, P. The distribution of 13C in the Atlantic Ocean. Earth Planet. Sci. Letters. 1980; 49:469–484.
Kumar, A., Hoerling, M. P. Interpretation and implications of the observed inter-El Niño variability. J. Clim. 1997; 10:83–91.
Kumar, M., Monteith, J. L. Remote sensing of crop growth. In: Smith H., ed. Plants and the Daylight Spectrum. Boulder, CO: Academic Press; 1981:133–144.
Kutzbach, J., Bonan, G., Foley, J., Harrison, S. P. Vegetation and soil feedbacks on the response of the African monsoon to orbital forcing in the early to middle Holocene. Nature. 1996; 384:623–626.
Law, R., Simmonds, I. The sensitivity of deduced CO2 sources and sinks to variations in transport and imposed surface concentrations. Tellus, Ser. B. 1996; 48:613–625.
Law, R. M., Rayner, P. R., Denning, A. S., Erickson, D., Fung, I. Y., Heimann, M., Piper, S. C., Ramonet, M., Taguchi, S., Taylor, J. A., Trudinger, C. M., Watterson, I. G. Variations in modeled atmospheric transport of carbon dioxide and the consequences for CO2 inversions. Global Biogeochem. Cycles. 1996; 10:783–796.
Legates, D. R., Willmott, C. J. Mean seasonal and spatial variability in global surface air temperature. Theor. Appl. Climatol. 1990; 41:11–21.
Legates, D. R., Willmott, C. J. Mean seasonal and spatial variability in gauge-corrected, global precipitation. Int. J. Climatol. 1990; 10:111–127.
Levine, J. S. Biomass burning and the production of greenhouse gases. In: Zepp R. G., ed. Climate Biosphere Interaction: Biogenic Emissions and Environmental Effects of Climate Change. New York: John Wiley and Sons, 1994.
Lieth, H. The role of vegetation in the carbon dioxide content of the atmosphere. J. Geophys. Res. 1963; 68:3887–3898.
Lieth, H. Uber die primarproduktion der erde. Z. Angew. Bot. 1972; 46:1–37.
Lieth, H. Modeling the primary productivity of the world. In: Lieth H., Whittaker R. H., eds. Primary Productivity of the Biosphere. Springer-Verlag; 1975:237–263.
Likens G. E., ed. Some Perspectives of the Major Biogeochemical Cycles. New York: Wiley, 1981.
Liss, P. S. Gas transfer: experiments and geochemical implications. In: Liss P. S., Slinn W. G. N., eds. Air-Sea Exchange of Gases and Particles. New York: NATO ASI Series; 1983:241–298.
Livingstone, D. A., Chemical composition of rivers and lakesFleischer M., ed. Data of Geochemistry. 6th edn. US Geol. Surv. Prof. Pap. 440G. 1963:1–61.
Machta, L. The role of the oceans and biosphere in the carbon dioxide cycle. In: Dryssen D., Jagner D., eds. The Changing Chemistry of the Oceans. Reidel, Holland: Wiley Interscience, 1972.
Machta, L. Global scale atmospheric mixing. Advan. Geophys. 1974; 18B:33–56.
Maisongrande, P., Ruimy, A., Dedieu, G., Saugier, B. Monitoring seasonal and interannual variations of gross primary productivity, net primary productivity and net ecosystem productivity using a diagnostic model and remotely-sensed data. Tellus, Ser. B. 1995; 47:178–190.
Malmström, C. M., Thompson, M. V., Juday, G. P., Los, S. O., Randerson, J. T., Field, C. B. Interannual variation in global-scale net primary production: Testing model estimates. Global Biogeochem. Cycles. 1997; 11:367–392.
Marland, G., Boden, T. A., CO2 emissions — Modern record, globalBoden T. A., Sepanski R. J., Stoss F. W., eds. Trends 91: A Compendium of Data on Global Change. Rep. ORNL/CDIAC-46. Oak Ridge Natl. Lab., London, 1991. 386–389.
Marland, G., Rotty, R. M. Carbon dioxide emissions from fossil fuels: A procedure for estimation and results for 1950–1982. Tellus. 1984; 36B:232–261.
Marland, G., Boden, T. A., Griffin, R. C., Huang, S. F., Kanciruk, P., Nelson, T. R. Estimates of CO2 emissions from fossil fuel burning and cement manufacturing, based on the US Bureau of Mines cement manufacturing data. In: Rep. ORNL/CDIAC-25, NDP-030. Oak Ridge, TN: Carbon Dioxide Information Analysis Center, Oak Ridge Natl. Lab. ; 1989.
McGuire, A. D., Melillo, J. M., Joyce, L. A., Kicklighter, D. W., Grace, A. L., Moore, B., III., Vorosmarty, C. J. Interactions between carbon and nitrogen dynamics in estimating net primary productivity for potential vegetation in North America. Global Biogeochem. Cycles. 1992; 6:101–124.
McGuire, A. D., Melillo, J. M., Kicklighter, D. W., Pan, Y., Xiao, X., Helfrich, J., Moore, B., III., Vorosmarty, C. J., Schloss, A. L. Equilibrium responses of global net primary production and carbon storage to doubled atmospheric carbon dioxide: Sensitivity to changes in vegetation nitrogen concentration. Global Biogeochem. Cycles. 1997; 11:173–189.
Mehrbach, C., Culberson, C. H., Hawley, S. E., Pytkowicz, R. M. Measurement of the apparent dissociation constants of carbonic acid in seawater at atmospheric pressure. Limnol. Oceanog. 1973; 18(6):897–907.
Melillo, J. M., McGuire, A. D., Kicklighter, D. W., Moore, B., III., Vorosmarty, C. J., Schloss, A. L. Global climate change and terrestrial net primary production. Nature. 1993; 363:234–240.
Melillo, J. M., Prentice, I. C., Farquhar, G. D., Schulze, E. -D., Sala, O. E. Terrestrial biotic responses to environmental change and feedbacks to climate. In: Houghton J. T., et al, eds. Climate Change 1995: The Science of Climate Change. Oak Ridge, TN: Cambridge University Press; 1996:445–481.
Moore, B., Boone, R. D., Hobbie, J. E., Houghton, R. A., Melillo, J. M., Peterson, B. J., Shaver, G. R., Vorosmarty, C. J., Woodwell, G. M. A simple model for analysis of the role of terrestrial ecosystems in the global carbon budget. In: Bolin B., ed. Carbon Cycle Modeling. Cambridge: Wiley; 1981:365–385.
Mopper, K., Degens, E. T. Organic carbon in the ocean: nature and cycling. In: Bolin B., Degens E. T., Kempe S., Ketner P., eds. The Global Carbon Cycle. New York: Wiley; 1979:293–316.
Morse, J. W., Millero, F. J., Thurmond, V., Brown, E., Ostlund, H. G. The carbonate chemistry of Grand Bahama Bank Waters: after 18 years another look. J. Geophys. Res. 1984; 89(C3):3604–3614.
Myneni, R. B., Los, S. O., Asrar, G. Potential gross primary productivity of terrestrial vegetation from 1982–1990. Geophys. Res. Lett. 1995; 22:2617–2620.
Myneni, R. B., Los, S. O., Tucker, C. J. Satellite-based identification of linked vegetation index and sea surface temperature anomaly areas from 1982–1990 for Africa, Australia and South America. Geophys. Res. Lett. 1996; 23:729–732.
Myneni, R. B., Keeling, C. D., Tucker, C. J., Asrar, G., Nemani, R. R. Increased plant growth in the northern high latitudes from 1981 to 1991. Nature. 1997; 386:698–702.
Myneni, R. B., Tucker, C. J., Asrar, G., Keeling, C. D. Interannual variations in satellite-sensed vegetation index data from 1981 to 1991. J. Geophys. Res. 1998; 103:6145–6160.
NAG. The NAG Fortran Library Manual, Mark 15. New York: NAG Ltd; 1991.
Nakazawa, T., Murayama, S., Miyashita, K., Aoki, S., Tanaka, M. Longitudinally different variations of lower tropospheric carbon dioxide concentrations over the North Pacific Ocean. Tellus, Ser. B. 1992; 44:161–172.
Nakazawa, T., Morimoto, S., Aoki, S., Tanaka, M. Time and space variations of the carbon isotopic ratio of tropospheric carbon dioxide over Japan. Tellus, Ser. B. 1993; 45:258–274.
Neftel, A., Oeschger, H., Schwander, J., Stauffer, B., Zumbrunn, R. Ice core sample measurements give atmospheric CO2 content during the past 40,000 yr. Nature. 1982; 295:220–223.
Neftel, A., Moor, E., Oeschger, H., Stauffer, B. Evidence from polar ice cores for the increase in atmospheric CO2 in the past two centuries. Nature. 1985; 315:45–47.
Neftel, A., Friedli, H., Moor, E., Lötscher, H., Oeschger, H., Siegenthaler, U., Stauffer, B., Historical record from the Siple Station ice coreBoden T. A., Kaiser D. P., Sepanski R. J., Stoss F. W., eds. Trends ′93: A Compendium of Data on Global Change. Rep. ORNL/CDIAC-65. Oak Ridge Natl. Lab., Oxford, U. K., 1994. 11–14.
Nemry, B., François, L., Warnant, P., Robinet, R., Gérard, J. -C. The seasonality of the CO2 exchange between the atmosphere and the land biosphere: A study with a global mechanistic vegetation model. J. Geophys. Res. 1996; 101:7111–7125.
Nepstad, D. C., de Carvalho, C. R., Davidson, E. A., Jipp, P. H., Lefebvre, P. A., Negreiros, G. H., da Silva, E. D., Stone, T. A., Trumbore, S. E., Vieira, S. The role of deep roots in the hydrological and carbon cycles of Amazonian forests and pastures. Nature. 1994; 372:666–669.
Nisbet, E. G. Sources of atmospheric CH4 in early postglacial time. J. Geophys. Res. 1992; 97(D12):12859–12867.
Nordström, H. Gräs. Oak Ridge, TN: Natur och Kultur; 1990.
Nydal, R., Lövseth, K. Tracing bomb 14C in the atmosphere 1962–1980. J. Geophys. Res. 1983; 88(C6):3621–3642.
Oeschger, H., Siegenthaler, U., Schotterer, U., Gugelmann, A. A box-diffusion model to study the carbon dioxide exchange in nature. Tellus. 1975; 27:168–192.
TR004 Olson, J. S., Watts, J. A., Allison, L. J. Carbon in live vegetation of major world ecosystems. Stockholm: United States Department of Energy; 1983.
Pearman, G. The CSIRO (Australia) Atmospheric CO2 Monitoring Program. In: Bolin B., ed. Carbon Cycle Modeling. Wiley; 1981:117–120.
Pearman, G. I., Beardsmore, D. J. Atmospheric carbon dioxide measurements in the Australian region: Ten years of aircraft data. Tellus, Ser. B. 1984; 36:1–24.
Pearman, G. I., Hyson, P. Activities of the global biosphere as reflected in atmospheric CO2 records. J. Geophys. Res. 1980; 85:4468–4474.
Pearman, G. I., Hyson, P. The annual variation of atmospheric CO2 concentration observed in the Northern Hemisphere. J. Geophys. Res. 1981; 86:9839–9843.
Pearman, G. I., Hyson, P. Global transport and inter-reservoir exchange of carbon dioxide with particular reference to stable isotopic distributions. J. Atm. Chem. 1986; 4:81–124.
Pearman, G. I., Hyson, P., Fraser, P. J. The global distribution of atmospheric carbon dioxide: 1. Aspects of observations and modeling. J. Geophys. Res. 1983; 88:3581–3590.
Peng, T. -H., Broecker, W. S., Mathieu, G. G., Li, Y. -H. Radon evasion rates in the Atlantic and Pacific Oceans as determined during the GEOSECS program. J. Geophys. Res. 1979; 84:2471–2486.
Peng, T. -H., Broecker, W. S., Freyer, H. D., Trumbore, S. A deconvolution of the tree ring based δ13C record. J. Geophys. Res. 1983; 88(C6):3609–3620.
Post, W. M., King, A. W., Wullschleger, S. D. Historical variations in terrestrial biospheric carbon storage. Global Biogeochem. Cycles. 1997; 11:99–109.
Potter, C. S., Randerson, J. T., Field, C. B., Matson, P. A., Vitousek, P. M., Mooney, H. A., Klooster, S. A. Terrestrial ecosystem production: A process model based on global satellite and surface data. Global Biogeochem. Cycles. 1993; 7:811–841.
Quay, P. D., Tillbrook, B., Wong, C. S. Oceanic uptake of fossil fuel CO2: Carbon-13 evidence. Science. 1992; 256:74–79.
Raich, J. W., Schlesinger, W. H. The global carbon dioxide flux in soil respiration and its relationship to vegetation and climate. Tellus, Ser. B. 1992; 44:81–99.
Randall, D. A., Dazlich, D. A., Zhang, C., Denning, A. S., Sellers, P. J., Tucker, C. J., Bounoua, L., Berry, J. A., Collatz, G. J., Field, C. B., Los, S. O., Justice, C. O., Fung, I. Y. A revised land surface parameterization (SiB2) for GCMs. Part III: The greening of the Colorado State University General Circulation Model. J. Clim. 1996; 9:738–763.
Randerson, J. T., Thompson, M. V., Malmström, C. M., Field, C. B., Fung, I. Y. Substrate limitations for heterotrophs: Implications for models that estimate the seasonal cycle of atmospheric CO2. Global Biogeochem. Cycles. 1996; 10:585–602.
Randerson, J. T., Thompson, M. V., Conway, T. J., Fung, I. Y., Field, C. B. The contribution of terrestrial sources and sinks to trends in the seasonal cycle of atmospheric carbon dioxide. Global Biogeochem. Cycles. 1997; 11:535–560.
Raynaud, D., Jouzel, J., Barnola, J. M., Chappellaz, J., Delmas, R. J., Lorius, C. The ice record of greenhouse gases. Science. 1993; 259:926–934.
Rayner, P. J., Law, R. M. A comparison of modelled responses to prescribed CO2 sources. In: Tech. Pap. 36. New York: Div. of Atmos. Res., Comm. Sci. and Ind. Res. Org. ; 1995.
Redfield, A. C. On the proportions of organic derivatives in sea water and their relation to the composition of plankton. In: James Johnson Memorial Volume. Melbourne, Victoria: Liverpool; 1934:176–192.
Redfield, A. C., Ketchum, B. H., Richards, F. A., The influence of organisms on the composition of sea waterHill, M. N., eds. The Sea; Vol. 2. Wiley-Interscience, 1963. 26–77.
Revelle, R. Carbon dioxide and world climate. Scient. Am. 1982; 247(2):33–41.
Revelle, R., Suess, H. E. Carbon dioxide exchange between atmosphere and ocean, and the question of an increase of atmospheric CO2 during the past decades. Tellus. 1957; 9:18–27.
Revelle, R., Munk, W. The carbon dioxide cycle and the biosphere. In: Energy and Climate. New York: National Academy of Sciences; 1977:140–158.
Richey, J. E. C, N, P, and S cycles: major reservoirs and fluxes; the phosphorus cycle. In: Bolin B., Cook R. B., eds. The Major Biogeochemical Cycles and Their Interactions. Washington, DC: Wiley; 1983:51–56.
Ronov, A. B. Common tendancies in the chemical evolution of the Earth’s crust, ocean, and atmosphere. Geochem. 1964; 8:715–743.
Ropelewski, C. F., Halpert, M. S. Global and regional scale precipitation patterns associated with the El Niño/Southern Oscillation. Mon. Wea. Rev. 1987; 115:1606–1626.
Rosenberg, N. J. The increasing CO2 concentration in the atmosphere and its implications on agricultural productivity. I. Effects on photosynthesis, transpiration and water use efficiency. Climat. Change. 1981; 3:265–279.
Rotty, R. M. Data for global CO2 production from fossil fuels and cement. In: Bolin B., ed. Carbon Cycle Modeling. New York: Wiley; 1981:121–125.
Sarmiento, J. L. Atmospheric CO2 stalled. Nature. 1993; 365:697–698.
Sarmiento, J. L., Orr, J. C., Siegenthaler, U. A perturbation simulation of CO2 uptake in an ocean general circulation model. J. Geophys. Res. 1992; 97:3621–3645.
Sarmiento, J. L., Hughes, T. M. C., Stouffer, R. J., Manabe, S. Simulated response of the ocean carbon cycle to anthropogenic climate warming. Nature. 1998; 393:245–249.
Schimel, D. S., Braswell, B. H., Holland, E. A., McKeown, R., Ojima, D. S., Painter, T. H., Parton, W. J., Townsend, A. R. Climatic, edaphic, and biotic controls over storage and turnover of carbon in soils. Global Biogeochem. Cycles. 1994; 8:279–293.
Schimel, D. S., Enting, I. G., Heimann, M., Wigley, T. M. L., Raynaud, D., Alves, D., Siegenthaler, U. CO2 and the carbon cycle. In: Houghton J. T., et al, eds. Climate Change 1994: Radiative Forcing of Climate Change and an Evaluation of the IPCC IS92 Emission Scenarios. New York: Cambridge University Press; 1995:35–71.
Schimel, D. S., Braswell, B. H., McKeown, R., Ojima, D. S., Parton, W. J., Pulliam, W. Climate and nitrogen controls on the geography and time-scale of terrestrial biogeochemical cycling. Global Biogeochem. Cycles. 1996; 10:677–692.
Schlesinger, W. H. Carbon balance in terrestrial detritus. Ann. Ecol. Syst. 1977; 8:51–81.
Schnell, R. C., Odh, S. -, Njau, L. N. Carbon dioxide measurements in tropical East African biomes. J. Geophys. Res. 1981; 86:5364–5372.
Schwander, J., Stauffer, B. Age difference between polar ice and the air trapped in its bubbles. Nature. 1984; 311:45–47.
Schwander, J., Barnola, J. M., Andrié, C., Leuenberger, M., Ludin, A., Raynaud, D., Stauffer, B. The age of the air in the firn and the ice at Summit, Greenland. J. Geophys. Res. 1993; 98:2831–2838.
Sedjo, R. A. Temperate forest ecosystems in the global carbon cycle. Ambio. 1992; 21:274–277.
Seiler, W., Crutzen, P. J. Estimates of gross and net fluxes of carbon between the biosphere and the atmosphere from biomass burning. Climat. Change. 1980; 2:226–247.
Sellers, P. J. Canopy reflectance, photosynthesis and transpiration. Int. J. Remote Sens. 1985; 6:1335–1372.
Sellers, P. J., Mintz, Y., Sud, Y. C., Dalcher, A. A simple biosphere model (SiB) for use within general circulation models. J. Atmos. Sci. 1986; 43:505–531.
Sellers, P. J., Berry, J. A., Collatz, G. J., Field, C. B., Hall, F. G. Canopy reflectance, photosynthesis, and transpiration. III. A reanalysis using improved leaf models and a new canopy integration scheme. Remote Sens. Environ. 1992; 42:187–216.
Sellers, P. J., Randall, D. A., Collatz, G. J., Berry, J. A., Field, C. B., Dazlich, D. A., Zhang, C., Collelo, G. D., Bounoua, L. A revised land surface parameterization (SiB2) for atmospheric GCMs. Part I: Model formulation. J. Clim. 1996; 9:676–705.
Sellers, P. J., Los, S. O., Tucker, C. J., Justice, C. O., Dazlich, D. A., Collatz, G. J., Randall, D. A. A revised land surface parameterization (SiB2) for atmospheric GCMs. Part II: The generation of global fields of terrestrial biophysical parameters from satellite data. J. Clim. 1996; 9:706–737.
Shea, D. J., Trenberth, K. E., Reynolds, R. W. A global monthly sea surface temperature climatology. In: NCAR Tech. Note NCAR/TN-345+STR. Cambridge: Natl. Cent. for Atmos. Res. ; 1990:167.
Siegenthaler, U. Uptake of excess CO2 by an outcrop-diffusion model of the ocean. J. Geophys. Res. 1983; 88(C6):3599–3608.
Siegenthaler, U. El Niño and atmospheric CO2. Nature. 1990; 345:295–296.
Siegenthaler, U., Oeschger, H. Biospheric CO2 emissions during the past 200 years reconstructed by deconvolution of ice more data. Tellus. 39B, 1987.
Siegenthaler, U., Joos, F. Use of a simple model for studying oceanic tracer distributions and the global carbon cycle. Tellus. 1992; 44B:186–207.
Siegenthaler, U., Sarmiento, J. L. Atmospheric carbon dioxide and the ocean. Nature. 1993; 365:119–125.
Simmons, A. J., Strüfing, R. Numerical forecasts of stratospheric warming events using a model with a hybrid vertical coordinate. Q. J. R. Meteorol. Soc. 1983; 109:81–111.
Six, C., Fischer, A., Walters, S. The seasonal cycle of atmospheric CO2: A study based on the NCAR Community Climate Model (CCM2). J. Geophys. Res. 1996; 101:15079–15097.
Skirrow, J., The dissolved gases — carbon dioxideRiley, J. P., Skirrow, G., eds. Chemical Oceanography, 2nd edn, Vol. 2. Boulder, CO: Academic Press, 1975; 1–192.
Smith, T. M., Shugart, H. H. The transient response of terrestrial carbon storage to a perturbed climate. Nature. 1993; 361:523–526.
Stuermer, D. H., Payne, J. R. Investigation of seawater and terrestrial humic substances with carbon-13 and proton nuclear magnetic resonance. Geochim. Cosmochim. Acta. 1976; 40:1109–1114.
Stuiver, M. 14C distribution in the Atlantic Ocean. J. Geophys. Res. 1980; 85:2711–2718.
Stuiver, M., Polach, H. A. Discussion reporting of 14C data. Radiocarbon. 1977; 19:355–363.
Stuiver, M., Quay, P. D. Changes in atmospheric carbon-14 attributed to a variable sun. Science. 1980; 207:11–19.
Stuiver, M., Quay, P. D. Atmospheric 14C changes resulting from fossil fuel CO2 release and comic ray flux variability. Earth Planet. Sci. Lett. 1981; 53:349–362.
Stuiver, M., Ostlund, H. G., McConnaughey, T. A. GEOSECS Atlantic and Pacific 14C distribution. In: Bolin B., ed. Carbon Cycle Modeling. London: Wiley; 1981:201–221.
Stuiver, M., Quay, P. D., Ostlund, H. G. Abyssal water carbon-14 distribution and the age of the world oceans. Science. 1983; 219:849–851.
Stumm, W., Morgan, J. J. Aquatic Chemistry, 2nd edn. New York: Wiley; 1981.
Suess, H. E. Secular variations of the cosmicray-produced carbon-14 in the atmosphere and their interpretation. J. Geophys. Res. 1965; 70:5937–5952.
Sundquist, E. T. The global carbon dioxide budget. Science. 1993; 259:934–941.
Taguchi, S. A three-dimensional model of atmospheric CO2 transport based on analyzed winds: Model description and simulation results for TRANSCOM. J. Geophys. Res. 1996; 101:15 099–15 109.
Takahashi, T., Broecker, W. S., Werner, S. R., Bainbridge, A. E. Carbonate chemistry of the surface waters of the world oceans. In: Goldberg E. P., Horibe Y., Sarubashi K., eds. Isotope Marine Chemistry. New York: Uchida Rokakuho; 1980:291–326.
Takahashi, T., Broecker, W. S., Bainbridge, A. E. The alkalinity and total carbon dioxide concentration in the world oceans. In: Bolin B., ed. Carbon Dioxide Modeling. Tokyo: Wiley; 1981:271–286.
Tanaka, M., Nakazawa, T., Aoki, S. Time and space variations of tropospheric carbon dioxide over Japan. Tellus, Ser. B. 1987; 39:3–12.
Tans, P. P., Conway, T. J., Nakazawa, T. Latitudinal distribution of the sources and sinks of atmospheric carbon dioxide derived from surface observations and an atmospheric transport model. J. Geophys. Res. 1989; 94:5151–5172.
Tans, P. P., Fung, I. Y., Takahashi, T. Observational constraints on the global atmospheric CO2 budget. Science. 1990; 247:1431–1438.
Taylor, J. A. A stochastic Lagrangian atmospheric transport model to determine global CO2 sources and sinks — a preliminary discussion. Tellus, Ser. B. 1989; 41:272–285.
Thompson, M. L., Enting, I. G., Pearman, G. I., Hyson, P. Interannual variation of atmospheric CO2 concentration. J. Atm. Chem. 1986; 4:125–155.
Thompson, M. V., Randerson, J. T., Malmström, C. M., Field, C. B. Change in net primary production and heterotrophic respiration: How much is necessary to sustain the terrestrial carbon sink? Global Biogeochem. Cycles. 1996; 10:711–726.
Walker, J. C. G. Evolution of the Atmosphere. New York: Macmillan; 1977.
Warnant, P., François, L., Strivay, D., Gérard, J. -C. CARAIB: A global model of terrestrial biological productivity. Global Biogeochem. Cycles. 1994; 8:255–270.
Warneck, P., Chemistry of the Natural Atmosphere. International Geophysics Series; Vol. 41. Academic Press, New York, 1988.
Watson, R. T., Rodhe, H., Oeschger, H., Siegenthaler, U. Greenhouse gases and aerosols. In: Houghton J. T., Jenkins G. J., Ephraums J. J., eds. Climate Change, the IPCC Scientific Assessment. San Diego: Cambridge University Press; 1990:1–40.
Weiss, R. F. Carbon dioxide in water and seawater: the solubility of a non-ideal gas. Marine Chem. 1974; 2:203–215.
Wigley, T. M. L. The pre-industrial carbon dioxide level. Climat. Change. 1983; 5:315–320.
Wigley, T. M. L. A simple inverse carbon cycle model. Global Biogeochem. Cycles. 1991; 5:373–382.
Wigley, T. M. L. Balancing the carbon budget: Implications for projections of future carbon dioxide concentration changes. Tellus. 1993; 45B:409–425.
Wigley, T. M. L. How important are carbon cycle uncertainties? In: Hanisch T., ed. Climate Change and the Agenda for Research. New York: Westview; 1994:169–191.
Williams, P. J. le B., Biological and chemical aspects of dissolved organic material in sea waterRiley, J. P., Skirrow, G., eds. Chemical Oceanography, 2nd edn, Vol. II. Boulder, CO: Academic Press, 1975; 301–363.
Williams, R. T. Transient Tracers in the Ocean Preliminary Hydrographic Report; Vols 1–4. Scripps Institution of Oceanography, London, 1982.
Williamson, D. L., Rasch, P. J. Water vapor transport in the NCAR CCM2. Tellus, Ser. A. 1994; 46:34–51.
Wofsy, S. C., Goulden, M. L., Munger, J. W., Fan, S. -M., Bakwin, P. S., Daube, B. C., Bassow, S. L., Bazzaz, F. A. Net exchange of CO2 in a midlatitude forest. Science. 1993; 260:1314–1316.
Wolter, K. Trimming problems and remedies in COADS. J. Clim. 1997; 10:1980–1997.
Wong, C. S., Chan, Y. -H., Page, J. S., Smith, G. E., Bellegay, R. D. Changes in the equatorial CO2 flux and new production estimated from CO2 and nutrient levels in Pacific surface waters during the 1986/87 El Niño. Tellus, Ser. B. 1993; 45:64–79.
Woodwell, G. M. The carbon dioxide question. Scient. Am. 1978; 238:38–43.
Woodwell G. M., Pecan E. V., eds. Carbon and the Biosphere. La Jolla, CA: United States Atomic Energy Commission, 1973.
Woodwell, G. M., Hobbie, J. E., Houghton, R. A., Melillo, J. M., Moore, B., Peterson, B. J., Shaver, G. R. Global deforestation: contribution to atmospheric carbon dioxide. Science. 1983; 222:1081–1086.
Zhang, G. J., McFarlane, N. A. Sensitivity of climate simulations to the parameterization of cumulus convection in the Canadian Climate Centre General Circulation Model. Atmos. -Ocean. 1995; 33:407–446.
Zinsmeister, A. R., Redman, T. C. A time series analysis of aerosol composition measurements. Atmos. Environ. 1980; 14:201–215.


