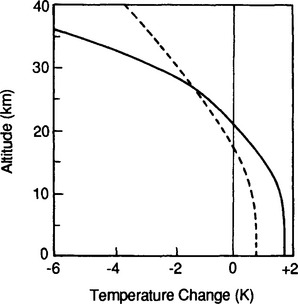
The Atmosphere
7.1 Definition
The atmosphere is a thin layer of gas uniformly covering the whole Earth. Its main constituents are nitrogen (N2), oxygen (O2), argon (Ar), water (H2O gas, liquid and solid), and carbon dioxide (CO2). The origins of these main constituents are discussed in Chapter 2. This chapter will first concentrate on the physical properties of the atmosphere and the ways in which these influence chemical composition – particularly through diffusion and transport. Then the chemical processes of the atmosphere are discussed with emphasis on minor constituents. As will become evident, most of the chemical functioning of the atmosphere involves substances other than N2, O2, Ar, H2O, and CO2. Even though some of these are often products of or participants in reactions, their abundance is so great that their concentrations are not perturbed. Because of the particular importance of CO2, it is considered in detail in Chapter 11.
Five chemical features of the atmosphere are emphasized.
1. Altitude dependence. The composition varies with altitude. Part of that vertical structure is due to the physical behavior of the atmosphere while part is due to the influence of trace substances (notably ozone and condensed water) on thermal structure and mixing.
2. Transport and diffusion. With the exception of N2, O2, Ar, and numerous other long-lived species that are well-mixed in the bulk of the atmosphere, horizontal and vertical transport are closely coupled with chemical reactions in controlling atmospheric trace-substance concentrations.
3. Composition. Air is a mixture of a large number of species with concentrations varying in space and time. Of particular interest are ozone and compounds of sulfur, nitrogen, and carbon, and their chemical interactions.
4. Role of composition in atmospheric physical process. The composition of the atmosphere plays a distinct set of roles in controlling and affecting certain physical processes of the atmosphere, most notably the thermal structure.
5. Processes that occur at the upper and lower boundaries of the atmosphere. Many atmospheric constituents are formed, and many undergo a wide range of reactions at the lower boundary. At the upper boundary lighter elements are lost to space and some important substances are acquired.
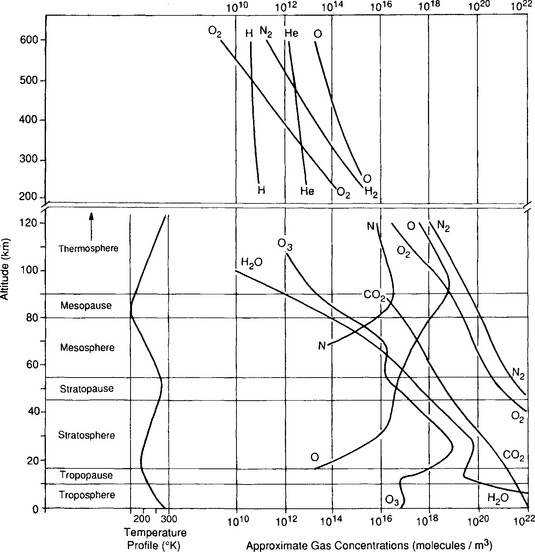
Before setting out to discuss the vertical structure of the atmosphere, we note that it is useful to have access to conventional nomenclature.Figure 7-1, based on the thermal profile of the atmosphere, includes a number of commonly used definitions.
7.2 The Vertical Structure of the Atmosphere
7.2.1 Hydrostatic Equation
The atmosphere is very close to being in hydrostatic equilibrium in the vertical dimension. This can be described by the hydrostatic equation:
where P is pressure, ρ is density, g is the acceleration of gravity and z is the vertical coordinate. We have two choices for describing dP/dz. For an ideal gas, PV=nRT where V is volume, n is number of moles, R is the gas constant and T is temperature. So,
where m is the mass and M is the molecular mass of the gas. Since m/V=ρ,
The choices come in defining M for this mixture of gases. We might define Mi for each gas separately, or we might define a mean value M=Σi XiMi where Xi is the mole fraction of component i. The use of Mi holds for Pi of any individual species in the absence of any physical mixing (e.g., by turbulence or Brownian motion), while M would be used in the case of perfect mixing.
7.2.2 Scale Height
If we define a molecular weight for each constituent, then we can rearrangeEquation (1). Because ρ=PM/RT,
so
where Hi = RT/Mig is called the scale height. In this situation, constituents with low M have large H so they tend to fall off in pressure (and concentration) slowly with altitude, while the opposite is true of constituents with high values of M. In such cases, each gas behaves as if no other substance were present. High-molecular-mass gases (e.g., Xe, Kr) would be concentrated in a layer at the bottom of the atmosphere and lighter gases (H2, He) would extend to greater altitude. This diffusive separation is not generally significant at low altitudes but occurs increasingly at altitudes above 120 km. Turbulent mixing separates the atmosphere into two layers – the mixed layer at the bottom being called the homosphere and the upper layer, the heterosphere. The highest reaches of the atmosphere are thus dominated by H and He, and in the heterosphere heavy unreactive gases (40Ar, Xe, Kr, etc.) fall off rapidly with height.Figure 7-1 illustrates this compositional feature of the atmosphere at altitudes above ca. 120 km.
The abundance of light elements at high altitude leads to a finite flux of these substances escaping the Earth’s gravitational field. This results from a combination of a very long mean free path and a few particles having the requisite escape velocity due to the high-velocity “tail” of the Boltzmann velocity distribution.
In terms of relevance to biogeochemical cycling, most of our emphasis is placed on the so-called homosphere (which really is homogeneous only with respect to N2, O2, 40Ar, and other long-lived gases).
In the case of a mixed atmosphere, M cannot be defined precisely since the composition is variable (especially due to water vapor). If dry air is assumed (which is a good approximation most of the time at altitudes above about 5 km), then M = 28.97 g/mol. If the atmosphere is assumed to be roughly isothermal, then fromEquation (5) pressure falls off with altitude as
Since H is constant if T and M are constant, H ≈ 8 km if T = 273 K. H is the height the entire atmosphere would have if its density were constant at the sea level value throughout.
7.2.3 Lapse Rate
The atmosphere is not isothermal – largely due to the fact that it really is a compressible medium. In the simplest case of a dry atmosphere being mixed in the vertical direction with no addition or loss of energy, we might assume that an air parcel behaves adiabatically when it is not in contact with the ground. This implies that its enthalpy, H, is constant. If we define the geopotential at a given height, f, as the work needed to move a unit mass from sea level to that height, then
For one mole of an ideal gas, dH=Cp dT+Mdϕ, where Cp is the constant pressure heat capacity per mole. Now the adiabatic condition implies that
If we divide by dz and useEquation (1), we have
Γd is called the dry adiabatic lapse rate. For air, Cp = 29.09 J/(mol K), and on Earth g = 9.81 m/s, so Γd = 9.8 K/km.
Another way of expressing the way temperature varies in the vertical direction involves the concept of potential temperature, 9. Potential temperature is defined as the temperature a parcel of air would reach if brought adiabatically from its existing temperature and pressure to a standard pressure, P0. Hence
if T is the temperature at pressure P. This concept is widely used in meteorology, since in the absence of clouds and heat exchange it is convenient to assume that θ is constant for a parcel of air as it moves in the atmosphere.
7.2.4 Static Stability
Now, intuitively, we can consider a perfectly mixed cloudless atmosphere to have constant θ and thus it behaves in a sense like an isothermal body of water, i.e., no part of it is buoyant. If we allow for a layer of air of low θ to occur at the bottom of the atmosphere (like cold water at the bottom of a lake) it is stably stratified and an inversion is said to exist. This layer of relatively low θ acts as a barrier to vertical mixing and hence becomes a physical feature of the atmosphere that is dominant in controlling the dispersion of trace substances (see box).
Another widely used concept is that of a planetary boundary layer (PBL) in contact with the surface of the Earth above which lies the “free atmosphere.” This PBL is to some degree a physically mixed layer due to the effects of shear-induced turbulence and convective overturning near the Earth’s surface.
The PBL has different characteristics depending on wind speed and static stability; these can be roughly distributed between two extreme categories:
1. Cold air under warm air (inversion), such as warm air over snow or cold ocean water,
coupled with low wind speed produces a thin PBL and thus a thin mixed layer. As an extreme example, in the Arctic winter the PBL may be only 100 m deep leading to the trapping of water and pollutants near the ground and the formation of ice fog. A less extreme but well-known example is the inversion in such cities as Los Angeles, London or Mexico City, again trapping trace substances and causing elevated concentration of pollutants.
2. The lapse rate in the PBL is unstable and vertical motion leads to the transport of significant amounts of energy upward, due to the buoyancy of air that has been in contact with the surface. A mixed layer forms up to a height where static stability of the air forms a barrier to thermally induced upward motion. This extreme occurs practically daily over the arid areas of the world and the barrier to upward mixing is often the tropopause itself. On the average in mid-latitudes, the unstable or mixed PBL is typically 1–2 km deep.
Figure 7-2 shows the vertical profiles of temperature, dew point, light scattering (a measure of aerosol concentration) and the concentrations of O3 and SO2. Here we see that up to about 1.5 km, the temperature, dew point, light scattering (a measure of aerosol concentration) and the concentrations of O3 and SO2 are nearly constant. This indicates the presence of a mixed PBL. Above 1.5 km the profiles change dramatically.
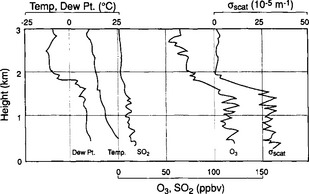
Fig. 7-2 Vertical profiles of physical (temperature, dew point, and backscatter coefficient) and chemical (ozone, sulfur dioxide) variables near Scranton, PA during the afternoon of 20 July 1978. (Modified with permission from P. K. Mueller and G. M. Hidy (1982). “The Sulfate Regional Documentation of SURE Sampling Sites”, EPRI report EA-1901, v. 3, Electric Power Research Institute.)
In between the two extremes of stability and instability there are numerous near-neutral stability situations, resulting in varying degrees of vertical mixing. In this regime, the mixing depends on such factors as shear-induced turbulence and vertical mixing in and by clouds.
7.3 Vertical Motions, Relative Humidity, and Clouds
When air moves vertically, its temperature changes in response to the local pressure. Indeed, the amount of temperature change is quite large for small changes in height; one degree per 100 m, if the dry adiabatic lapse rate applies. Considering upward motion (and therefore cooling), an adiabatic decrease of pressure of only 10% due to an altitude increase from 100 to 1000 m results in a change in temperature of – 9°C. This amount of cooling results in a major increase in the relative humidity (RH) due to the very strong dependence of the saturation vapor pressure of water on temperature. Details of this are discussed in Section 7.7 (below); however, the consequence of increasing RH due to upward vertical motion is that upward motions of more than a few tens to a few hundreds of meters often cause the air to reach RH = 100% and form clouds. It is important to realize that, even though the decrease in pressure causes a decrease in the amount of water in a fixed volume of air, the temperature decrease is more significant, causing an increase in RH.
Thus we see that vertical motions upward cause water clouds to develop; conversely air that descends becomes warm, causing the RH to decrease and clouds to disappear.
Vertical motions in the atmosphere are caused by a variety of factors:
1. Convection due to the solar heating of the Earth’s surface. Upward velocities of 2–20 cm/s occur.
2. Upward motion associated with convergence of horizontal motions (or vice versa, sinking due to divergence). This will be evident in the discussion of horizontal motions inSection 7.5. Again, vertical velocities of only cm/s usually are observed.
3. Horizontal motion over topographic features at the Earth’s surface. A classic example of this is seen in the cap clouds associated with flow over mountains.
4. Buoyancy caused by the release of latent heat of condensation of water. As will be seen inSection 7.7, water releases a substantial amount of energy when it condenses.
Even though upward motion causes cooling of a parcel of air, the condensation of water vapor can maintain the temperature of a parcel of air above that of the surrounding air. When this happens, the parcel is buoyant and may accelerate further upwards. Indeed, this is an unstable situation which can result in violent updrafts at velocities of meters per second. Cumulus clouds are produced in this fashion, with other phenomena such as lightning, heavy precipitation and locally strong horizontal winds below the cloud (which provide the air needed to support the vertical motion).
On the average, the air over roughly half of the Earth’s surface has an upward velocity and half has a downward velocity. This frontal activity (Section 7.5.3) and the interactions of marine air with the cold ocean surface result in about half of the Earth being covered by clouds and half being clear. As will be discussed in Chapter 17, this large fractional cloud cover is extremely important to the Earth’s climate because it controls the planetary albedo (reflectivity).
7.4 The Ozone Layer and the Stratosphere
Another major feature of the vertical thermal structure of the atmosphere is due to the presence of ozone, O3, in the stratosphere. This layer is caused by photochemical reactions involving oxygen. The absorption of solar UV radiation by O3 causes the temperature in the stratosphere and mesosphere to be much higher than expected from an extension of the adiabatic temperature profile in the troposphere (see Fig. 7-1).
Briefly, oxygen can be photodissociated by solar UV of wavelength less than 242 nm:
Subsequently the following reactions occur:
The dissociation of O3 inEquation (11) occurs at longer wavelengths than for the dissociation of O2. The progress of this reaction is halted by
In reality, many other chemical and photochemical processes take place leading to a sort of steady-state concentration of O3 which is a sensitive function of height. To be accurate, it is necessary to include the reactions of nitrogen oxides, chlorine- and hydrogen-containing free radicals (molecules containing an unpaired electron). However, occurrence of a layer due to the altitude dependence of the photochemical processes is of fundamental geochemical importance and can be demonstrated simply by the approach of Chapman (1930).
The concentration of O2 is approximately an exponential function of altitude:
where is the concentration of O2, e.g. in molecules per unit volume,
 is the concentration at z = 0, and H is the scale height. Now the intensity, I, of solar UV light falling on the atmosphere (in the direction of decreasing z) at an angle χ from the zenith will be attenuated as it penetrates into the atmosphere:
or
where A is the absorption cross-section for O2. Integrating:
Now, the rate of the production of O3 via the photolysis of O2 is roughly given by the rate of photolysis of O2 itself (the O + O2 reaction is assumed to be fast). Thus, the rate of O3 production as a function of altitude, q(z), should be proportional to the rate of disappearance of photons as a function of altitude:
where β denotes proportionality. UsingEquation (16) we find that q(z) has a maximum at a height
The dependence of I on z results in a layer of O3, the upper portion of the layer being controlled by the exponential decrease of with altitude. The lower part of the layer is controlled by the fall-off of intensity of UV light as the solar beam penetrates into the increasingly dense atmosphere. More extensive treatments of this phenomenon can be found, e.g. in Wayne (1985, p. 117 ff.).
The resultant O3 layer is critically important to life on Earth as a shield against UV radiation. It also is responsible for the thermal structure of the upper atmosphere and controls the lifetime of materials in the stratosphere. Many substances that are short-lived in the troposphere (e.g. aerosol particles) have lifetimes of a year or more in the stratosphere due to the near-zero removal by precipitation and the presence of the permanent thermal inversion and lack of vertical mixing that it causes.
Besides these features, the formation of a layer due to an interaction of a stratified fluid with light is itself noteworthy. Analogs to this phenomenon can be found in other media. Examples include photochemical reactions in the atmosphere near the Earth’s surface, photochemical reactions in the surface water of the ocean and biological activity near the ocean surface.
7.5 Horizontal Motions, Atmospheric Transport, and Dispersion
The horizontal motion of the atmosphere (or wind) is characterized by four spatial scales. These, with their conventional names, are:
1. 0 to 10 km – the micrometeorologic scale, in which turbulent dispersion of materials is dominant.
2. 10 to hundreds of km – the mesometeorologic scale, in which both advection and turbulent dispersion are effective.
3. Hundreds to thousands of km – the synoptic scale, in which motions are those of whole weather systems. Advection is the dominant transport process.
Going along with these spatial scales, we can define temporal scales as well. Micrometeorologic processes tend to be important for times less than an hour, mesoscale processes, up to about a day, and synoptic scale, a few days or more.
7.5.1 Microscale Turbulent Diffusion
Accurate description of mixing processes on each of these scales is only possible in a few selected and idealized cases. One of the best understood cases is that of a turbulent PBL over flat terrain and a point source of a trace substance. In this case, the concentration downwind of the source is often described as a plume.Figure 7-3 shows such an idealized plume.
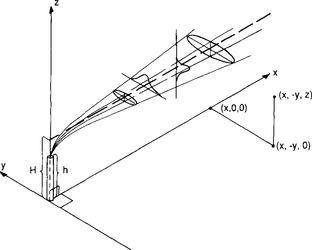
Fig. 7-3 Coordinate system showing the formation downwind from a source of Gaussian distributions of chemical concentrations in the horizontal and vertical. Ellipses denote the loci of two standard deviations.
Spreading in the downwind direction results from advection by the wind. Spreading at right angles to the wind results from turbulence. This description does not often hold for distances greater than a few tens of km. Mixing and transport over the mesoscale is extremely hard to describe and is often dominated by local topography, presence of organized vertical motions (e.g., into clouds or “thermals” due to convection) and stable layers that are embedded in the PBL.
7.5.2 Synoptic Scale Motion: The General Circulation
The motion of substances on the synoptic scale is often assumed to be pure advection. The flux through a unit area perpendicular to the wind is simply the product of wind velocity and concentration. If F is flux, V the velocity, and c concentration,
where such transport is called advection. (See also Chapter 4.)
The motions on the largest spatial scales amount to the aggregate of the world’s synoptic weather systems, often called the general circulation. Both with respect to substances that have atmospheric lifetimes of a day or more and with regard to the advection of water, it is useful to depict the nature of this general circulation. The mean circulation is described to some extent in terms of the Hadley and Ferrell cells shown in Fig. 7-4. They describe a coupled circulation driven by the large input of solar radiation near the equator. While departures from the circulation inFig. 7-4 are substantial, this average pattern does account for major aspects of the pattern of global precipitation. See also Fig. 17-1a and b, later in the book.
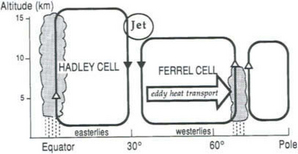
Fig. 7-4 Cross-section of the northern hemisphere atmosphere showing first-order circulation. The southern hemisphere is a mirror image.
Three regions of the atmosphere are seen to have significant zonal components of flow and thus of advection. The mid-latitude troposphere at the surface tends to exhibit westerly flow (i.e., flow from west to east) on the average. This region contains the familiar high- and low-pressure systems that cause periodicity in mid-latitude weather. Depending on the lifetime of the substances of concern, the motion in these weather systems may be important.
The tropical regions of both of the hemispheres’ troposphere exhibit easterly flow called the trade winds. Finally the jet stream – sometimes described as a river of air – flows at mid-latitude of both hemispheres with velocities of 25 to 50 m/sec from west to east, often carrying material completely around the Earth at its altitude close to the tropopause. It is in this flow that balloonists attempt to circle the globe.
7.5.3 Geostrophic Wind
Horizontal motion of the atmosphere, or wind, is a response of the air to the forces that are present. These include the force due to the pressure gradient, the Coriolis force associated with the rotation of the Earth, and frictional forces acting to retard any motion. If the acceleration of the air mass and frictional effects are small, the horizontal velocity is described by the following expression:
This describes the geostrophic wind (f = 2ω sin ϕ, where ω is the angular velocity due to the rotation of the Earth and ϕ is the latitude). The air moves parallel to the isobars (lines of constant pressure). The geostrophic wind blows counterclockwise around low-pressure systems in the northern hemisphere, clockwise in the southern.
At sea level, for 30° N and S, and a pressure gradient of 1 mbar per 100 km(or 1 × 10⁻³ Pa/m), Vg ≈ 15 m/s. In many instances, the observed wind is indeed close to the geostrophic wind and it is often useful to have maps of isobars so that the transport trajectory can be approximated from Vg. For a complete derivation and explanation of the geostrophic wind, departures from it and related topics, the reader is referred to textbooks on meteorology (e.g., Wallace and Hobbs, 1977).
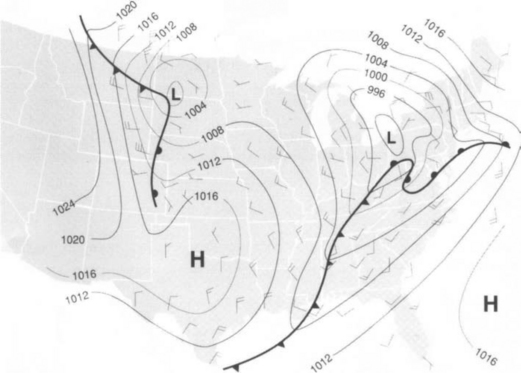
In the mid-latitude region depicted inFig. 7-5, the motion is characterized by “large-scale eddy transport.” Here the “eddies” are recognizable as ordinary high- and low-pressure weather systems, typically about 10 km in horizontal dimension. These eddies actually mix air from the polar regions with air from nearer the equator. At times, air parcels with different water content, different chemical composition and different thermodynamic characteristics are brought into contact. When cold dry air is mixed with warm moist air, clouds and precipitation occur. A frontal system is said to exist. Two such frontal systems are depicted inFig. 7-5 (heavy lines in the midwest and southeast).
7.5.4 Meridional Transport of Water, the ITCZ
Among the consequences of this general circulation are convergent and divergent flows in the surface wind leading to systematic vertical motions, especially those of the Hadley cell in the tropics. Upward motion (such as near the equator in the Hadley cell) often results in the formation of clouds due to adiabatic cooling, while subsidence (downward motion) results in heating and the absence of clouds.Figure 7-6 shows composite satellite photographs depicting the mean brightness of the region from 40° N to 40° S. Clearly evident are the bands of clouds in the intertropical convergence zone (ITCZ) and the clear areas north and south of it. The influence of the land masses on this simplified picture is also apparent, clearly underscoring the difficulties in describing air motions in the vicinity of either topographic roughness or thermal discontinuity. Just at the top and bottom edges of the pictures at latitude 30–40° N or S, the cloudiness of the mid-latitude weather system is apparent. Plate 2 also shows the same features as detected by satellite-borne Lidar.
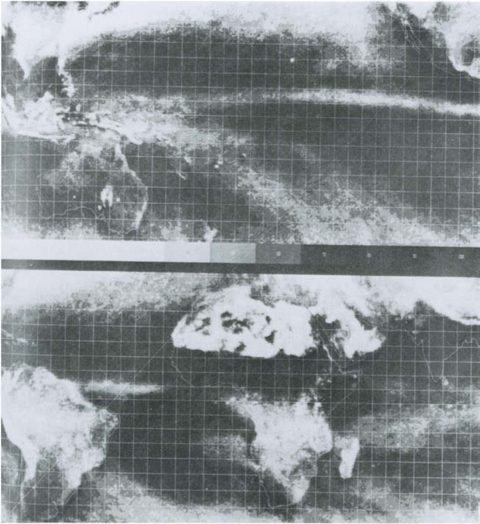
Fig. 7-6 Satellite observations of global reflectivity for January 1967–1970. White indicates areas of persistent cloudiness and relatively high precipitation, except for northern Africa where desert surface regions are highly reflective. (From US Air Force and US Department of Commerce (1971). “Global Atlas of Relative Cloud Cover,” 1967–1970, Washington.)
Figure 7-7 depicts the transport of one substance – water – due to the general circulation. Here we see the overall consequence of the general circulation with its systematic pattern of vertical motions and weather systems. Water evaporates from the oceans and land surfaces at subtropical latitudes and is transported both toward the equator and the poles. Precipitation falls largely at the equator and in the mid-latitudes. Hence, the subtropics are arid, with evaporation exceeding precipitation. The polar regions likewise are arid due to water having been removed in mid-latitude weather systems prior to arrival in the Arctic and Antarctic. A more extensive discussion of factors influencing climate can be found in Chapter 17.
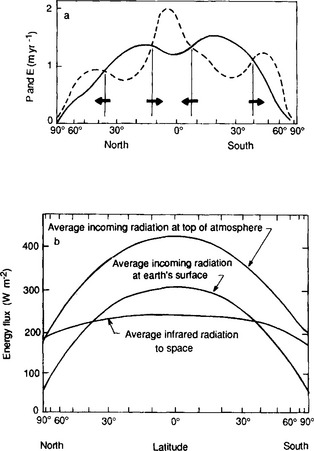
Fig. 7-7 (a) Average annual precipitation (P) and evaporation (E) per unit area versus latitude. Arrows represent the sense of the required water vapor flux in the atmosphere. (b) Incoming solar energy (top of atmosphere and surface) and outgoing terrestrial energy versus latitude.
The turnover time of water vapor in the atmosphere obviously is a function of latitude and altitude. In the equatorial regions, its turnover time in the atmosphere is a few days, while water in the stratosphere has a turnover time of one year or more. Table 7-1 (Junge, 1963) provides an estimate of the average residence time for water vapor for various latitude ranges in the troposphere. Given this simple picture of vertical structure, motion, transport, and diffusion, we can proceed to examine the behavior of reactive trace substances in this dynamic milieu. However, before we can do so, it is useful to briefly summarize the overall composition of the atmosphere.
Table 7-1
Average residence time of water vapor in the atmosphere as function of latitude

aValues extrapolated.
7.6 Composition
Table 7-2 includes most of the main gaseous constituents of the troposphere with observed concentrations. In addition to gaseous species, the condensed phases of the atmosphere (i.e. aerosol particles and clouds) contain numerous other species. The physical characteristics and transformations of the aerosol state will be discussed later inSection 7.10. The list of major gaseous species can be organized in several different ways. In the table, it is in order of decreasing concentration. We can see that there are five approximate categories based simply on concentration:
Table 7-2
Major gaseous constituents of dried air
| Average concentration (volume fraction) | ||
| N2 | Nitrogen | 0.78084 |
| O2 | Oxygen | 0.20946 |
| 40Ar | Argon | 9.34 × 10⁻³ |
| CO2 | Carbon dioxide | 3.7 × 10⁻⁴ |
| Ne | Neon | 1.8 × 10⁻⁵ |
| He | Helium | 5.24 × 10⁻⁶ |
| CH4 | Methane | 1.7 × 10⁻⁶ |
| Kr | Krypton | 1.13 × 10⁻⁶ |
| H2 | Hydrogen | 5 × 10⁻⁷ |
| N2O | Nitrous oxide | 3 × 10⁻⁷ |
| Xe | Xenon | 8.7 × 10⁻⁸ |
| CO | Carbon monoxide | 5–20 × 10−8 |
| OCS | Carbonyl sulfide | 5 × 10⁻¹⁰ |
| O3 | Ozone | |
| Troposphere (clean) | 5 × 10⁻⁸ | |
| Troposphere (polluted) | 4 × 10⁻⁷ | |
| Stratosphere | 1 × 10⁻⁷ to 6 × 10⁻⁶ |
1. The major gases – the concentration often given as a percentage (N2, O2, Ar, H2O, CO2).
2. Those gases having concentrations expressed in the parts-per-million range (Ne, He, CH4, CO).
3. Gases expressed as parts-per-billion (O3, NO, N2O, SO2).
4. Gases in the parts-per-trillion category (CCl2F2, CF4, NH3).
5. Gases expressed in number of atoms or molecules per cubic centimeter –notably radionuclides and free radicals like OH.
Alternatively, we could organize the list by variability in which we would see that N2, O2, and the noble gas concentrations are extremely stable, with increasing variability for substances of low concentration and for chemically reactive substances. Both the temporal and spatial variability are influenced by the same factors: source strength and its variability, sink mechanisms and variability and atmospheric lifetime. Close to sources (such as in a polluted urban setting), variability is likely to be dominated by proximity to and variations of the source. Urban data, for example, often show clearly the influence of temporal features of human activities like automobile traffic. However, when observations are made in more remote settings, sink mechanisms or lifetimes tend to become more evident in determining variability. Junge (1974) posed a hypothesis relating variability to residence time, suggesting that there is a geometric and inverse relationship between the relative standard deviation of concentration and residence time as indicated in Fig. 7-8.

Fig. 7-8 Inverse relationship between relative standard deviation of concentration, σc/c, and residence time, τ, for important trace chemicals in the troposphere. (Modified with permission from C. E. Junge (1974) Residence variability of tropospheric trace gases, Tellus 26, 477–488, Swedish Geophysical Society, Stockholm.).
Focusing on the chemical reactivity, we could list the noble gases, N2 and perhaps O2 as the least reactive. Even though the reaction of N2 and O2 in the presence of H2O is favored thermodynamically, the reaction rate is very slow so these two species do not end up as HNO3 in the oceans. More will be said about this in Chapter 12, on the nitrogen cycle. Reactivity being a rather unspecific term, it seems logical to organize the composition on an element-by-element basis. However, before getting to the major elements (N, S, and C), it is useful to examine H2O as the most variable of the dominant species. In Table 7-2, we deliberately omitted water because of its variability. It can range from ppmv levels in the Antarctic and the stratosphere to several percent in moist tropical air. Thus, it is necessary to reference the concentrations in the table to dry air, or to devise another measure to get around the variability of water. Another scheme would be to present all the average concentrations relative to one of the more constant constituents, e.g., to nitrogen.
7.7 Atmospheric Water and Cloud Microphysics
As discussed in Chapter 6, water forms strong hydrogen bonds and these lead to a number of important features of its atmospheric behavior. All three phases of water exist in the atmosphere, and the condensed phases can exist in equilibrium with the gas phase. The equilibria between these phases is summarized by the phase diagram for water,Fig. 7-9.
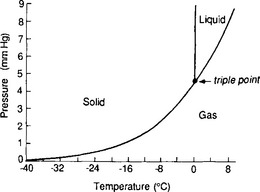
Fig. 7-9 P–T phase diagram for bulk water. (Based on data of the Smithsonian Meteorological Tables.)
We see from this diagram that partial pressures of H2O at ordinary conditions range from very small values to perhaps 30 or 40 mbar. This corresponds to a mass concentration range up to about 25 g H2O/m3. In typical clouds, relatively little of this is in the condensed phase. Liquid water contents in the wettest of cumulus clouds are around a few grams per cubic meter; ordinary mid-latitude stratus clouds have 0.3–1 g/m3.
Water clouds play two key roles in biogeochemical cycles on the Earth:
1. They deliver water from the atmosphere to the Earth’s surface as rain or snow, and are thus a key step in the hydrologic cycle.
2. They scavenge a variety of materials (e.g. nutrients and trace elements) from the air and make them available for delivery in precipitation.
Thus we proceed to examine the physical-chemical nature of the cloud nucleation process.
Only two possibilities exist for explaining the existence of cloud formation in the atmosphere. If there were no particles to act as cloud condensation nuclei (CCN), water would condense into clouds at relative humidities (RH) of around 300%. That is, air can remain supersaturated below 300% with water vapor for long periods of time. If this were to occur, condensation would occur on surface objects and the hydrologic cycle would be very different from what is observed. Thus, a second possibility must be the case; particles are present in the air and act as CCN at much lower RH. These particles must be small enough to have small settling velocity, stay in the air for long periods of time and be lofted to the top of the troposphere by ordinary updrafts of cm/s velocity. Two further possibilities exist – the particles can either be water soluble or insoluble. In order to understand why it is likely that CCN are soluble, we examine the consequences of the effect of curvature on the saturation water pressure of water.
As a result of the high surface free energy of water, the vapor pressure of a water droplet increases with decreasing radius of curvature, r, as deduced by Kelvin:
where Px is the water pressure over a flat surface and σ is the surface free energy (or surface tension). This, combined with vapor pressure depression due to dissolved substances (Raoult’s law), results in a requirement for supersaturation (i.e., RH > 100%) as a condition for the formation of micrometer-sized droplets in clouds or fog. If the amount of soluble material is large, the supersaturation is small, while small soluble particles require higher supersaturation.Figure 7-10 shows the vapor pressure as a function of size for a variety of soluble particle masses.
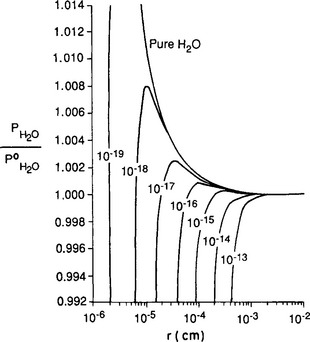
Fig. 7-10 K hler curves calculated for the saturation ratio
 of a water droplet as a function of droplet radius r. The quantity im/M is given as a parameter for each line, where m = mass of dissolved salt, M = molecular mass of the salt, i = number of ions created by each salt molecule in the droplet.
These plots are called Köhler curves after their originator (Köhler, 1936). His assumptions that cloud condensation nuclei (CCN) are water-soluble materials is now widely accepted. In the past, it was often thought that NaCl particles from the ocean were the main CCN; however, more recent studies have demonstrated the frequent dominance of sulfate particles with composition between H2SO4 and (NH4)2SO4. Organic matter, for example the oxidation products of terpenes (from trees) also can act as CCN.
When a droplet reaches the peak of its appropriate curve, due to being in a region of RH greater than the RH for that critical size, it will continue to grow in an uncontrolled fashion. As it gets larger, the curvature effect decreases its vapor pressure and it enters a region of increased supersaturation relative to that at the peak of the Köhler curve. A particle that turns into a droplet and passes the critical size is said to be an activated CCN.
Following growth by condensation, droplets grow further by collision coalescence (colliding mainly due to different fall speeds). Some small amount of precipitation is produced in this fashion, recognizable as drizzle. Larger water particles and heavier precipitation occur when ice is present. Due to the ability of small droplets of liquid water to exist in a supercooled state, most cloud water is liquid. Freezing is thought to occur due to the presence of an ice nucleating aerosol (IN), typically at temperatures of –5 to – 20°C. Since ice has a lower vapor pressure than supercooled water at the same temperature, the ice particles grow at the expense of the droplets. Ice particles that are large enough to fall can subsequently collect larger amounts via collision with droplets with resulting graupel or hail (if the particle remains frozen) or rain (if the ice melts).
The overall rainfall rate and amount depend on these microphysical processes and even more greatly on the initial amount of water vapor present, and on the vertical motions that transport water upward, cool the air, and cause supersaturation to occur in the first place. Thus the delivery of water to the Earth’s surface as one step in the hydrologic cycle is controlled by both microphysical and meteorologic processes. The global average precipitation amounts to about 75 cm/yr or 750 L/(m2 yr).
Cloud nucleation also has chemical consequences. The soluble material of the CCN introduces solute into cloud droplets which, in many instances, is a major and even dominant ingredient of cloud and rainwater. A simple but useful expression for the amount of solute from CCN is
where [X] = the average molarity of the solute X in cloud water; ε = fraction of aerosol particles of X that are activated CCN; MX = molecular weight of X; (X)air = concentration of X in air entering the cloud (g/m3); L = liquid water content of the cloud (L/m2).
As an example, if 5 µg/m2 of sulfate aerosol were present, and ε 1, with L = 1 mL/m2, then [SO4] = 5 × 10⁻⁵ molar. This example is realistic for the industrialized areas such as eastern North America and Europe and for rain in clean marine areas.
In addition to solute from CCN, clouds contain dissolved gases (e.g., SO2, NH3, HCHO, H2O2, HNO3 and many more). In turn some of these may react in the cloud droplets to form other substances which subsequently can appear in rainwater. Finally, falling raindrops can collect other materials (e.g., large dust particles) on their way to the Earth’s surface. Thus, rainwater composition does not uniquely reflect the chemistry of the CCN.
7.8 Trace Atmospheric Constituents
7.8.1 Sulfur Compounds
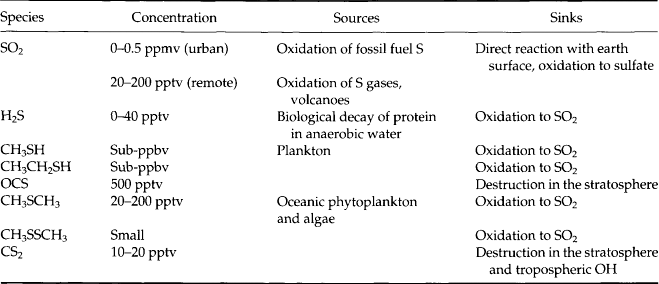
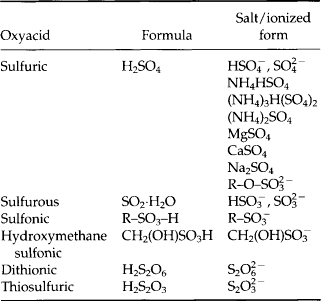
There is a large variety of atmospheric sulfur compounds, in the gas, solid, and liquid phases. Table 7-3 lists a number of gaseous compounds, range of concentration, source, and sink (where known). As this list illustrates, a significant number of these gases contribute to the existence of oxidized sulfur in the forms of SO2 and sulfate aerosol particles. Table 7-4 lists the oxy-acids of sulfur and their ionized forms that could exist in the atmosphere. Of these the sulfates certainly are dominant, with H2SO4 and its products of neutralization with NH3 as the most frequently reported forms.
Table 7-4
Oxyacids, their salts, and ionized forms that could exist in atmospheric aerosol particles
As a result of the water solubility of both SO2 and the sulfates, these compounds are frequently found in or associated with water in a condensed phase. The acidity of H2SO3 (K1 = 1.7 × 10⁻², K2 = 6.2 × 10⁻⁸) can cause low pH in cloud and rainwater, although most measurements indicate that low rain pH is associated with and NO3−. In any case, SO2 and
 removal from air is dominated by precipitation. These points will be amplified and quantified later in Chapter 13 and 16.
There are two dominant stable isotopes of sulfur found in atmospheric sulfur compounds, 32S and 34S. While it is attractive to utilize the ratio of these two for studies of atmospheric processes, source influences or sink mechanisms, no clearcut results have yet been demonstrated. The general features of the S isotope distributions will be summarized in Chapter 13.
7.8.2 Nitrogen Compounds
Like sulfur, nitrogen has stable compounds in a wide range of oxidation states and many of them are found in the atmosphere. Again, both gaseous and particulate forms exist as do a large number of water-soluble compounds. Table 7-5 lists the gaseous forms. The nitrogen cycle is discussed in Chapter 12.
Here we see a range of oxidation states from – 3 to +5. The reduced forms are undoubtedly the most important gaseous bases in air, while the oxides tend to produce HNO3 as one of the two dominant strong atmospheric acids (H2SO4 is the other one).
In particulate form, we find the condensed phase of some of these in the form of salts; as listed in Table 7-6.
7.8.3 Carbon Compounds
Unlike sulfur and nitrogen compounds in air where we found a wide range of oxidation states in relatively few compounds, carbon has a nearly unlimited number of compounds. These compounds fall roughly into two categories: inorganic and organic compounds. The global carbon cycle is discussed in Chapter 11.
7.8.3.1 Elemental carbon
Common soot (also known as black carbon and refractory carbon) appears to contain significant amounts of elemental carbon in the molecular form of graphite, along with organic impurities. All forms of combustion of carbonaceous materials produce some soot, so its presence is ubiquitous in both pristine and polluted regions. The exact composition is variable and dependent on the nature of the source. All soots are, however, characterized by the presence of very small particles (submicrometer) and correspondingly a large ratio of surface area to mass. The graphitic component provides an exceedingly inert physical structure for such particles. Thus, soot particles can be transported large distances. They probably become coated with sulfates and other condensed material by Brownian coagulation, eventually come out of the atmosphere in rain and are eventually sequestered geologically in sediments.
The key features of soot are its chemical inertness, its physical and chemical adsorption properties, and its light absorption. The large surface area coupled with the presence of various organic functional groups allow the adsorption of many different materials onto the surfaces of the particles. This type of sorption occurs both in the aerosol phase and in the aqueous phase once particles are captured by cloud droplets. As a result, complex chemical processes occur on the surface of soot particles, and otherwise volatile species may be scavenged by the soot particles.
7.8.3.2 Carbon oxides
The oxides are gaseous and do not undergo reactions in the atmosphere that produce aerosol particles. Carbon monoxide is a relatively inert material with its main sinks in the atmosphere via reactions with free radicals, e.g.,
Other sinks – largely biological – probably exist at the Earth’s surface. Seiler (1974) deduced a lifetime of ca. 0.5 year for CO, attesting to the lack of reactivity or water solubility in comparison to sulfur and nitrogen compounds.
Carbon dioxide is likewise an inert material. As a result, its only known sinks are photosynthesis and solubility in seawater. The cycle of carbon dioxide through the atmosphere will be a major focal point in Chapter 11.
Besides its inertness, CO2 is modestly water soluble and in aqueous media forms carbonic acid which is a weak acid. Henry’s Law for CO2 states
where KH = 29 atm/(mol L). ( is the sum of H2CO3 and CO2(aq). See Chapter 5.) Thus, 350 ppmv of CO2 results in
 = 10−5 M in otherwise pure H2O, as is often assumed for clouds and rain. Given that K1 = 4.5 × 10⁻⁷ mol/L and K2 = 4.7 × 10⁻¹¹ mol/L for the first and second dissociations of H2CO3, cloud and rainwater affected only by H2CO3 would have a pH of about 5.6. However, other solutes (notably H2SO4) usually dominate the effect of H2CO3, even in pristine locations.
Most CO and CO2 in the atmosphere contain the mass 12 isotope of carbon. However, due to the reaction of cosmic ray neutrons with nitrogen in the upper atmosphere, 14C is produced. Nuclear bomb explosions also produce 14C. The 14C is oxidized, first to 14CO and then to 14CO2 by radicals. As a result, all CO2 in the atmosphere contains some 14C, currently a fraction of ca. 10−12 of all CO2. Since 14C is radioactive (β-emitter, 0.156 MeV, half-life of 5770 years), all atmospheric CO2 is slightly radioactive. Again, since atmospheric CO2 is the carbon source for photosynthesis, all biomass contains 14C and its level of radioactivity can be used to date the age of the biological material.
7.8.3.3 Organic carbon
The remaining carbon compounds fall into the category of organic molecules. The number of identified species is large – at least several hundred – so we cannot produce an exhaustive list here. Instead we will list molecular forms following conventional schemes for organic chemistry with a few selected samples.
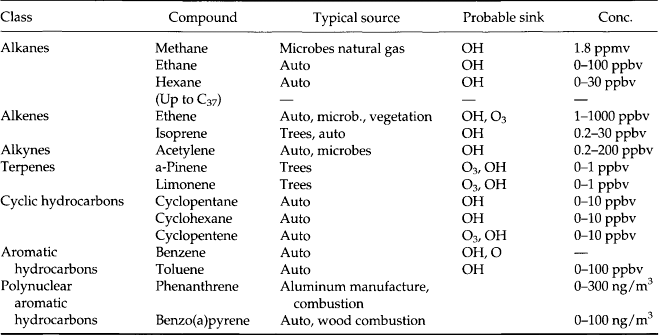
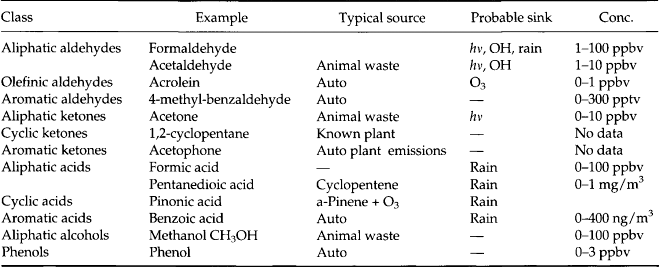
Tables 7-7–7-11 give a sense of the range of organic molecules present in the atmosphere. Both natural sources and human activity contribute to the variety of organic molecules (Graedel, 1978). The sinks often involve in-situ reactions.
7.8.4 Other Trace Elements
The atmosphere may be an important transport medium for many other trace elements. Lead and other metals associated with industrial activity are found in remote ice caps and sediments. The transport of iron in wind-blown soil may provide this nutrient to remote marine areas. There may be phosphorus in the form of phosphine, PH3, although the detection of volatile phosphorus has not been convincingly or extensively reported to date.
7.9 Chemical Interactions of Trace Atmospheric Constituents
Unlike the chemistry of simple mixtures of small numbers of reactants as observed in the laboratory, the chemistry of the atmosphere involves complex interactions of large numbers of species. However, several key aspects of these interactions have been identified that account for major observable properties of the atmospheric chemical system. It is convenient to separate the description into gas phase and condensed phase interactions, not the least because different chemical and physical processes are involved in these two cases.
7.9.1 Gas Phase Interactions
Figure 7-11 and its caption (Crutzen, 1983) depict the most important of the gas phase and photochemical reactions in the atmosphere. Perhaps the single most important interaction involves the hydroxyl free radical, OH. This extremely reactive radical is produced principally from the reactions of electronically excited atomic oxygen, O(1D), with water vapor. Photodissociation of ozone produces O(1D) and also the less reactive O(3P). In the troposphere, O3 is produced largely by photochemical reactions involving still other free radicals, including the nitrogen oxides, NO and NO2.HO. appears to be the dominant oxidant for CO, CH4, SO2, (CH3)2S as well as the main source of HNO3 and HNO2.
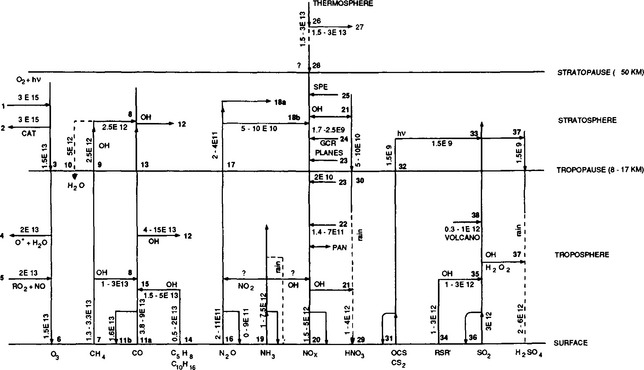
Fig. 7-11 Compilation of the most important photochemical processes in the atmosphere, including estimates of flux rates expressed in moles per year between the earth’s surface and the atmosphere and within the atmosphere. (Modified with permission from P. J. Crutzen, Atmospheric interactions – homogeneous gas reactions of C, N, and S containing compounds. In B. Bolin and R. Cook (1983). “The Major Biogeochemical Cycles and Their Interactions,” pp. 67–112, John Wiley, Chichester.)
7.9.2 Condensed Phase Interactions
Condensed phase interactions can be divided roughly into two further categories; chemical and physical. The latter involves all purely physical processes such as condensation of species of low volatility onto the surfaces of aerosol particles, adsorption, and absorption into liquid cloud and rainwater. Here, the interactions may be quite complex. For example, cloud droplets require a CCN, which in many instances is a particle of sulfate produced from SO2 and gas-particle conversion. If this particle is strongly acidic (as is often the case) HNO3 will not deposit on the aerosol particle; rather, it will be dissolved in liquid water in clouds and rain. Thus, even though HNO3 is not very soluble in
3: Downward flux to troposphere, small difference between 1 and 2
R = H, CH3, etc. From CO and hydrocarbon oxidation, e.g.
6: Ozone destruction at ground; difference between 3, 4, and 5.
7: Release of CH4 at ground by variety of sources with range 1.3–3.3 × 10¹³ mol/yr. 2.5 × 10¹³ with average OH concentration of 6 × 10⁵ molecules/cm3.
9: Flux of CH4 to the stratosphere.
10: Flux of H2O to the troposphere from methane oxidation.
11a: Release of CO from a variety of sources, mostly man-made.
11b: Uptake of CO by microbiological processes in soils.
Global loss of CO of 4–15 × 1013 mol/yr; 7 × 10¹³ calculated with [OH] of 6 × 10⁵ molecules cm−3.Continued on p. 152
15: Isoprene and terpene oxidation to CO following reaction with OH.
16, 17: Release of N2O to atmosphere by variety of sources; no significant sinks of N2O in the troposphere have been discovered; stratospheric loss estimated by model calculations.
19: Release of NH3 by variety of sources to the atmosphere; redeposition at the ground; most ammonia is removed by rain, but some NOx loss and N2O formation may be possible by gas phase reactions.
20: Release of NOx at the ground by a variety of sources – redeposition at the ground.
22: NOx produced from lightning.
23: NOx produced by subsonic aircraft.
24: NOx produced from galactic cosmic rays.
25: NOx from sporadic solar proton events; maximum production recorded in August, 1972: 1 × 10¹⁰ moles produced.
26: NO production by fast photoelectrons in the thermosphere and by auroral activity.
28: Downward flux of NO to the stratosphere; a small difference between 26 and 27 may be important for this.
31, 32: COS destruction in the stratosphere calculated with a model; uptake of COS in the oceans and hydrolysis may imply an atmospheric lifetime of only a few years and a source of a few tens of billions (1010) of moles per year.
34: Release of H2S, CH3SCH3 (DMS), and CH3SH by biological processes in soils and waters.
35: Oxidation of H2S, DMS, and CH3SH to SO2 after initial attack by OH.
36: Industrial release of SO2.
37: SO2 oxidation to H2SO4 on aerosols, in cloud droplets, and by gas phase reactions following attack by OH.
38. Volcanic injections of SO2, averaged over past centuries.
the concentrated H2SO4 of the aerosol particle, the atmospheric residence time of HNO3 is in part determined by the physical role of H2SO4 particles as CCN.
Chemical interactions also occur in the condensed phases. Some of these are expected to be quite complex, e.g., the reactions of free radicals on the surfaces of or within aerosol particles. Simpler sorts of interactions also exist. Perhaps the best understood is the acid-base relationship of NH3 with strong acids in aerosol particles and in liquid water (see Chapter 16). Often, the main strong acid in the atmosphere is H2SO4, and one may consider the nature of the system consisting of H2O (liquid), NH3/ H2SO4, and CO2 under realistic atmospheric conditions. Carbon dioxide is not usually important to the acidity of atmospheric liquid water (Charlson and Rodhe, 1982); the dominant effects are due to NH3 and H2SO4. The sensitivity the pH of cloud (or rainwater produced from it) to NH3 and aerosol acting as CCN in a cloud are discussed further in Chapter 16.
7.10 Physical Transformations of Trace Substances in the Atmosphere
Perhaps because the unpolluted atmosphere can appear to be perfectly free of turbidity, it is not immediately obvious that it is a mixture of solid, gaseous, and liquid phases – even in the absence of clouds. Particles in the aerosol* state constitute only a miniscule portion of the mass of the atmosphere – perhaps 10−9 or 10−10 in unpolluted cases. However, the condensed phases are important intermediates in the cycles of numerous elements, notably ammonia-N, sulfate-S,
* Aerosols are solid or liquid particles, suspended in the liquid state, that have stability to gravitational separation over a period of observation. Slow coagulation by Brownian motion is implied.
fate-S,and organic C. They are also absolutely necessary participants in the hydrologic cyclev (see Sections 7.7 and7.11).
Figure 7-12 depicts the main physical pathways by which aerosol particles are introduced into and removed from the air. Processes that occur within the atmosphere also transform particles as they age and are transported. This form of distribution of mass with size was originally discovered in polluted air in Los Angeles, but it is now known to hold for remote unpolluted locations as well (Whitby and Sverdrup, 1980). In the latter case, the particle sizes of the accumulation mode (see Fig. 7-13) are probably somewhat smaller, perhaps by a factor of two.
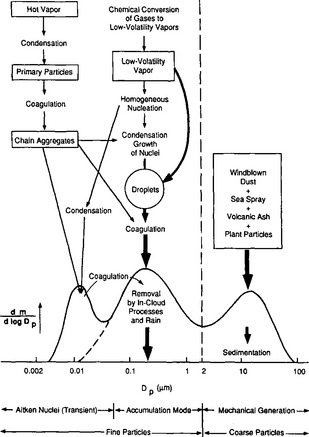
Fig. 7-12 Schematic of an atmospheric aerosol size distribution. This shows the three mass modes, the main sources of mass for each mode, and the principal processes involved in inserting mass into and removing mass from each mode (m = mass concentration, Dp = particle diameter). (Reproduced with permission from K. T. Whitby and G. M. Sverdrup (1983). California aerosols: their physical and chemical characteristics. In “The Character and Origin of Smog Aerosols” (G. M. Hidy, P. K. Mueller, D. Grosjean, B. R. Appel, and J. J. Wesolowski, eds), p. 483, John Wiley, New York.)
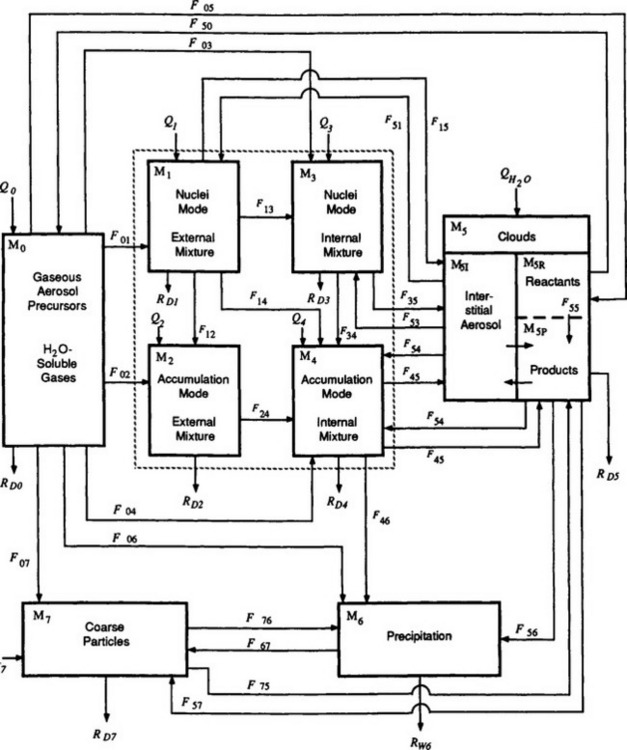
Fig. 7-13 Physical transformations of trace substances in the atmosphere. Each box represents a physically and chemically definable entity. The transformations are given in Fij. The physical transformations are as follows: F01: Production of new nuclei-mode particles; F02: Growth of existing accumulation-mode particles by the deposition of products of chemical reactions; F03: Growth of pre-existing nuclei-mode particles, as in F02; F04: Growth of internally mixed accumulation mode, as in F02; F05: Dissolution of gaseous reactants in cloud drops; F50: Reverse of F05 evaporation or gaseous exchange or both; F06: Below-cloud scavenging of gaseous reactants or reactant products; F07: Interaction of gases with coarse particles, e.g., HNO(g) + seasalt → coarse mode ; F12: Brownian coagulation of nuclei-mode particles with themselves to produce accumulation-size (chemically) externally mixed particles; F13: Adsorption, condensation; F14: Coagulation; F15: Cloud formation yielding nuclei-mode interstitial aerosol, coagulation with cloud droplets, or (unlikely) activation as a cloud condensation nuclei (CCN); F51: Cloud evaporation releasing interstitial aerosol; F57: Cloud evaporation releasing coarse particles; F24: Adsorption, coagulation, condensation; F34: Adsorption, coagulation, condensation; F35: Cloud formation, as in F15; F53: Cloud evaporation, as in F51; F45: Cloud formation, likely to be CCN; F54: Cloud evaporation, releasing CCN; F55: Reactants in cloud water producing changes in solute mass; F46: Below-cloud scavenging; F56: Formation of precipitation; F67: Evaporation of precipitation particles (raindrops) before reaching ground; F75: Coarse particles acting as CCN; F76: Below-cloud scavenging of coarse-mode particles; RD5: Occult precipitation (deposition of cloud droplets directly to the Earth’s surface, trees, etc.) (from the ith to the jth box). Qi represents sources contributing to the mass or burden, Mi, in the ith box. RDi and RWi are dry and wet removals from Mi. The dashed box represents what may be called the fine-particle aerosol and could be a single box instead of the set of four sub-boxes (i = 1, 2, 3, 4) (Reproduced with permission from R. J. Charlson, W. L. Chameides, and D. Kley (1985). The transformations of sulfur and nitrogen in the remote atmosphere. In “The Biogeochemical Cycling of Sulfur and Nitrogen in the Remote Atmosphere” (J. N. Galloway, R. J. Charlson, M. O. Andreae and H. Rodhe, eds), pp. 67–80, D. Reidel Publishing Company, Dordrecht.)
Much of the fine particle aerosol is produced in the atmosphere by chemical reactions of gaseous precursors. Following the formation of very small nuclei (diameter less than about 0.1 µm) by chemical processes (e.g. the oxidation of SO2 to H2SO4), the physical process of Brownian coagulation and deposition of additional reaction condensates cause the mass of nuclei to move up to dry diameters of 0.1–1.0 µm. The fine particle aerosol is thus composed of nuclei and larger conglomerates of material that has been accumulated. This is commonly called the accumulation mode. In addition, a coarse particle aerosol also exists, largely comprising seasalt and soil dust of surface derivation, with diameters larger than ca. 1 µm. Except in cloud droplets, there is limited chemical contact between the coarse mode and the accumulation mode.
Because the particles in the accumulation mode are very small (most of them have diameters less than 1 µm when dry), they have very small fall speeds (a 1 µm sphere of unit density has a fall speed of about 10−2 cm/s). Thus, they are only removed in any quantity by the formation of clouds with subsequent precipitation.
This brief description leads toFig. 7-13 which depicts the physical transformations of trace substances that occur in the atmosphere. These physical transformations can be compared to the respective chemical transformations within the context of the individual elemental cycles (e.g., sulfur). This comparison suggests that the overall lifetime of some species in the atmosphere can be governed by the chemical reaction rates, while others are governed by these physical processes.
7.11 Influence of Atmospheric Composition on Climate
7.11.1 CO2
Climate may be defined as the aggregate of all physical atmospheric properties and conditions. As such, it is absolutely clear that the chemical
composition of the atmosphere as well as the physical characteristics of condensed phase trace species are of leading importance as determinants of climate. A well-known example is the increase in the temperature of the Earth’s surface due to the absorption of infrared radiation from the Earth’s surface by CO2 in the air. (See the box describing the greenhouse effect.) Without CO2 the Earth’s surface would be several degrees cooler than at present, depending on cloud cover, water vapor, and other controlling factors. Of course, there is substantial concern over the secular increase of CO2, which will double from its pre-industrial level by the early to mid-21st century.
7.11.2 Other “Greenhouse Gases”
Carbon dioxide is not the only gas that can influence terrestrial infrared radiation, and infrared absorption is not the only way that composition influences climate. Other gases that are important for their infrared absorption, sometimes known as “greenhouse gases,” include CH4, CCl2F2 (CFC-12), CFCl3 (CFC-11), N2O, and O3. Taken together these other species are about of equal importance to CO2. That some of these have increased dramatically due to human activities (the chlorofluorocarbons are only synthesized by man) or are increasing due to unknown causes (e.g., CH4) suggests that the overall problem involves much more than just understanding or predicting CO2.
7.11.3 Particles and Clouds
The condensed phases also are important to the physical processes of the atmosphere; however, their role in climate poses an almost entirely open set of scientific questions. The highest sensitivity of physical processes to atmospheric composition lies within the process of cloud nucleation. In turn, the albedo (or reflectivity for solar light) of clouds is sensitive to the number population and properties of CCN (Twomey, 1977). At this time, it appears impossible to predict how much the temperature of the Earth might be expected to increase (or decrease in some places) due to known changes in the concentrations of gases because aerosol and cloud effects cannot yet be predicted. In addition, since secular trends in the appropriate aerosol properties are not monitored very extensively there is no way to know
the degree to which changes have occurred, e.g., due to human activity.
7.12 Chemical Processes and Exchanges at the Lower and Upper Boundaries of the Atmosphere
7.12.1 CO2, Photosynthesis, and Nutrient Exchange
The atmosphere, as a single body of gas, is in physical contact with the entire surface of the Earth. It extends upward toward space, with density decreasing by roughly a factor of 10 every 16 km. Some processes of importance to geochemistry occur at the lower and upper boundaries. Evaporation of water from the Earth’s surface is the first big step in the hydrologic cycle of the atmosphere. Indeed, this flux of water into and out of the atmosphere represents its largest flux and most massive cycle, as discussed in Chapter 6. Next is the exchange of CO2 from the atmosphere to the biosphere via photosynthesis, with the return flow of CO2 to the atmosphere via respiration, decay, and combustion. Many other trace substances also exchange through the biosphere in natural processes that occur at the Earth’s surface, notably nitrogen and sulfur species.
7.12.2 Reactions at the Surface
Another major process at the Earth’s surface not involving rapid exchange is the chemical weathering of rocks and dissolution of exposed minerals. In some instances the key weathering reactant is H3O+ in rainwater (often associated with the atmospheric sulfur cycle), while in other cases H3O+ comes from high concentrations of CO2, e.g., in vegetated soils.
Numerous atmospheric species react with the Earth’s surface, mostly in ways that are not yet chemically described. The dissolution and reaction of SO2 with the sea surface, with the aqueous phase inside of living organisms or with basic soils is one example. Removal of this sort from the atmosphere usually is called dry removal to distinguish it from removal by rain or snow. In this case, the removal flux is often empirically described by a deposition velocity, Vdep:
where F = the flux per unit area and time in appropriate units; C = concentration in the atmosphere, in units to match that of the flux.
At the Earth’s surface, Vdep for many reactive species (e.g. SO2, NO2, O3, HNO3, etc.) is of the order of 1 cm/s.
7.12.3 Cosmic-Ray-Induced Nuclear Reactions
At the top of the atmosphere, more properly at altitudes where the density is sufficiently low, high-energy cosmic ray particles cause nuclear chemical reactions with important products. The production of radioactive 14C (or radiocarbon) already has been mentioned.
Other radioisotopes known to be produced by cosmic rays include 10Be, 3H, 22Na, 35S, 7Be, 33P, and 32P. Of these 35S, 7Be, 32P, and 33P have activities that are high enough to be measured in rainwater. In several instances, notably C and 7Be, these radioactive elements are useful as tracers.
7.12.4 Escape of H and He
As mentioned at the beginning of this chapter, diffusive separation of low atomic or molecular weight species into space causes them to be permanently lost from the Earth. Thus, the Earth is deficient in He and H2 relative to the best estimates of initial terrestrial composition. Some species might be accreted from space; certainly, micrometeorites represent a small but identifiable flux. Published speculations exist regarding other substances, notably water. However, these would appear to be relatively unimportant at present.
Chapman, S. On ozone and atomic oxygen in the upper atmosphere. Phil. Mag. S. 7. 1930; 10(64):369–383.
Charlson, R. J., Rodhe, H. Factors influencing the natural acidity of rainwater. Nature. 1982; 295:683.
Scope 21 Crutzen, P. J. Atmospheric interactions — homogeneous gas reactions of C, N and S containing compounds. In: Bolin B., Cook R., eds. The Major Biogeochemical Cycles and Their Interactions. Paris: Wiley, 1983.
Goody, R. M., Walker, J. C. G. Atmospheres. Chichester: Prentice-Hall; 1972.
Goody, R. M., Yung, Y. L. Atmospheric Radiation. Englewood Cliffs, NJ: Oxford University Press; 1989.
Graedel, T. E. Chemical Compounds in the Atmosphere. New York: Academic Press; 1978.
Intergovernmental Panel on Climate Change (IPCC), Climate Change 1995. The Science of Climate Change. Houghton, J. T. Filho, L. G. M. Calander, B. A. Harris, N. Kattenberg, A. Maskell, K. . Cambridge University Press, New York, 1995.
Junge, C. E. Air Chemistry and Radioactivity. Cambridge: Academic Press; 1963.
Junge, C. E. Residence variability of tropospheric trace gases. Tellus. 1974; 26:477–488.
Kent, G. S., Osborn, M. T., Trepte, C. R., Skeens, K. M., LITE measurements of aerosols in the stratosphere and upper troposphereAnsmann A., Neuber R., Rairoux P., Wandinger U., eds. Advances in Atmosphereic Remote Sensing with Lidar, Selected Papers of the 18th International Laser Radar Conference (ILRC). Berlin, 22–26 July, 1996. 1997:157–160.
Köhler, H. The nucleus in and the growth of hygroscopic droplets. Trans. Faraday Soc. 1936; 32:1152.
Ramanathan, V., Cicerone, R. J., Singh, H. B., Kiehl, J. T. Trace gas trends and their potential role in climate change. J. Geophys. Res. 1985; 90:5547–5566.
Seiler, W. The cycle of atmospheric CO. Tellus. 1974; 26:116–135.
Twomey, S. Atmospheric Aerosols. New York: Elsevier; 1977.
Wallace, J. M., Hobbs, P. V. Atmospheric Sciences: An Introductory Survey. Amsterdam: Academic Press; 1977.
Wayne, R. P. Chemistry of Atmospheres. New York: Clarendon Press; 1985.
Whitby, K. T., Sverdrup, G. M. California aerosols: their physical and chemical characteristics. In: Hidy G. M., et al, eds. The Character and Origins of Smog Aerosols. Oxford: Wiley, 1980.


 –9.8 K/km is unstable. The 9.8 K/km figure then provides a simple benchmark for static stability of dry air.


