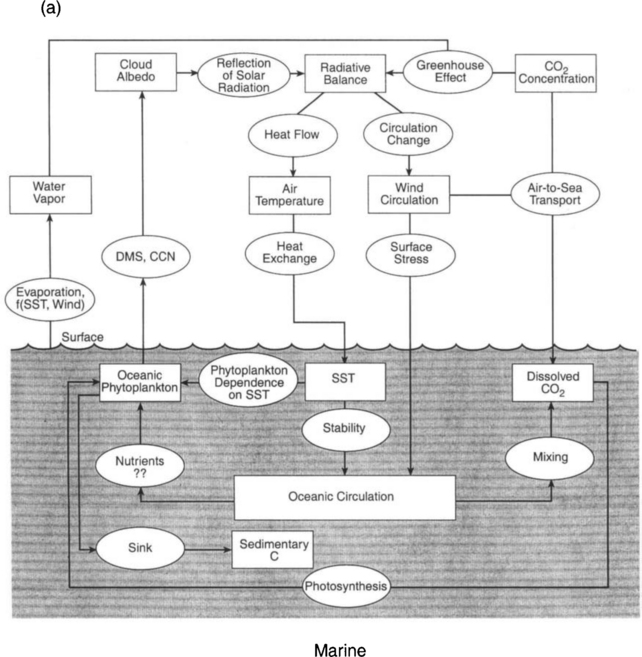
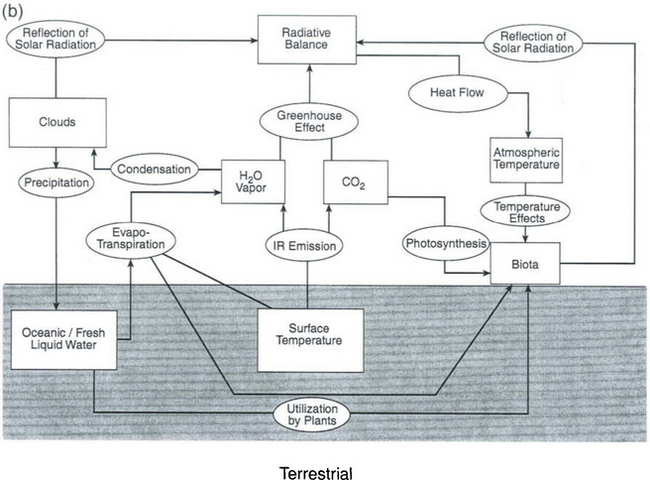
The Coupling of Biogeochemical Cycles and Climate: Forcings, Feedbacks, and Responses
17.1 The Climate System
The word climate is used loosely to mean the aggregate of all components of weather averaged over a lengthy period – usually decades, centuries, or longer. As discussed earlier in Chapters 1 and 7, all processes that contribute to the current climate are driven by the flow of energy from the sun. On very long time scales, the Earth’s internal energy plays a role via its influence on tectonics and the size and location of the continents. Because the Earth absorbs some of the solar energy that it receives, and because over time scales of years to decades the heat balance of the Earth is in a steady state, the Stefan–Boltzmann equation can be used to define the global-mean or effective temperature of the Earth:
where Re is the radius of the Earth, A is its albedo (reflectivity for sunlight), S0 is the solar flux, σ is the Stefan–Boltzmann constant, and Te is the temperature of the planet as seen radiatively from space. Emissivity, ε, is generally assumed to be unity (i.e., a black body), the surface of which is composed largely of the effective infrared emitter, H2O. Since A ≈ 0.3 (controlled mainly by clouds!) and S0 = 1370 W/m2 we can write
where s is the mean flux absorbed by the Earth (s ≈ 240 W/m2). For this steady state to be met, Te = 255 K, which is well below the freezing point of water and well below the current global mean surface temperature of ca. 288 K. This temperature really does exist at a level high in the atmosphere from which the emitted flux emerges, which is around 6 km. This ca. 6 km level is an effective average over the entire emission spectrum, and includes an emission height of zero (i.e., at the surface) for the 8–11 µm infrared window region and the height of the tropopause for other wavelengths. The primary reason that the Earth emits from such a high altitude in the atmosphere is that the atmosphere below that height strongly absorbs the infrared radiation characteristic of a low-temperature (250–300 K) black body such that emissions from lower altitudes are absorbed in the atmosphere and cannot escape directly to space. These concepts form the basis for the so-called greenhouse effect, already described qualitatively in Chapter 7. Figure 17-1 depicts the processes involved in the radiation balance.
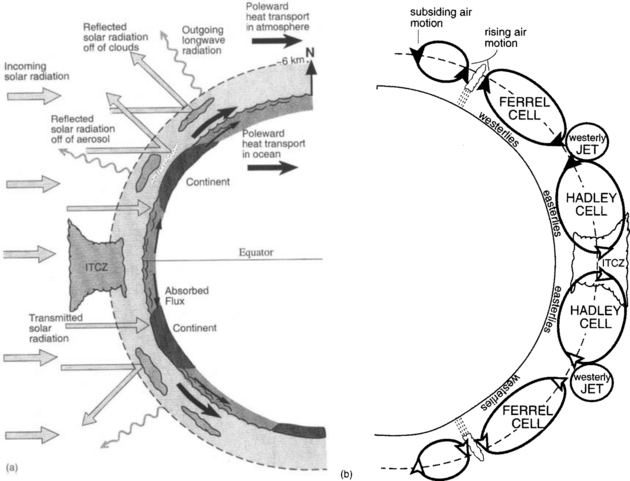
Fig. 17-1 The global climate system. (a) Energy fluxes, including incoming solar radiation, reflected radiation, emitted longwave radiation, and atmospheric and oceanic heat flux toward the polar regions. (b) The atmospheric circulation corresponding to part (a). Refer back to Fig. 7-4 and associated text for a discussion of the general circulation. (from an effective altitude of ca. 6 km)
1. The chemical composition of the atmosphere controls the absorptivity and emissivity for infrared or long-wave radiation. Hence, the presence in the air of H2O, CO2, CH4, and other strong absorbers becomes a key factor in climate. And, since these gases are participants in biogeochemical cycles, one large aspect of the coupling becomes apparent; they are connected via the greenhouse effect.
2. Heat transfer processes besides pure radiative transfer are involved in control of the temperature of the air, especially below the effective emission height of ∼ 6 km. Referring back to Chapter 7, we see that vertical motions of air in the troposphere are a main factor dictating that temperature decreases as altitude increases – air loses internal energy as it gains altitude and potential energy. The global-mean lapse rate (–dT/dz) is 6.5 K/km. Thus the average temperature of the Earth’s surface is ∼288 K given that the temperature at ca. 6 km is 255 K.
17.1.1 Recognizing the Fundamental Processes
These two points taken together illustrate that the temperature at the Earth’s surface depends on both a radiative balance and all of the meteorologic processes that transport heat within the lower atmosphere and of course, all the oceanographic factors that transport heat in the ocean as well. So, at this juncture we must abandon the simple picture of a global-mean radiative heat balance and recognize that in addition, the climate of the Earth is not horizontally uniform, nor is it inherently stable. Any combination of cloud contribution to global albedo and meteorological processes that results in a radiative balance at some range of heights within the atmosphere can yield a steady-state heat balance. This implies that the surface temperature and its geographical distribution (dependent variables) are also not inherently stable.
Central to understanding climate, its variability and its geographical characteristics are the specific roles of the atmospheric and oceanic processes that distribute the energy absorbed from solar radiation. These processes generally move energy from low to high latitude and from the surface to higher altitude where radiation to space can occur. The main transports are (1) the vertical and horizontal atmospheric flux of sensible heat or enthalpy, (2) transport of heat by ocean currents, (3) the transfer of sensible heat to latent heat in the process of evaporation of water, (4) the release of latent heat as sensible heat by formation of clouds, and (5) very importantly, the formation of clouds that control the albedo of the planet and the distribution and amount of solar energy absorbed. A schematic of these processes is shown in Fig. 17-1.
17.1.2 Climate Models
The processes listed above that transfer energy reaching the Earth as solar radiation, convert it to heat, and send it back to space behave as a linked system. Figure 17-2 illustrates this web of interactions of the processes that are described in typical atmospheric models. An even more complex picture would emerge if the oceans were included, and of course many more details have to be added in order to include the biosphere. Refer back to Fig. 4-14 for a schematic representation of the components of a global climate model. This diagram shows the main sets of equations that are used and the main heat exchanges. Note especially that both Figs 17-2 and 4-13 derive from modeling approaches that emphasize a physical approach to climate modeling, i.e., they include no chemistry or biology. Figure 17-3a,b extends this picture to include the biological and industrial exchanges with the atmosphere of a few key substances – notably greenhouse gases, aerosols, and their influences on clouds.
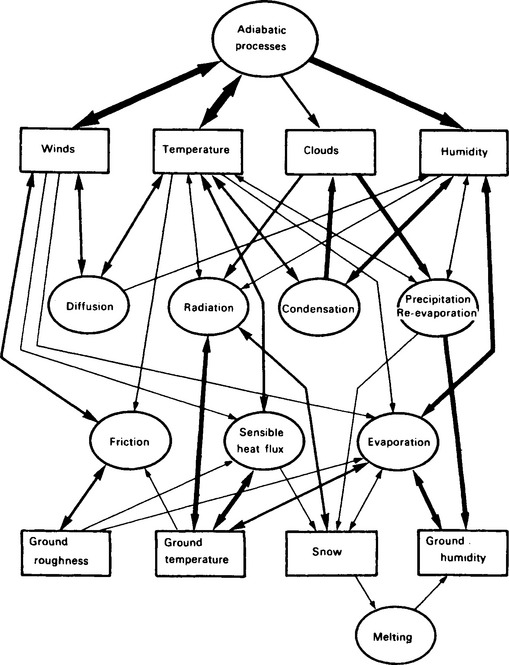
Fig. 17-2 The web of interactions in the atmospheric part of the global climate system. The strength of the interactions is qualitatively depicted by the thickness of the line. Bidirectional interactions have two arrowheads, unidirectional ones have only one. (From Houghton (1984), reprinted with permission from Cambridge University Press.)
17.1.3 The Coupled System
Keeping in mind the entire set of components in the climate system as depicted in Figs 17-2, 4-13, and 17-3, we can now re-examine Fig. 1-2 to emphasize that biogeochemical cycles are coupled with the climate system. The temperature (as inferred from the record of the deuterium to hydrogen ratio in Antarctic ice) covaries with CO2, CH4 and other species that derive from biological processes. Two simple, if extreme, possibilities can be drawn:
1. Changes in physical climate cause changes in biological activity, but not vice versa; or
2. biological activities drive the climate.
The range of possibilities in between these two extremes would be:
3. 3. The biosphere and its processes are an integral part of the physical climate system and are coupled to and have influenced changes in climate.
It is scenario 3 that is most consistent with the data depicted in Fig. 1-2. Given that the physical climate system is strongly influenced by gases in the atmosphere that absorb and emit infrared radiation (e.g., H2O, CO2, CH4, etc.), and since the amounts of these species in the air depend to some extent (for some, a great extent) on the functioning of the biosphere, it is logical to view the climate of the Earth as a coupled physical, chemical, and biological entity.
Taken together, Figs 17-2, 4-13, 17-3, and 1-2 constitute a complex image of the Earth’s climate system, including most of the factors that are known to be involved. However, such diagrams fail to adequately represent the dynamical nature of the totality of interactions of all of the parts. In order to explore these interactions, the natural variability of climate, and changes due to external perturbations, we must now introduce the key notions of forcings, feedbacks, and responses.
17.2 The Dynamics of the Climate System: Forcings, Feedbacks, and Responses
The actual workings of the coupled biogeochemical and physical climate system, the ways that it responds to external perturbations, and the ways that it approaches or departs from a steady-state depend on myriad functional relationships between all the factors that are involved. The daunting complexity of the interwoven web of interactions might seem to preclude any understanding of the whole system, suggesting instead reductionist study of the pieces. However, looking again at Fig. 1-2 we
see that the Earth has had stable, interglacial climates several times, as well as ice ages. The ice-core record indicates that for the duration of the record, the temperatures of the interglacial times were very similar, and the current interglacial time has been remarkably stable for about 10 000 years. The question then arises as to what allows this complex system to be stable? Why is it not subject to continuous, wild, chaotic swings among all the possible climatic states?
In an effort to answer such questions, we turn to another branch of natural sciences that has evolved from consideration of the overwhelming complexity of the functioning of living organisms. Physiology and its various branches (human physiology, plant physiology, etc.) view organisms as functioning systems, indeed systems that have stable steady states. As is well known to design engineers of complex systems like electronic devices or airplanes, such stabilityis achieved using feedbacks,. A prime example is the body temperatures of normal humans – it is nearly constant at 37°C thanks to biochemical feedbacks generated by the hypothalamus gland. Similarly, temperature inside a house is regulated by a thermostat that provides feedback – it turns off the furnace when the temperature rises above a set point. What, then, might provide thermostasis for a planet?
17.2.1 Definitions
17.2.1.1 Forcings
In order to understand the stable states of complex systems, it is useful to understand how the system responds to external perturbations. Externally imposed changes in the energy balance of the planet are referred to as forcings,given in watts per square meter (W/m2). A change in solar luminosity would be an example of a forcing, and indeed the solar flux is calculated to have increased by ca. 30% over the last 4.5 × 10⁹ years. Small variations in the solar flux also occur because of systematic variations in the Earth’s orbit and tilt on timescale of 104–105 years, often referred to as the Milankovich effect. Other forcings exist that also are external to the climate system such as the change in planetary albedo due to volcanic dust being injected into the stratosphere from large eruptions. Anthropogenic (human-induced) changes in heat balance are also considered to be external to the climate system and thus are also forcings.
17.2.1.2 Feedbacks and responses
Changes in the physical characteristics of the Earth that are internal to the climate system can participate in feedback processes. A simple example of a feedback will serve to illustrate their nature: if increased concentrations of CO2 causes T to increase, the vapor pressure of water will increase where evaporation occurs and the water content of the atmosphere will also increase. The net result is a further increase of the total content of greenhouse gases (inasmuch as H2O vapor is a powerful greenhouse gas), which amplifies the initial warming caused by CO2 increase. This defines an amplifying (or positive) feedback.
The nature of such processes can be depicted as a feedback loop, as shown in Fig. 17-4. Using the nomenclature in this figure and continuing with enhanced evaporation of water vapor as our physical example of a feedback that is completely internal to the climate system, we have additional heating (ΔQF) caused by the additional greenhouse effect of the increased water vapor concentration in the atmosphere. The evaporation was caused by the original forcing, ΔQ. In this case, E, the physical effect, is the increased water vapor and F, the resultant feedback that causes ΔQF, is the greenhouse effect of the added water vapor. The reader desiring a more thorough mathematical treatment of feedbacks should consult an appropriate text, e.g., Peixoto and Oort (1992).
While most climate models consider feedbacks as being dependent on temperature (usually Ts), there are many other dependent variables in the climate system that could be involved, for example solar irradiance at the ground or rainfall. However, it is customary to describe these mathematically as functions of Ts,
Where: E = the physical result of the gain operating on ΔQ + ΔQF
ΔQF = effective additional forcing due to feedback (can be positive or negative)
G = gain. In this simple climate system G has units K (W m−2)−1
ΔTF = temperature response with feedback, K.
ΔTF=0 = temperature response with no feedback, K.
leaving surface temperature as the conventional single index of climate.
It is important to keep in mind the separation of forcings, feedbacks, and responses. Considerable progress in climate research has been made in recent years by making this separation, which was first suggested by Dickinson and Cicerone (1986), in recognition of the fact that forcings can be calculated with more confidence than responses. There is a fundamental dilemma, however, in defining forcings: should they be defined before the system has responded or afterwards? While there is some ambiguity extant in the practices of the climate modeling community, the easiest way to define forcings as being separate from feedbacks is to define forcings as partial derivatives, i.e. with all other parameters held constant. For example, for a forcing agent x (like ΔCO2, ΔCH4, etc.), forcing becomes the integral of the partial derivative of heat balance with respect to the change in x, assuming all other factors are held constant:
Responses clearly include the changes in any and all dependent climate variables that occur due to the sum total effect of forcings and feedbacks. Again, just as is the case in defining feedbacks, ΔTs is the conventional single index of response. Thus having defined forcings (ΔQ, in W/m2), feedbacks, and responses (ΔTs, in K) we can discuss the nature and magnitude of forcings and feedbacks in turn.
17.3 Forcings of Climate
17.3.1 Natural Forcings
The simplest forcing to define and describe – although by no means easy to quantify – is the change or variability of the so-called solar constant. The IPCC (1990, 1995, 1996) provides several estimates of this forcing, e.g.,
Another class of natural forcings derives from the global (or near global) increase in albedo caused by dust and other aerosol substances lofted into the stratosphere by large volcanoes. Such events are extremely sporadic, and there is no indication of a secular trend over the last century. Individual volcanic events such as Krakatoa in 1883 or more recently, Pinatubo in 1991, caused measurable global cooling while the aerosol remained in the stratosphere (2–3 years total). Large-scale (hemispheric to global) decreases in surface temperature of ∼0.5 K are well documented, although the forcings were measured for only one case, Pinatubo. The latter averaged ca. –1.5 W/m2 for the period mid-1991–1993 with a peak of ca. –3 W/m2, as observed by satellite radiometers. It is important to recognize that the correlation of cooling with measured negative forcings supports the notion that climate (i.e., Ts) responds to forcing; however, because the volcanic events are short in duration (1–3 years) a full response of the climate system cannot develop. For example, ocean circulations cannot fully respond in less than a decade or decades, so volcanic perturbation cannot provide a complete measure of climate sensitivity. Nonetheless, the apparent sensitivity of ca. 0.3 K/(W/m2) does give a sense of the rough magnitude of responses to be expected from other forcings, assuming that the entire climatic state does not change.
17.3.2 Anthropogenic Forcings
17.3.2.1 Greenhouse gases
The activities of humans, most importantly the combustion of fossil fuels and biomass, produce quantities of gases that absorb and emit infrared radiation – the so-called greenhouse gases – as well as aerosol particles that reflect and absorb solar radiation, absorb some infrared radiation and also are involved in cloud microphysics. The greenhouse gases are by far the best understood, while direct aerosol effects (scattering and absorption of sunlight) are quantified but uncertain. Indirect aerosol effects on clouds are not yet quantified in any convincing way.
The effects of different greenhouse gases vary greatly depending upon their individual infrared absorption spectra, how those spectra overlap with the absorption of other species (especially H2O) and how much absorption by each of those gases existed naturally before the anthropogenic increases began. Table 17-1 provides algebraic expressions that were determined through detailed studies of infrared spectra (shown in Fig. 17-5) for relating the forcing by each gaseous species to its change in concentration. It is critically important to recognize that the dependence of forcing on changed CO2 levels is much weaker per molecule than for other species, e.g., CFC-11 or CFC-12. These manmade chemicals absorb infrared radiation in a part of the spectrum where water vapor and CO2 do not already have strong bands. On the other hand, the manmade increase of CO2 is so large (currently ca. 25% since the mid-1800s – see Chapter 11) that it is the largest anthropogenic input to the greenhouse effect (not counting feedbacks).
Table 17-1
Expressions used to derive radiative forcing for past trends and future scenarios of greenhouse concentrations (IPCC, 1990)
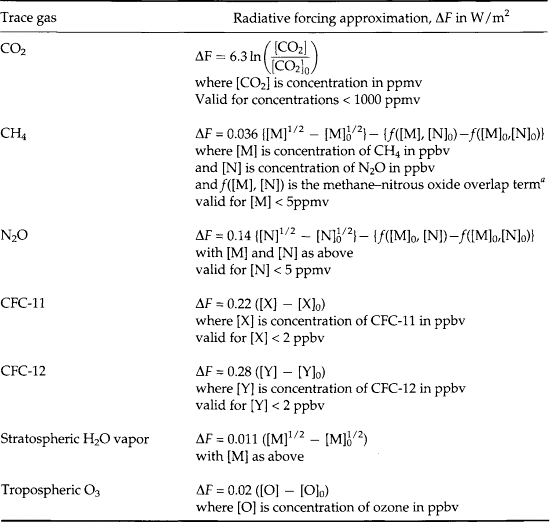
af([M],[N]) = 0.47 ln [1 + 2.01 × 10⁻⁵ ([M][N] 0.75 + 5.31 × 10⁻¹⁵ [M] ([M][N])1.52, with [M] and [N] in ppbv.
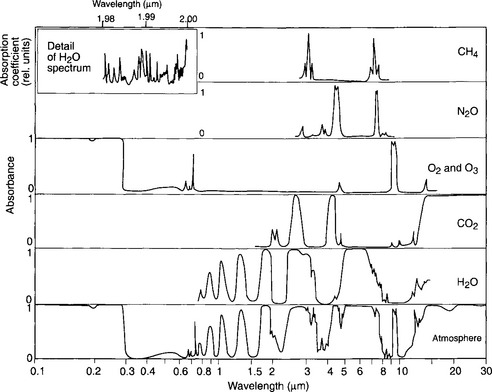
Fig. 17-5 Absorption spectra for H2O, CO2, O2, N2O, CH4, and the absorption spectrum of the atmosphere. (Reprinted from Fleagle and Businger, 1963.)
Table 17-2 summarizes the estimates of global-mean climate forcing by greenhouse gases in ca. 1995, and a “business as usual” forecast by IPCC (1995) for the year 2025. While these figures are useful for comparing the forcings by the different greenhouse gas species, it is somewhat misleading to utilize a single global-mean value because the forcings are not geographically uniform.
Table 17-2
Current and projected global-mean anthropogenic greenhouse forcing, W/m2
| Greenhouse gas | 1995 | 2025 |
| CO2 | 1.5 | 2.9 |
| CH4 | 0.4 | 0.7 |
| N2O | 0.1 | 0.2 |
| Chlorofluorocarbons | 0.3 | 0.5 |
| Total | 2.3 | 4.6 |
Figure 17-6 is a model-calculated map of the anthropogenic greenhouse forcing around 1990 (after Kiehl and Briegleb, 1993). This figure reveals an important feature of the global-change picture. Even though the gases themselves are almost perfectly well mixed throughout the atmosphere, their forcings are not uniform. The causes of this apparent paradox are twofold – first, the forcing by the key gases (CO2, CH4, N2O, etc.) depend on the water vapor content and the cloud amount since there are overlaps of the spectral features of the gases with those of H2O vapor and liquid (see Fig. 17-5 for IR spectra of greenhouse gases.) Thus, where it is moist (e.g., in some parts of the tropics), changes in greenhouse gases are somewhat less effective than where it is dry (e.g., over subtropical deserts). Second, the magnitude of the greenhouse forcing is a strong function of the upwelling flux of infrared radiation from the surface, the integral of which is proportional to Ts4. Because Ts in the tropics and subtropics is around 300–310 K and in a cold place like the Antarctic plateau Ts is only 220–230 K, the amount of the infrared flux that is absorbed is much greater where it is hot at the surface than where it is cold.
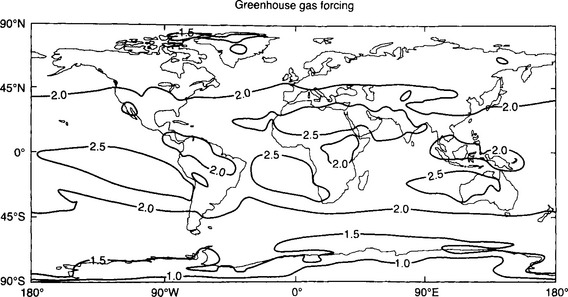
Fig. 17-6 Calculated geographical distribution of the climate forcing (W/m2) by anthropogenic greenhouse gases alone, from pre-industrial periods to ca. 1990. See text for interpretation. From IPCC (1995), after Kiehl and Briegleb (1993). (Reprinted by permission from IPCC.)
17.3.2.2 Aerosols
Aerosol particles – the visible haze in polluted air – reflect and absorb sunlight, directly influencing the heat balance over large (≥1000 km)
regions. They also indirectly influence the albedo and perhaps the lifetime of clouds through their action as cloud condensation nuclei. Many types of anthropogenic aerosols are implicated, especially sulfates from the atmospheric oxidation of SO2, condensed organic matter from biomass combustion, black carbon or soot from all kinds of combustion of carbon-based fuels, and dust from disturbed soils. Figure 17-7 shows the model calculated geographical distribution of direct forcing by one type of aerosol – anthropogenic sulfates.
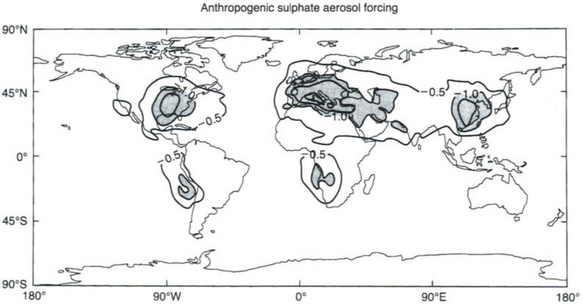
Fig. 17-7 Calculated geographical distribution of the direct climate forcing (W/m2) by one anthropogenic aerosol component, sulfates, from pre-industrial periods to ca. 1990. (Reprinted with permission from IPCC, 1995.)
Figure 17-8 summarizes and compares the anthropogenic and natural forcings for the period 1800–1990, showing the complex nature of the issue of anthropogenic climate forcing.
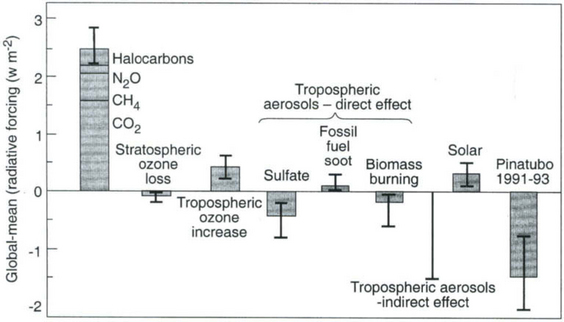
Fig. 17-8 A comparison of global-mean forcing by a variety of anthropogenic agents from pre-industrial periods to ca. 1990, compared to the measured forcing by the aerosol from the June 1991 eruption of Mt. Pinatubo. Shown are approximate averages for June 1991–1993. Peak forcing was ca. – 2.7 ± 1 W/m2 in August and September 1991 averaged over latitudes from ±40°. Caution is advised in comparing global means because of geographical non-uniformities (see Figs 17-6 and 17-7). (Adapted from data in IPCC, 1996.)
17.4 Feedbacks
We have already posed the hypothesis based on Fig. 1-2 that climate is stabilized by negative feedbacks. The known and proposed feedbacks are listed below, starting with the purely physical examples, which are the simplest and best understood. The latter examples involve chemical and biological interaction and are much more complex.
17.4.1 Physical Feedbacks
17.4.1.1 Stefan–Boltzmann and water vapor feedbacks
As discussed earlier, it is customary to represent many feedbacks as functions of the surface temperature, Ts. The Stefan–Boltzmann feedback, is perhaps the simplest, most fundamental, and best understood of all such processes. As Ts increases, the emission of longwave (infrared) radiation going out into the atmosphere and to space also increases. This process helps cool the surface of the planet, and is thus a stabilizing (or negative) feedback. A different amplifying (positive) feedback that occurs is due to increase in evaporation of water vapor upon increase in Ts. This in turn increases the already large water-vapor greenhouse effect, leading to the so-called water-vapor feedback. Although thermodynamically it is relatively simple to determine the amount of water vapor that enters the atmosphere using the Clausius–Clapeyron equation (see, e.g., Chapter 6, Equation (1)), its resultant atmospheric residence time and effect on clouds are both highly uncertain. Therefore this seemingly easily describable feedback is very difficult to quantify.
17.4.1.2 Albedo feedbacks of snow, ice, and clouds
Another family of feedbacks arises because the radical differences in the albedo (reflectivity) of ice, snow, and clouds compared to the rest of the planetary surface, which causes a loss of the absorption of solar radiation and thereby cools the planet. Indeed, the high albedo of snow and ice cover may be a factor that hastens the transition into ice ages once they have been initiated. Of course, the opposite holds due to decreasing albedo at the end of an ice age. As simple as this concept may appear to be, the cloud-albedo feedback is not easy to quantify because clouds reflect solar radiation (albedo effect) but absorb infrared radiation (greenhouse effect). The net effect of low clouds is to cool the planet, while thin high clouds (cirrus) warm it. Hence, even the sign of the total cloud feedback is not well established and depends in complex ways on the vertical temperature and humidity structure of the atmosphere.
17.4.1.3 Dynamical feedbacks
There are a number of dynamical (fluid-mechanical) feedbacks that relate to the rate at which energy is transported from low to high latitudes and to the vertical motions that produce the cooling needed to form clouds (Hartmann, 1994). These types of feedbacks cause changes in weather parameters such as average wind speed, frequency of occurrence of high- and low-pressure systems, tropical storms, etc. One of the consequences of this set of feedbacks is that ice-age temperature change near the equator was only a few degrees Celsius, while near the poles it was ca. –10 or – 20°C, indicating less efficient transport of heat poleward during ice ages.
These physical feedbacks are currently included in global climate models, although with considerable uncertainty. These large, computer-based constructs generally allow such feedbacks to be “tuned” so that the model simulates the current climate. The existence of this practice emphasizes the high uncertainty even in these best-known feedbacks. Furthermore, models do not necessarily include all of the possible feedbacks. Lindzen (1990) points out that both positive (amplifying) and negative (stabilizing) feedbacks may exist but that most appearing in contemporary climate models are the ones that happen to amplify somewhat the predicted climatic response to increases in CO2 concentration. It may well be the case that there are other, presently unknown dynamical feedbacks that would have the opposite effect.
17.4.2 Chemical Feedbacks
Chemical reactions can be a part of the feedback picture. Perhaps the best studied of the many possibilities is the reaction of CH4 with the tropospheric free radical ·OH, which is the primary sink for CH4:
If this is all that happens, it would seem likely that increased source strength of CH4 would cause OH to decrease, leading to an increased lifetime of CH4. A simple picture of a feedback emerges: increased CH4 could cause increased CH4 lifetime, thereby increasing the CH4 content. However, other processes go on at the same time. For example, OH is both produced and consumed by other pollutant reactions, and there are chain reactions in which OH is first consumed and then reproduced later in the chain. To complicate this picture further, another sink for CH4 is in the stratosphere where it is oxidized to form H2O. Aside from the fact that water vapor happens to be a very effective greenhouse gas in the stratosphere, this increased H2O increases the relative humidity in the stratosphere, possibly increasing the formation of high-altitude clouds. This is expected to happen in regions of low temperatures, such as near the poles. The type of clouds that form are polar stratospheric clouds, which have also been implicated in the destruction of stratospheric ozone (see Fig. 7-11).
Many other chemical feedback possibilities have been suggested (see, e.g., IPCC, 1995, 1996) and the complexities of them are recognized but unresolved in terms of both their mechanistic and quantitative aspects. Again referring back to Fig. 7-11, a web of reactions occur in both the troposphere and stratosphere, linking together the chemical processing of reduced carbon compounds, oxides of nitrogen, halogens, numerous free radicals (especially OH and HO2), and ozone. These complexities make it difficult to quantify chemical feedbacks that depend on climate-active greenhouse gases. Hence, given that CH4 has increased over time, it is possible that a feedback has occurred so that its lifetime has increased (i.e. the sink has decreased). On the other hand, sources could have increased. Either a decreased sink or an increased source (or both) have clearly caused sources to exceed sinks by ca. 7–8% over the period 1985–1995, the time that high-resolution data became available (see Fig. 19-3).
Physical climatic feedbacks involving CH4 have also been suggested (see, e.g., IPCC, 1996). For example, a great deal of methane is trapped in permafrost in the form of clathrates (methane hydrates), which upon melting might release the gas into the atmosphere, causing an enhanced CH4 greenhouse effect. However, there are many factors involved in both the production and consumption of CH4. It can be released from soils at any latitude if they are highly anaerobic, or waterlogged. Warm wet soils are especially effective at releasing methane, for example in rice paddies. At this point, no quantitative estimate for that feedback can be given.
Possibilities exist for the involvement of halogenated species such as CCl2F2 (CFC-12) or CCl3F (CFC-11) inasmuch as they can influence the column amounts of stratospheric O3 which is both a strong absorber of solar ultraviolet radiation and an absorber and emitter of infrared radiation. (Refer back to Fig. 7-11 for a survey of the chemical reactions that are involved.)
17.4.3 Biogeochemical Feedbacks
The most complex of the feedback systems are those in which biota are directly involved. Indeed, one feedback of climate on CH4 may well be an example; microorganisms in soils are a known CH4 sink, and the rate at which they consume CH4 is temperature dependent.
While there would seem to be a very large number of possible biogeochemical feedbacks, only a few have been identified and even these are not quantified. Two main classes of feedbacks can be defined; those in which biota influence albedo, and those that involve changes in the composition of the atmosphere.
Direct biological influences on the albedo that have been suggested include the darkening of land surfaces by vegetation, the likely increase of albedo with deciduous leaf drop and, in the ocean, the change in reflectivity of the sea due to organisms. Increases in albedo of the ocean have been observed via satellite imagery over large (100–1000 km) regions due to blooms of cocolithophores, which have calcareous (calcium-containing) hard parts. The almost milky appearance of the water causes more sunlight to be reflected, and diminishes the penetration of light into the ocean, thus decreasing the depth of the photic zone.
Influences of biota on the composition of the atmosphere are better understood, the best known being a slight global increase of the rate of photosynthesis caused by increased CO2. The result is the production of more biomass and a decrease in the rate of accumulation of anthropogenic CO2 in the atmosphere. This feedback may seem to be an indication that the biosphere will consume some of the extra CO2, thus helping to solve the problem of anthropogenic greenhouse enhancement. But, it is very clear that the strength of the feedback is not anywhere near strong enough to do that since CO2 concentration is continuing to increase. Details of this are discussed in Chapter 11.
Another family of feedbacks involving biota arise via the process of evapotranspiration in which the rate of water vapor is transferred from the land surface to the atmosphere is mediated by plants. Several consequences have been proposed that include influences of biota on the greenhouse effect of water vapor as well as relative humidity and clouds. Lovelock (1988) suggested that tropical forests might be kept cool by increasing cloud cover in response to higher relative humidity released through enhanced evapotranspiration (via the clouds’ influences on albedo). Yet another connection arises because tree-covered land has different turbulence properties above it than bare soil, which also influences the cloud cover above.
A more complex feedback has been proposed that involves the production of dimethylsulfide by certain classes of marine phytoplankton. Four observations in the remote marine atmosphere formed the basis of this idea:
1. Sulfate compounds (e.g., NH4HSO4) form a major constituent of aerosol particles in remote, unpolluted marine air.
2. These particles can be a major fraction of the cloud condensation nuclei.
3. Cloud albedo is calculated to be sensitive to the droplet population. Twomey (1977) showed theoretically that albedo is enhanced by the addition of particles to the atmosphere.
4. The only continuous major natural source of the sulfur in these aerosol particles is dimethyl sulfide from marine phytoplankton (algae).
The putative feedback involves the influence of emissions of this aerosolgenic gas, (CH3)2S, that influences cloud albedo and hence either the temperature of the seawater in which the phytoplankton live or the amount of light available for their photosynthesis. Figure 17-9 represents the hypothetical feedback loop, and emphasizes that even the sign of the feedback is not known. Contradictory evidence has been developed regarding the sign. For example, sulfates and methane sulfonic acid were both elevated in Antarctic ice cores during the last ice age, suggesting that the feedback might have acted as an amplifier of climatic change (a minus sign in the 0/+/ –? oval in Fig. 17-9). On the other hand, a strong positive correlation was observed seasonally at Cape Grim, Tasmania, of higher levels of (CH3)2S, higher CCN and higher temperature in summer time; and methane sulfonic acid was low during ice ages in Greenland (both yielding a plus sign).
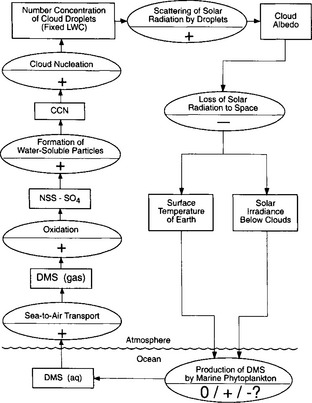
Fig. 17-9 A hypothetical feedback loop indicating dimethylsulfide (DMS) from marine phytoplankton. The rectangles are measurable quantities, and the ovals are processes linking the rectangles. The sign (+ or –) in the oval indicates the effect of a positive change of the quantity in the preceding rectangle on that in the succeeding rectangle. The most uncertain link in the loop is the effect of cloud albedo on DMS emission; its sign would have to be positive in order to regulate the climate. (From Charlson et al. (1987). Reprinted by permission from Nature, Copyright © (1987) Macmillan Magazines Ltd.)
While this feedback may or may not be climatically relevant, it does serve to illustrate the nature of biogeochemical feedbacks. It seems likely that many such complex systems exist, and that they may indeed be factors that influence climate. To return to the introduction to this chapter, it is not possible to rule out biogeochemical feedbacks as factors that have stabilized climate over the past ca. 104 years.
One class of feedbacks has an exceedingly large potential for effectiveness: those that depend on precipitation, evaporation, and the ratio of the two. Changes in the timing of precipitation/evaporation are also important, indeed for the very existence of land biota. This is a complex set of feedbacks since the availability of liquid water in the right amounts at the right time must also coincide with the existence of appropriate amounts and types of nutrients in that same water.
Yet another level of complexity has been proposed in which the biogeochemical feedbacks actually influence the evolution of the organisms. Figure 17-10 advances an hypothesis that might explain how feedbacks could produce self-regulation (homeostasis) without teleology (or intent on the part of the biota). Lenton (1998) proposed a framework to support Gaia theory, which all depends on the notion that the physical climate of Earth is strongly influenced or even controlled by biota.
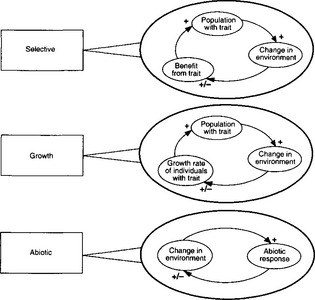
Fig. 17-10 A hierarchy of environmental feedbacks. Three levels are identified, abiotic (purely geochemical and geophysical) feedback, feedback on growth, and feedback on natural selection (see Chapter 3). “Trait” always refers to an environment-altering trait, and “growth” includes reproduction. At each level, both positive and negative feedbacks are possible, and these are illustrated in a general form. A plus symbol indicates a direct relationship. For example, an increase in the population with a particular environment-altering trait increases the resulting change in the environment. A plus/minus symbol indicates a relationship that can be either direct or inverse depending on specific conditions. For example, a change in the environment may increase or decrease the growth rate of individuals carrying the responsible trait, depending on the state of the environment and the direction in which it is being altered. When all the links of a complete feedback loop are positive, the feedback is positive; when one link is negative, the feedback is negative. Steps up the hierarchy are often additive. The activities of organisms can alter an underlying geochemical or geophysical feedback, while feedback on selection may be superimposed on underlying feedbacks on growth. (The spread of a trait is often subject to a direct positive feedback that is not shown – the larger a population, the larger its rate of growth.)
The final judgment is not in yet on whether biotic feedbacks are strong or weak; however, some level of connection of biota to climate has yet to be disproved. Indeed, the presence of O2 and O3 in the atmosphere are a direct consequence of photosynthesis, and their role and that of CO2 in climate cannot be disputed.
17.4.4 Missing Forcings and Feedbacks
The key to understanding the natural variability of climate and its response to natural or anthropogenic forcings is to understand fully both forcings and feedbacks. Forcings are relatively well understood; for example, the uncertainty in forcing by anthropogenic CO2 and CH4 is only 10–20%. Aerosol forcings have also at least been identified, although one of them – their influence on cloud albedo – is not currently quantifiable. However, the feedback problem, in all of its physical, chemical, and biogeochemical complexity, is still a barrier to understanding the system responses.
There are clearly some feedbacks that have not been quantified and, probably, some that have not yet been identified. One feedback that can be identified but not well quantified is the feedback of the cloud portion of the global albedo on surface temperature. The global-mean albedo is very sensitive to both cloud cover and cloud albedo. The global albedo also is strongly influenced (increased) by the extent of sea-ice and snow or glacial cover (the so-called ice-albedo feedback). Indeed, it has been pointed out recently that one of the stable climatic states of Earth is to be totally frozen – into a global ice age. This “snowball Earth” climate is suggested to have existed numerous times in the distant past, terminated each time by increases in the greenhouse effect due to high levels of atmospheric CO2 from continued volcanic emissions (Hoffman et al., 1998).
Going back to Equation (1), and writing Te1 for the radiative temperature at time 1, and Te2 for temperature at time 2 with constant S0 and Re,
If we let T1 be the predictive temperature that we have now, 255 K, we can quickly see what happens if A changes from A1, to a new value A2. The current albedo of Earth is ca. 0.3, and current fractional cloud cover is ca. 0.5. Ice and snow cover are minimal and most of the Earth is oceans with Aocean ≈ 0.1. Forests have Aforests ≈ 0.1 so most of the noncloudy Earth has A ≈ 0.1. This gives an expression for average cloud albedo:
so Acloud currently is ca. 0.5. Now if the fractional area covered by cloud increases to 1 while Acloud stays at 0.5; Aearth increases to 0.5 (a trivial but important hypothetical case):
a drop of ca. 20 K. It is unlikely to have 100% cloud cover because that would require very different atmospheric dynamics, but it is an upper limit. Clearly, even a small change in either the area covered by cloud or the albedo of cloud (Acloud) can cause enormous changes in the radiative temperature of Earth. Indeed a ±1% change in Acloud would cause a ΔTe of ca.  0.2 K. Ts would likely have larger change due to feedbacks. One message in this simple calculation is that the planetary temperature apparently has not varied by anywhere near 20 K over the past 104 years, thus clouds must have remained nearly constant in both their fractional coverage of Earth and their albedo. (Or, even more mysteriously, the two variables could have covaried perfectly to maintain thermostasis.) What feedbacks could keep the cloud contribution to albedo so constant? One partial explanation may be that as much air moves upward (causing clouds to form) as goes down, for continuity reasons.
Since feedbacks may have a large potential for control of albedo and therefore temperature, it seems necessary to highlight them as targets for study and research. Besides the simple example above of cloud area or cloud extent, there are others that can be identified. High-altitude ice clouds, for example, (cirrus) have both an albedo effect and a greenhouse effect. Their occurrence is very sensitive to the amount of water vapor in the upper troposphere and to the thermal structure of the atmosphere. There may also be missing feedbacks.
17.5 Climatic States and Responses
It is clear from the records of ice ages (see, e.g., Fig. 1-2) that Earth can have and has had climates that are different from our current state. Other, more extreme possibilities have been suggested, each of which could be stable for considerable periods of time. The frozen “snowball Earth” already mentioned is analogous to present-day Mars, where its CO2 greenhouse effect amounts to only 3 K (compared with 33 K for present-day Earth, where water vapor is dominant). Another notable period – the middle Cretaceous, from ca. 120 to 90 million years ago – appears to have been extraordinarily warm. Fossil evidence suggests that plant habitats were up to 15° closer to the poles than their current latitudinal position. Studies of sediments show that coal was formed from peat in areas north of the Arctic Circle. Isotopic data indicate that deep ocean water was as much as 15–20°C warmer than it is now. This period also is noteworthy because of the large amounts of today’s fossil fuels that were laid down, indicating that the carbon cycle was very different from today. Many features of Earth were different then, including the location and size of the continents as well as the ocean circulation, so no simple definitive explanation for the warmth of this period is possible. One factor can be suggested based on climate models and the likelihood of enhanced volcanism during that period: the greenhouse effect of CO2 at levels of four to six times that of the present.
Another extreme climate would occur if large amounts of the water in the oceans were evaporated, yielding a positive feedback and a runaway greenhouse effect. A still warmer situation would arise if much or all of the present-day carbonate rock were dissolved and released as CO2 to the atmosphere. These sorts of “runaway” greenhouse effects would occur in large part because the wavelengths emitted by a black-body decrease as temperature increases. On Earth at present the maximum emission occurs at ca. 10–15 µm wavelength. If the temperature is such that this maximum moves (via the Wien effect) to the region of the 4–7 µm absorption band of H2O, the greenhouse effect of water vapor is greatly enhanced. A “runaway” greenhouse effect, which is roughly comparable to Venus today, would appear to be a condition from which there is no return.
Tying together forcings and feedbacks with responses is an enormous puzzle. For example, the decreased CO2 during ice ages certainly contributed to the cooling, but by itself was not enough to explain the total cooling during the ice age. Similarly, the orbital changes (Milankovich effect) also caused forcings that are too small to explain the whole systematic temperature shift. As will be seen in the following chapter, the ice age records in glaciers and sediments offer an intriguing glimpse into the workings of the Earth system but are not yet fully explained.
Thus, the current pressing questions of how to understand and deal with human-induced increases of greenhouse gases cannot be answered with the current knowledge of the extant feedbacks and system response characteristics. Many attempts have been made to detect the global influence of increases in greenhouse gases on global and regional temperatures, and not surprisingly a range of results have been found. From the side of the skeptics, Lindzen (1990) states that the observed temperature changes are consistent with what is known about natural variability, while Hansen and Lebedeff (1988) and Santer et al. (1996) claim that the pattern of temperature changes is what is expected from the known anthropogenic forcings. The IPCC (1996) issued the famous if somewhat equivocal statement, “The balance of evidence suggests a discernible human influence on global climate,” based substantially on the work of Santer et al. (1996). However, the correlations such as were used by IPCC cannot prove causality. What is needed is a more thorough understanding of the processes that control climate, most especially the feedbacks. It seems necessary to face the reality that the physical climate system is coupled to a wide variety of chemical and biogeochemical processes. Most importantly, it would appear that feedbacks involving the biosphere must be included as a key factor in the coupling.
At this point let us pose some important, thought-provoking questions: Will anthropogenic climate forcing be sufficient to cause a shift in the climate state? Do other climatic states exist besides those mentioned above? Will the response to the gradual increase of anthropogenic forcings also be gradual or will these be abrupt changes? These are all matters of current research and cannot be answered at present. To end this chapter, it seems appropriate to quote Roger Revelle and colleagues (1965): “Through his worldwide industrial civilization, Man is unwittingly conducting a vast geophysical experiment.” We can add the obvious point that we do not know enough yet to be able to predict the results. Given that the Earth, Mars, and Venus evolved at about the same time at similar distances from the sun, it is likely that they accreted similar abundances of excess volatile compounds, notably H2O and CO2. Given that the climates of Earth’s two sister planets are radically different because of the ways the greenhouse gases are dispersed and cannot support a complex biosphere, it is critically important to understand the factors that might cause shifts to radically different climatic states.
Charlson, R. J., Lovelock, J. E., Andreae, M. O., Warren, S. G. Oceanic phytoplankton, atmospheric sulfur, cloud albedo and climate. Nature. 1987; 326:655–661.
Dickinson, R. E., Cicerone, R. J. Future global warming from atmospheric trace gases. Nature. 1986; 319:109–115.
Fleagle, R. G., Businger, J. A. An Introduction to Atmospheric Physics. Chichester: Academic Press; 1963.
Hansen, J. E., Lebedeff, S. Global surface air temperatures: update through 1987. Geophys. Res. Lett. 1988; 19:323–326.
Hartmann, D. L. Global Physical Climatology. New York and London: Academic Press; 1994.
Hoffman, P. F., Kaufman, A. J., Halverson, G. P., Schrag, D. P. A neoproterozoic snowball earth. Science. 1998; 281:1342–1346.
Houghton, J. T. The Global Climate. San Diego: Cambridge University Press; 1984.
Intergovernmental Panel on Climate Change, Climate Change: The IPCC Scientific Assessment. Houghton, J. T. Jenkins, G. J. Ephraums, J. J. . Cambridge University Press, Cambridge, 1990.
Intergovernmental Panel on Climate Change, Climate Change, 1994: Radiative Forcing of Climage Change and An Evaluation of the IPCC IS92 Emission Scenarios. Houghton, J. T. Filho, L. G. M. Bruce, J. Lee, H. Callander, B. A. Haites, E. Harris, N. Maskell, K. . Cambridge University Press, Cambridge, 1995.
Intergovernmental Panel on Climate Change, Climate Change 1995: The Science of Climate Change. Houghton, J. T. Filho, L. G. M. Callander, B. A. Harris, N. Kattenberg, A. Maskell, K. . Cambridge University Press, Cambridge, 1996.
(16 April) Kiehl, J. T., Briegleb, B. P. The relative roles of sulfate aerosols and greenhouse gases in climate forcing. Science. 1993; 260:311–314.
Lenton, T. M. Gaia and natural selection. Nature. 1998; 394:439–447.
Lindzen, R. S. Some coolness concerning global warming. Bull. Am. Met. Soc. 1990; 71(3):288–299.
Lovelock, J. The Ages of Gaia. Cambridge: W. W. Norton; 1988.
Peixoto, J. P., Oort, A. H. Physics of Climate. New York and London: American Institute of Physics; 1992.
Revelle, R., Broecker, W., Craig, H., Keeling, C. D., Smagorinsky, J., Atmospheric carbon dioxide. Restoring the Quality of Our Environment. Report of the Environmental Pollution Panel, President’s Science Advisory Committee. The White House, New York, 1965. 126.
Santer, B. D., Taylor, K. E., Wigley, T. M. L., Johns, T. C., Jones, P. D., Karoly, D. J., Mitchell, J. F. B., Oort, A. H., Penner, J. E., Ramaswamy, V., Schwartzkopf, M. D., Stouffer, R. J., Tett, S. A search for human influences on the thermal structure of the atmosphere. Nature. 1996; 382:39–46.
Twomey, S. Atmospheric Aerosols. Washington, DC: Elsevier; 1977.


