Water and the Hydrosphere
6.1 Introduction
It is hard to imagine any part of the Earth system that is more essential than or that has as many different functions as the water of the hydrosphere. In particular, the presence of a mobile liquid phase, with its long list of special chemical and physical properties, must be clearly identified as the main feature of Earth that separates it from the other terrestrial planets or from any known astronomical object. Close to home, the “terrestrial planets,” Earth, Mars, and Venus are presumed to have accreted similar abundances of “excess volatiles” – H2O, CO2, etc. – but evolved very differently. Even in the earliest stages of planetary evolution, liquid water provided a medium in which chemical reactions occurred between atmospheric CO2 and the minerals in primitive igneous rocks to allow the precipitation of carbonate minerals and to prevent a runaway greenhouse effect. While no exact chronology or quantification of this early chemical event can be given, it seems clear that some such process prevented the accumulation of all of the Earth’s CO2 and H2O (as a vapor) in the atmosphere at the same time. This would have caused the Earth to be more or less like Venus – a condition from which there would appear to be no return to our present state. Before embarking on a description of this most important reservoir, it is useful – perhaps necessary – to reflect on the special properties of water itself. We can then proceed to a discussion of how the hydrosphere works.
6.1.1 Water as a Substance
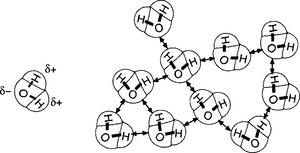
The water molecule, H2O, structurally

is a bent molecule with a very strong permanent dipole moment. This dipole is the result of the negatively charged O atom and the two positively charged H atoms (the whole molecule being neutral). The existence of this charge separation arises due to the near orthogonality of the orbitals of the bonding electrons of the central O atom, while its large magnitude arises comes from the lack of shielding of the bonding electron and the small size of the O atom.
The permanent dipole moment is so strong that it permits the function of what are called hydrogen bonds between the highly electronegative O atom of one molecule and a nearby hydrogen atom of another molecule (see Fig. 6-1). The hydrogen bond is not a chemical bond in the ordinary sense of the forces that hold molecules together, which can be deduced from its strength of ca. 20 kJ/mol. Ordinary molecular bonds have typical strengths (energy required to break them) of a few hundred kJ/mol.
It is the hydrogen bonds of water that give it unique physical and chemical properties, characteristics that set it apart from all of the other molecules formed from elements near the top of the periodic table. Table 6-1 compares several key properties of water to selected simple compounds that might be expected to have similar properties to water but do not. In regard to melting and boiling point, water behaves like a much larger molecule, but it has low density like the low atomic number compound that it really is.
Table 6-1
| Property | Water | Comparison species |
| Boiling point | 373 K | CH4: 112 K (comparable size molecule) |
| NH3: 240 K | ||
| H2S: 211 K (dihydride) | ||
| H2Se: 231 K (dihydride) | ||
| Ar: 87 K | ||
| Melting point | 273 K | CH4: 89 K |
| NH3: 195 K | ||
| H2S: 190 K | ||
| H2Se: 209 K | ||
| Ar: 84 K | ||
| Heat capacity of liquid | 4218 J/(K kg) | CH4:2170 J/K kg |
| Latent heat of vaporization (0°C) | 2.5 × 10⁶ J/kg | |
| Latent heat of freezing | 3.3 × 10⁵ J/kg | |
| Ratio of density frozen/density liquid (0°C) | 0.92 | |
| Surface tension | 73 dyn/cm | CCl4: 27 (nonpolar liquids)C6H6: 29 |
Likewise, liquid water has anomalously high molar heat capacity (75 J/mol K), meaning that liquid water can absorb relatively large amounts of heat from the sun by day and release it at night without much change of temperature. Owing to the large amount of liquid water at the surface of Earth, this large heat capacity is important in mediating temperatures and therefore climate.
Still further, water has large latent heats of evaporation and freezing (J/mol), all because of the same hydrogen bonds. As one result, the solar heating of the planet (largely in the tropics and subtropics), which results primarily in evaporation, transfers latent heat to the atmosphere in the form of water vapor. Subsequent precipitation at colder temperatures (higher latitudes or altitudes) releases the latent heat, making water vapor an important heat-transport vehicle.
This latent heat of evaporation, Le, also appears in the fundamental description of the dependence of the vapor pressure of water, p, on temperature, T – the Clausius–Clapeyron equation:
or in integral form, between locations with p1, T1 and p2, T2:
where R is the universal gas constant in appropriate units.
The large value of Le results in a very strong dependence of vapor pressure on temperature. As a result, the water vapor content of the air is extremely variable, from parts per million by volume in the coldest parts of the atmosphere to several percent in the warmest and wettest parts. The large latent heat of freezing of liquid water imposes a requirement for large transport of heat from bodies of water before the temperature can drop very much below 0°C, yet another type of thermostat.
A further unusual property of water is that it has a maximum density at around 4°C and expands upon freezing, again because of hydrogen bonds. There are more of these bonds in ice than in liquid water, creating a relatively open crystal structure in the solid phase. When ice melts (requiring the addition of a large amount of latent heat of freezing or fusion, Lf) some of the hydrogen bonds are broken, and a tighter packing of H2O molecule results in the denser liquid.
The high latent heat of evaporation or vaporization – due to the hydrogen bonds causing attraction of water molecules to each other – also causes molecules at the surface of water to have cohesive forces. This results in water having anomalously high surface tension. In turn, this property plays a very strong role in the process of nucleation of cloud droplets, as one of the key factors involved in determining cloud droplet sizes and growth and coalescence rates. The latter is a significant factor in delivery of water to the continents by rain.
Very short wavelengths (λ < 186 nm) of UV radiation are required to dissociate the very strong O–H in water (bond strength = 456 kJ/mol). The large concentrations of O2 and O3 in air absorb incoming solar UV radiation high in the atmosphere, preventing much of this photodissociation. The strong bonds and the small size and mass of H2O also give it a very complex infrared absorption spectrum that extends to shorter wavelengths (i.e. higher frequencies, v, and higher energies, hv) than many other simple molecules (CO2 for example). One absorption feature, the 6.3 µm band, is extremely strong, as can be seen in Fig. 6-2. The result of this strong IR absorption, the large amount of water vapor in the atmosphere, and the proximity of the 6.3 µm absorption band of water vapor to the peak of the Earth’s black-body emission is that water vapor is by far the dominant greenhouse gas.
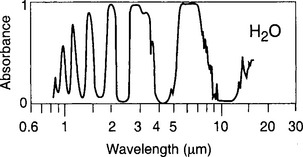
Fig. 6-2 Comparison of infrared absorbance of a vertical column of atmospheric CO2 and H2O vapor. The nearly total absorbance by H2O between 5 and 7 µm, nearly coinciding with the peak of the wavelength-dependent emission of the surface, make H2O a much more effective greenhouse gas. Liquid water (not shown) in clouds adds still more absorbance.
We can see the importance of water vapor as a greenhouse gas by comparing the greenhouse effect on Earth, a relatively humid planet, with that on Mars, which is arid. Mars has an atmosphere that is ca. 95% CO2 (by mass, about 50 times more than on Earth). The greenhouse effect of Martian CO2 causes a temperature increase of only a few degrees. In contrast, the total natural greenhouse effect on Earth is ca. 33 K, the majority of which is due to water vapor and water clouds. Nonetheless, as will be seen in Chapter 17, the anthropogenic greenhouse effect due to enhanced CO2, CH4, N2O etc. cannot be dismissed, as changes in the Earth’s average temperature of even 1 K are significant.
Besides these special physical properties, hydrogen-bonded liquid water also has unique solvent and solution properties. One feature is high proton (H+) mobility due to the ability of individual hydrogen nuclei to jump from one water molecule to the next. Recalling that at temperatures of about 300 K, the molar concentration in pure water of H3O+ ions is ca. 10−7M, the “extra” proton can come from either of two water molecules. This freedom of H+ to transfer from one to an adjacent “parent” molecule allows relatively high electrical conductivity. A proton added at one point in an aqueous solution causes a domino effect, because the initiating proton has only a short distance to travel to cause one to pop out somewhere else.
The existence of strongly polar water molecules and mobile protons also makes H2O an excellent and almost universal solvent for ionic compounds and polar organic species. Compounds that will not significantly dissolve in water (i.e. saturated solutions with concentrations less than ca. 10−5 M) include aliphatic and aromatic hydrocarbons, as well as plastics and many other polymers.
6.1.2 The Right Abundance of Water to Support Life
As can be seen in Fig. 2-1 (abundance of elements), hydrogen and oxygen (along with carbon, magnesium, silicon, sulfur, and iron) are particularly abundant in the solar system, probably because the common isotopic forms of the latter six elements have nuclear masses that are multiples of the helium (He) nucleus. Oxygen is present in the Earth’s crust in an abundance that exceeds the amount required to form oxides of silicon, sulfur, and iron in the crust; the excess oxygen occurs mostly as the volatiles CO2 and H2O. The CO2 now resides primarily in carbonate rocks whereas the H2O is almost all in the oceans.
While it is clear that the hydrosphere is a significant portion of the planet’s mass, there is not, at least currently, so much water that the continents are submerged. Conversely, the oceans are large enough that their surface area would never become an important limiting factor in the hydrologic cycle. Although there have been many shifts in the balance of the hydrosphere, this condition has prevailed since the biosphere began to evolve. The presence of liquid water allowed the Earth to become and remain a living planet, and by the astronomical coincidence of the Earth’s location, the planet received just the proper abundance to sustain and recycle this all-important resource, almost in perpetuity.
6.2 Global Water Balance
While the hydrosphere has long been appreciated as essential to life on Earth, only in the past couple of decades have scientists expanded their exploration of the global hydrologic cycle and its roles across the spectrum of Earth science disciplines. The Earth and its atmosphere, in the broadest view, are a complex, intimately coupled system of chemical, physical, and biological cycles, and water, with its myriad unique chemical and physical properties, plays a part in almost all of them.
To understand the role water plays in global cycles, it is necessary to first understand the mechanics of the water cycle. The hydrologic cycle is driven by solar radiation, which provides the energy necessary to overcome latent heat capacities involved in phase changes. Gravity plays a key role in returning condensed water to the surface as precipitation, and via runoff from the continents to the oceans. At the simplest level, the global water cycle results from imbalances between precipitation and evapotranspiration (ET) at the ocean and land surfaces. Globally, the oceans lose more water by evaporation than they gain by precipitation, whereas the land surface receives more precipitation than is lost through ET; runoff from the land surfaces then balances the ocean-atmosphere water deficit. The hydrologic cycle is significantly more complex than this simple description would suggest. In addition to the atmosphere, oceans, and rivers, significant amounts of water are stored in groundwater, glaciers and ice sheets, soil moisture, and, to a smaller extent, biomass. Figure 6-3 shows a schematic of the global hydrologic cycle, with storages in km3 and fluxes in km3/yr.
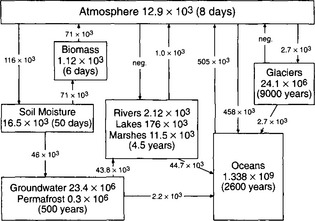
Fig. 6-3 Global water balance. Storages in km3, fluxes in km3/yr. Turnover times calculated as storage divided by total annual inflow. (Data from Shiklomanov and Sokolov, 1983.)
Calculation of the global water balance is a nontrivial problem. Gross storage volumes are calculated predominantly by multiplying surface areas by estimated average depths (UNESCO, 1978). While modern remote sensing technology has made it possible to determine areal extents of surface reservoirs, such as oceans, lakes, and ice sheets quite accurately, estimations of depths or thicknesses are still highly uncertain and often subjective. For example, the wide variations in groundwater estimates can often be attributed to differing interpretations of the extent of groundwater into the Earth’s crust. Similarly, soil moisture depths vary from less than a meter to tens of meters or more, so global soil moisture averages are by necessity highly subjective. Even more well-defined reservoirs, such as oceans or lakes, cannot be accurately quantified without complete knowledge of their bathymetry and vertical temperature profiles, an impossible requirement on a global scale.
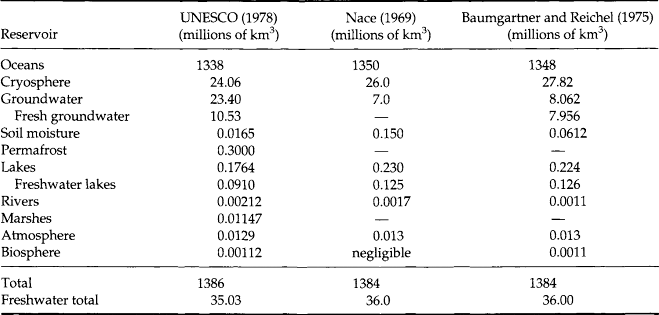
Although fluxes of precipitation and river discharge can be quite accurately determined on a local scale, large portions of the globe, especially the oceans and Antarctica, are essentially ungauged, requiring extensive extrapolation of existing data. Evaporation fluxes are even less well known, since calculation requires extensive knowledge of hydrologic and meteorologic parameters. Consequently, numerous estimates of storage and flux volumes exist for the hydrologic cycle; the representation in Fig. 6-3 was selected for its completeness. Some of the variability in estimates of the global water balance is reflected in the reservoir storage values shown in Table 6-2.
6.2.1 Reservoirs
Figure 6-3 shows the hydrologic cycle as seven primary reservoirs interconnected by a number of water fluxes. The role of each reservoir in the hydrologic cycle and its connections with other cycles is briefly summarized below, in order of storage volume.
6.2.1.1 Oceans
The oceans are by far the largest reservoir in the hydrologic cycle, containing more than 25 times as much water as the rest of the reservoirs combined. As another means of comparison, the volume of water in the oceans is four orders of magnitude larger than that in the next most visible reservoir, the world’s lakes and rivers. The oceans are also one of the Earth’s primary heat reservoirs and have absorbed approximately half of the CO2 emitted to the atmosphere; consequently the oceans play an important role in climate. Coupled with atmospheric circulation, surface and thermohaline circulations in the oceans transfer heat from low to high latitudes and provide a modulating effect on global temperatures.
6.2.1.2 Glaciers and ice sheets
The cryosphere – the portion of the Earth’s water frozen in ice caps, glaciers, and sea ice – contains the largest reserves of freshwater on Earth. Due to the remoteness of most of the planet’s ice-covered areas, estimates of water stored in the cryosphere have a high degree of uncertainty. Current best estimates, based on improved remote sensing technology for determining ice extent, place ice storage at 3 × 10⁷ km3, of which the Antarctic ice sheet makes up about 90% (IPCC, 1996b). Since inflows and outflows are small, at least in the current climate mode, the cryosphere is a fairly static component of the hydrosphere. However, ice-covered portions of the planet do contribute significantly to albedo and can affect atmospheric circulation, making them important links in climatic feedbacks, as discussed in Chapter 17. The climatic record in ice sheets and glaciers is discussed in detail in Chapter 18.
6.2.1.3 Groundwater
The hydrologic cycle’s lithospheric link, groundwater, consists of the water stored in underground aquifers, i.e. all subsurface storage below the subterranean water table. Groundwater reserves extend far down into the Earth’s crust, although the active zone, which contains most of the fresh groundwater, is restricted to the upper reaches. This stratification results in a wide range of residence times for subsurface water, with some deep regions remaining essentially static for up to millions of years. For example, the “mining” of the Ogallala Aquifer underlying the Great Plains region of the United States is of particular concern because the aquifer contains substantial amounts of glacial melt-water from the last ice age, which is essentially a nonrenewable supply.
Groundwater is fed through infiltration and percolation through the soil and is recycled via transpiration through plants, interflow into river networks, and some direct discharge to the ocean. This reservoir is extremely important in global water resources, though reserves in some areas are threatened by overdraft and pollution.
6.2.1.4 Lakes and rivers
Despite their small volume, lakes and rivers play a disproportionately large role in the cycling of water. River networks transport the majority of surface (rain and snowmelt) and subsurface runoff to the oceans to balance the hydrologic cycle. As such, rivers also provide a means of transport for eroded sediment and dissolved ions, nutrients, and organic matter, giving them a prominent role in tectonic and biogeochemical cycles. This is discussed more in Chapter 8. Nutrient cycling in aquatic systems, particularly lakes, is also an important link in particularly the phosphorus and nitrogen cycles. From a human standpoint, surface waters are the most critical reservoir of freshwater, as they provide water resources for most of the Earth’s population (L’vovich, 1974).
6.2.1.5 Soil moisture and biomass
These two reservoirs, representing the land surface, link the atmosphere with other land-based hydrologic reservoirs and processes. Although storage in soil moisture is small, it plays a critical role in the cycling of water, acting as “a kind of intermediary between climate and meteorological factors on the one hand and the phenomena of the hydrologic regime (groundwater, rivers, and lakes) on the other” (L’vovich, 1974). Antecedent soil moisture conditions dictate how much precipitation can be infiltrated into the soil and how much is shed as surface runoff. The soil moisture reservoir feeds groundwater through percolation and plants through transpiration.
Biomass is not a particularly important storage reservoir, but it does play a large role in cycling, mainly via transpiration through land plants and, to a lesser extent, via photosynthesis. Soil-plant interactions are also the key determinants of land surface evaporation; in vegetated continental areas, most evaporation of soil moisture occurs by virtue of transpiration. In addition to evaporation, the land surface contributes to albedo, though surface effects have proven difficult to parameterize in global climate models. Albedo is a strong function of the availability of liquid water. Arid areas (deserts) have very high albedo compared to vegetated land. Consult Chapter 17 for more information on climate considerations.
6.2.1.6 Atmosphere
Although it is one of the smallest reservoirs in terms of water storage, the atmosphere is probably the second most important reservoir in the hydrosphere (after the oceans). The atmosphere has direct connections with all other reservoirs and the largest overall volume of fluxes. Water is present in the atmosphere in solid, liquid, and vapor forms, all of which are important components of the Earth’s natural greenhouse effect. Cycling of water within the atmosphere, both physically (e.g. cloud formation) and chemically, is also integral to other biogeochemical cycles and climate. Consult Chapter 17 for more details.
6.2.2 Turnover Times
Average turnover time (defined as storage volume divided by annual inflow or outflow volume, assuming steady state) is a measure of how long it takes to replace the entire storage in a reservoir. In a steady-state system, which is a reasonable approximation for Earth cycles on geologic time scales, turnover times also provide a sense of how long it will take a reservoir to respond to perturbations in the cycle. Reservoirs with short turnover times are most sensitive, while those with longer turnover times respond more slowly and can often act as buffers on shorter time scales.
The enormous volume of the oceans results in an average turnover time of more than 2600 years, compared to less than 10 days for atmospheric water. Although the reservoir is much smaller than the oceans, the cryosphere has the longest turnover time due to the small input flux. Average turnover times for all seven reservoirs, calculated from the data in Fig. 6-3, are shown in Table 6-3.
Table 6-3
| Reservoir | Volume (km3) | Avg. turnover time |
| Oceans | 1.338 × 10⁹ | 2640 yrs |
| Cryosphere | 24.1 × 10⁶ | 8900 yrs |
| Groundwater/permafrost | 23.7 × 10⁶ | 515 yrs |
| Lakes/rivers | 189 990 | 4.3 yrs |
| Soil moisture | 16 500 | 52 days |
| Atmosphere | 12 900 | 8.2 days |
| Biomass | 1120 | 5.6 days |
Many hydrologic reservoirs can be further subdivided into smaller reservoirs, each with a characteristic turnover time. For example, water resides in the Pacific Ocean longer than in the Atlantic, and the oceans’ surface waters cycle much more quickly than the deep ocean. Similarly, groundwater near the surface is much more active than deep reservoirs, which may cycle over thousands or millions of years, and water frozen in the soil as permafrost. Typical range in turnover times for hydrospheric reservoirs on a hillslope scale (10–103 m) are shown in Table 6-4 (estimates from Falkenmark and Chapman, 1989). Depths are estimated as typical volume averaged over the watershed area.
Table 6-4
Hillslope scale turnover times
| Reservoir | Depth (mm) | Turnover times |
| Atmosphere | 25a | 8–10 days |
| Plants | 5–50 | Hours-days |
| Streams/rivers | 3 | Weeks |
| Lakes/reservoirs | — | Months-years |
| Soil moisture | 10–104 | Years |
| Groundwater | 104–105 | Days-106 years b |
Global freshwater reserves (discounting pollution) are a small percentage of global water, accounting for only 35 × 106 km of the total 1.386 × 10⁹ km3 global water supply (UNESCO,1978). Assuming an input flux equal to oceanic evaporation, this would give a turnover time of about 750 years. The turnover time analysis is not strictly correct since freshwater resides in a number of interconnected reservoirs; however, since freshwater volume is essentially equal to non-marine storage and net evaporation is the only output flux from the oceans, this may be taken as a reasonable estimation. For practical purposes, freshwater resources available to humans cycle more rapidly, but since 97% of freshwater is stored in ice, the global average turnover is much longer.
6.2.3 Fluxes
Robert Horton, an influential pioneer in the field of hydrology, developed one of the first comprehensive representations of the hydrologic cycle in 1931. His original diagram, Fig. 6-4, illustrates the processes by which water moves between the Earth’s hydrologic reservoirs. Hydrologic fluxes can be summed up in four processes, shown around the outside of Horton’s wheel – precipitation, surface dissipation of precipitation, evaporation, and atmospheric moisture transport. This section will discuss precipitation, evaporation (and closely related transpiration), and runoff – the processes that link the oceans, atmosphere, and land surface. Atmospheric moisture is addressed in Chapter 7. These fluxes are highly variable over the Earth’s surface in both space and time, which has extremely important implications for water resources; spatial and temporal variability is discussed in Section 6.3.
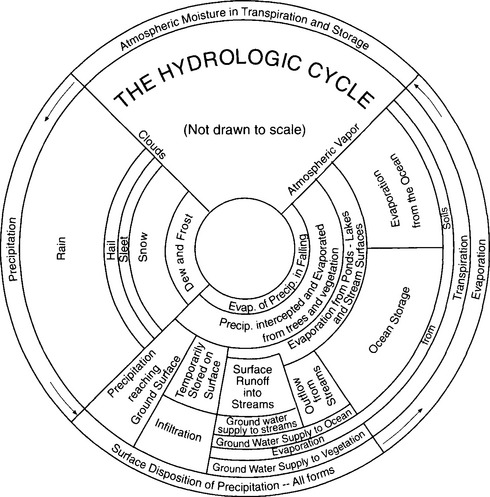
Fig. 6-4 The fluxes of the hydrologic cycle, developed by Robert Horton (1931).
6.2.3.1 Precipitation
The flow of water from the atmosphere to the ocean and land surfaces as rain, snow, and ice constitutes the atmospheric efflux in the hydrologic cycle. Although most precipitation falls on the oceans (ca. 79% of the global total), precipitation onto land is much more hydrologically significant. On a global scale, nearly two-thirds of the land portion returns to the atmosphere via evapotranspiration (see below), while the remaining one-third contributes to groundwater and surface runoff. Precipitation is highly variable over the globe, with atmospheric circulation patterns concentrating it in the tropics and mid-latitudes.
An important component of precipitation on a regional scale comes from precipitation recycling; that is, a portion of the precipitation in a region comes from water vapor evaporated from within that region, with the remainder composed of atmospheric moisture advected into the region. The precipitation recycling ratio, the ratio of recycled precipitation to total precipitation, is then a function of evaporation and internal and external atmospheric moisture fluxes (Budyko, 1974; Eltahir and Bras, 1996). The settling of the Great Plains in the late 19th and early 20th centuries was in fact spurred by early (and largely unfounded) concepts of precipitation recycling. S. Aughey (cited in Holzman, 1937) wrote of Nebraska in 1880 that increased evaporation from cultivated land would increase moisture and rainfall – i.e., that “rain follows the plow.”
6.2.3.2 Evapotranspiration
Water returns to the atmosphere via evaporation from the oceans and evapotranspiration from the land surface. Like precipitation, evaporation is largest over the oceans (88% of total) and is distributed non-uniformly around the globe. Evaporation requires a large input of energy to overcome the latent heat of vaporization, so global patterns are similar to radiation balance and temperature distributions, though anomalous local maxima and minima occur due to the effects of wind and water availability.
Evapotranspiration (ET) is the collective term for land surface evaporation and plant transpiration, which are difficult to isolate in practice. Transpiration refers to the process in which water is transported through plants and returned to the atmosphere through pores in the leaves called stomata, and is distinct from direct evaporation of intercepted precipitation from leaf surfaces. Some land surface processes and the roles of vegetation in the water and energy balances are illustrated in Fig. 6-5. Due to the number of variables involved, ET can be extremely difficult to measure and is often determined by closing the water or energy balance calculated from better-known components.
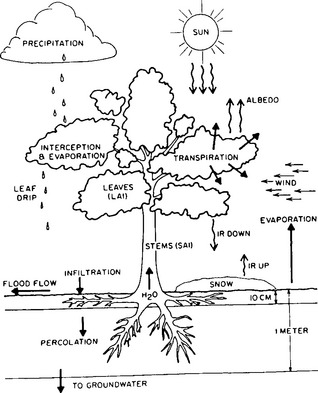
Fig. 6-5 Evaporation and transpiration from vegetation are among the complex land surface interactions in the hydrologic cycle. (From Dickinson, 1984.)
6.2.3.3 Runoff
The excess of evaporation from the oceans is made up for by runoff from the land. Although this flux is much smaller than precipitation and ET, it is a major link in many cycles and is of particular importance to humans in terms of water supply. Runoff can be broadly categorized into subsurface, or groundwater, flow and surface flow, consisting of overland runoff and river discharge.
6.2.3.3.1 Subsurface runoff.
When precipitation hits the land surface, the vast majority does not go directly into the network of streams and rivers; in fact, it may be cycled several times before ever reaching a river and the ocean. Instead, most precipitation that is not intercepted by the vegetation canopy and re-evaporated infiltrates into the soil, where it may reside as soil moisture, percolate down to groundwater, or be transpired by plants.
Very little groundwater is discharged directly to the oceans, but groundwater does provide a significant contribution to stream discharge in most areas. Subsurface flow is generally much slower than surface runoff, allowing groundwater to provide perennial baseflow to streams far into a dry season, long after surface storm runoff has been discharged. Figure 6-6 shows a typical storm hydrograph, with baseflow and stormflow components indicated. Groundwater flow velocities have been found to follow Darcy’s law:
where v is velocity, K is soil hydraulic conductivity with units of (length/time), n is the dynamic (or actively available) porosity, and dh/dL is the hydraulic gradient.
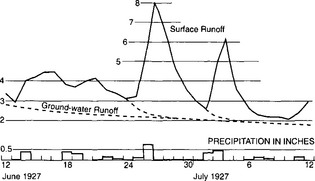
Fig. 6-6 Hydrograph showing the rapid contribution of surface runoff and more steady baseflow. Runoff in cubic feet per second, precipitaion in inches. (From Langbein and Wells, 1955.)
Hydraulic conductivities vary over a range of 10−12 cm/s for unfractured igneous and metamorphic rocks to 2 or 3 cm/s for porous (karst) limestone and gravel; surface flow is typically on the order of a meter per second.
6.2.3.3.2 Surface runoff.
Hydrologists have identified two processes for generating surface runoff over land. The first, saturated overland flow (SOF), is generated when precipitation (or snowmelt) occurs over a saturated soil; since water has nowhere to infiltrate, it then runs off over land. SOF typically occurs only in humid environments or where the water table rises to intersect with a stream. Horton overland flow (HOF or infiltration-limited overland flow) occurs when precipitation intensity exceeds the infiltration capacity of the soil in a non-saturated environment. In this case, only the excess precipitation (that exceeding the infiltration capacity) runs off over the surface. Both types of overland runoff generate relatively rapid flows that constitute the surface water contribution to the hydrograph (Fig. 6-6).
Figure 6-7 illustrates the runoff paths for HOF and SOF, as well as for subsurface stormflow and groundwater flow. Subsurface stormflow is a moderately rapid runoff process in which water flows to a stream through highly permeable surface soil layers (without reaching the water table). Note in Fig. 6-7 that while HOF and subsurface stormflow may occur over a large fraction of an infiltration-limited hillslope, SOF occurs over a smaller portion adjacent to the stream.
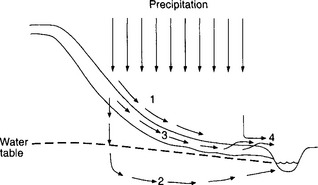
Fig. 6-7 Vertical cross-section showing pathways for surface and subsurface runoff. Path 1: HOF; path 2: groundwater flow; path 3: subsurface stormflow; path 4: SOF. (From Dunne and Leopold, 1978.)
Hillslopes occupy about 99% of the landscape and provide stream channels with water supply, making hillslope processes extremely important on a local scale. However, the much more visible component of surface runoff comes from river discharge. Globally, rivers discharge roughly 45 000 km3 per year to the oceans (Shiklomanov and Sokolov, 1983). The 16 largest rivers account for more than one-third of total discharge, and over half of that contribution comes from the three largest. Table 6-5 lists the 10 largest rivers in the world in terms of average discharge rate (m3/s) and annual discharge volume (km3/yr) (Dingman, 1994).
Table 6-5
| River | Discharge (m3/s) | Discharge(km3/yr) |
| Amazon | 190 000 | 6000 |
| Congo | 42 000 | 1330 |
| Yangtze | 35 000 | 1100 |
| Orinoco | 29 000 | 915 |
| Brahmaputra | 20 000 | 630 |
| La Plata | 19 500 | 615 |
| Yenesei | 17 800 | 565 |
| Mississippi | 17 700 | 560 |
| Lena | 16 300 | 515 |
| Mekong | 15 900 | 500 |
While river discharge is the primary means of transferring water from the land to the oceans, its magnitude pales in comparison to circulation within the oceans themselves. The total average discharge of the world’s rivers is about 106 m3/s or 1 Sverdrup (Sv); by comparison, the oceans’ thermohaline circulation transports about 15 Sv (Broecker, 1997).
In addition to runoff, rivers transport products of upland weathering to the oceans, forming a key link in the tectonic cycle of uplift and erosion. This interaction will be explored further in Section 6.6.
6.3 Hydrologic Variability
Part of the difficulty in studying the hydrologic cycle arises from the huge variability in fluxes over time and space. Most of us have experienced the differences in rain and snowfall associated with changing seasons and observed the different precipitation patterns experienced by other areas of the country and the world. This hydrologic variability is present across virtually all spatial and temporal scales, from the smallest hillslope over a period of minutes to the entire globe over the geologic history of the Earth. Understanding hydrologic variability is particularly important for management of water resources. In that context, continental scale variations in precipitation and runoff within a year and over several years to decades are of the most interest.
Variability has traditionally been accounted for in hydrologic models in one of two ways. Stochastic models attempt to preserve statistical relationships between significant variables determined from historical records, while physically based models are designed to represent natural processes based on values of known variables and empirical parameters. While stochastic models tend to be simpler and less data intensive, they require long historical records, which are unavailable in many areas, and cannot represent conditions outside the range of historic values. Physically based models require extensive input data, but because they explicitly represent physical processes, they are more appropriate for studying effects of and responses to global change and can be used for limited extrapolation beyond the range of data used for their calibration and testing.
6.3.1 Precipitation
On a global scale, and as discussed in Chapter 7, precipitation patterns clearly reflect the convergence and divergence zones in the general atmospheric circulation. Rainfall peaks over the tropics, decreases in the subtropical latitudes, and exhibits more modest peaks at mid-latitudes before going to essentially zero at the poles. Figure 7-7 in the next chapter provides a more complete description of the overall latitude dependence. At the regional or continental scale, the precipitation patterns are complicated by many other factors, including mesoscale atmospheric circulations and orographic effects.
Figure 6-8 shows the average monthly precipitation for selected locations in the United States, illustrating both the spatial variability in total precipitation and the marked differences in distribution of precipitation through the year. The US exhibits four basic annual patterns for precipitation distribution, which can be used to classify climate (Thornthwaite, 1948). The West Coast experiences dry summers and winter precipitation maximums from storms coming in off the Pacific, while the interior of the continent tends to have late spring or early summer peaks associated with peaks in the soil moisture cycles. The northeast receives moderate precipitation throughout the year, while the southeast receives large amounts of rain from late summer thunderstorms fueled by the surrounding warm oceans. The rain shadow effects of the Sierra Nevada, Cascades, and Rocky Mountains, as well as the aridity of the desert southwest, can also be observed in Fig. 6-8.
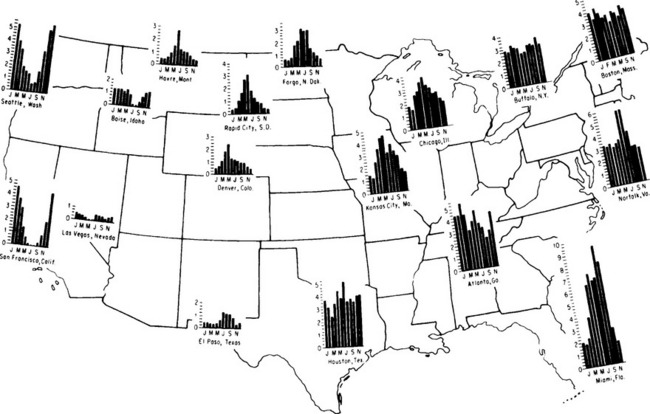
Fig. 6-8 Annual precipitation patterns for the United States. Precipitation in inches (1 inch = 25.4 mm). (From Linsley et al., 1982.)
6.3.2 Runoff
Because it depends on a number of conditions that are themselves inherently variable, runoff tends to vary even more than precipitation, particularly over time. Seasonal runoff patterns depend largely on latitude and altitude of the watershed, due to the importance of snowmelt in runoff peaks. In high-latitude basins or those with significant high-altitude contributing areas, peaks occur later than in low-latitude or low-altitude areas. Figure 6-9 shows the relative amount of runoff in each month for selected US rivers. While average flow in the southeastern rivers is nearly constant (approximately 8% per month), northern rivers and those fed by mountain snowpack show distinct peaks, with peak timing dependent on when snowmelt occurs.
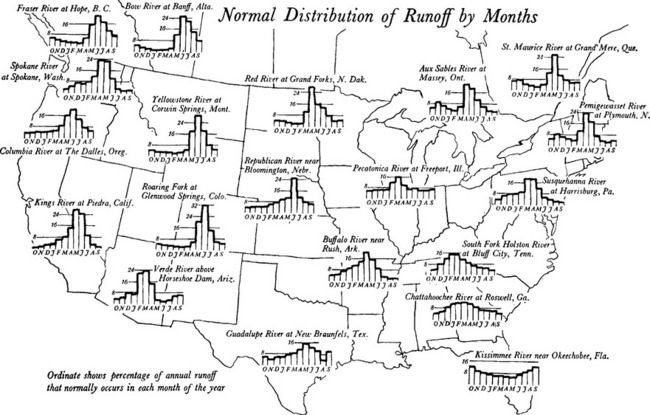
Fig. 6-9 Annual runoff patterns for the United States. Percent of normalized annual runoff in each month. (From Langbein and Wells, 1955.)
Water resources decision making in many areas, particularly arid and semi-arid climates such as the American West, depends on interannual to decadal variations in surface water availability. In addition to more predictable seasonal differences, runoff tends to exhibit long-term trends alternating between flood and drought periods. Fig. 6-10 shows historical wet and dry periods based on streamflow records for 50 world rivers. For the most part, these periods are consistent on a regional basis, though they appear to alternate on a hemispheric scale.
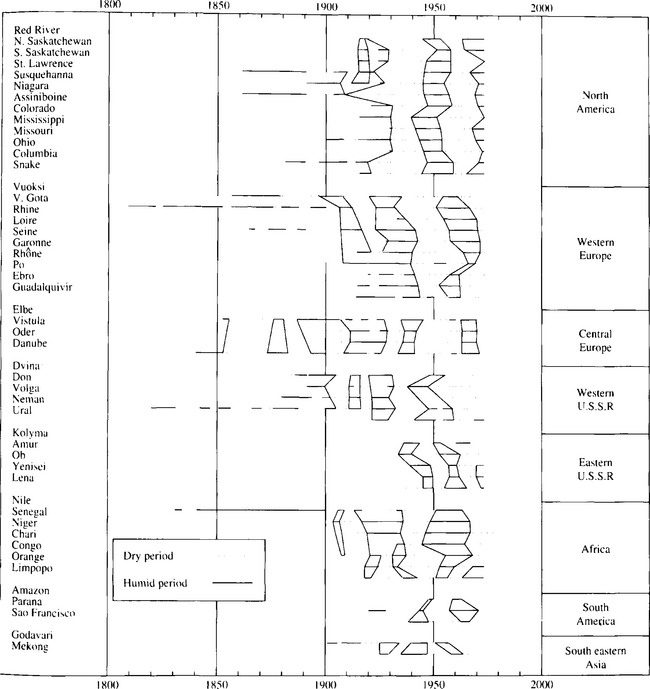
Fig. 6-10 Long-term global streamflow trends. Wet and dry periods from the historical record of 50 major rivers. (From Probst and Tardy, 1987.)
The importance of these long-term trends for water resources is illustrated by the case of the Colorado River Compact, which allocates the water of the Colorado River to the seven states in its drainage area. The agreement, signed in 1922, based allocations on annual discharge from the preceding decade, which remains the wettest period on record; subsequent drier years have given rise to numerous water rights disputes among the seven states and between the United States and Mexico.
6.3.3 Hydrologic Sensitivity
The ability to predict runoff and water availability is critical to water resources planners. However, the complex non-linearities of the hydrologic cycle make this an extremely difficult process. Even where precipitation is fairly well known, runoff prediction is a non-trivial problem, as land surface response depends as much (or more) on precipitation patterns and timing as on precipitation amount. The historical record of monthly rainfall and inflow at the Serpentine Dam, near Perth, Western Australia, provides an illustration of this sensitivity (Fig. 6-11a and b).
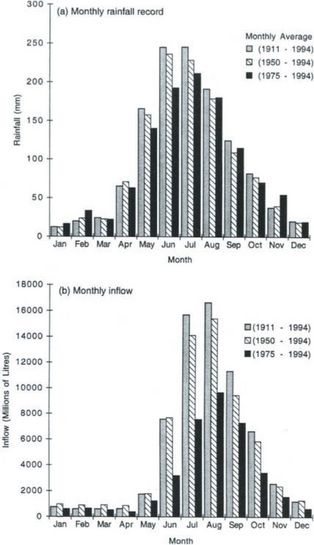
Fig. 6-11 (a) Monthly rainfall record. Serpentine dam, Perth, Western Australia. (b) Monthly inflow. Serpentine Dam, Western Australia. (From Burges, 1998.) (From Burges, 1998.)
The precipitation record shows a mild decrease in rainfall for May, June, and July over the last 20 years of record. However, runoff decreased to less than half the historical average for May and June over the same period, and reduced runoff persisted into December, despite a return to normal or above normal precipitation levels over the latter half of the year.
Runoff sensitivity, particularly in arid and semi-arid climates, is largely a result of sensitivity in soil moisture response. If rainfall amount and frequency decrease, more soil moisture is lost to evapotranspiration, creating a soil moisture deficit that must be replaced before surface runoff or significant groundwater flow returns. The converse also tends to be true: frequent storms can saturate the soil, generating more surface runoff and enhancing subsurface flow.
The complexities of land surface response and runoff generation have also presented a major obstacle to global climate modelers. Hydrologic response is linked to several important climate feedbacks (see Section 6.4.2), so until the hydrologic cycle, and in particular its land surface component, can be accurately represented, there is little hope for accurate assessments of global change.
6.4 Water and Climate
In addition to biogeochemical cycles (discussed in Section 6.5), the hydrosphere is a major component of many physical cycles, with climate among the most prominent. Water affects the solar radiation budget through albedo (primarily clouds and ice/snow), the terrestrial radiation budget as a strong absorber of terrestrial emissions, and global temperature distribution as the primary transporter of heat in the ocean and atmosphere.
6.4.1 Water and the Energy Balance
Water plays a crucial role in the redistribution of heat from the tropics to the high-latitude polar regions. Water transports heat in two forms. Sensible heat refers to the portion of the radiant energy budget that changes the temperature of the surface of the atmosphere. Sensible heat flux produces changes in temperature proportional to the product of density and specific heat (Shuttleworth, 1993). Since liquid water has one of the highest specific heats of any substance (4218 J/(kg K) at 0°C), the oceans can store and release vast amounts of sensible heat without large changes in their own temperatures. Surface ocean currents transport warm tropical water poleward and recirculate cooler surface waters toward the equator. These currents are complemented by the global thermohaline circulation, which circulates water through the depths of the oceans. Ice and water vapor can also store significant amounts of sensible heat, though their specific heat capacities are only one-half to one-third that of liquid water, respectively.
Latent heat is the energy associated with phase changes. Evaporation of water requires an energy input of 2.5 × 10⁶ J per kilogram of water at 0°C, almost 600 times the specific heat. When water vapor is transported via atmospheric circulation and recondensed, latent heat energy is released at the new location. Atmospheric transport of water vapor thus transfers both latent and sensible heat from low to high latitudes.
Sensible and latent heat can be related through the Bowen ratio, which is the ratio of sensible heat to latent heat flux at the surface. The Bowen ratio, R, can be estimated from atmospheric properties as follows:
where SH = sensible heat (Energy/unit time and unit area); LE = latent energy flux (Energy/unit time and unit area); T0 = surface temperature (¯C); Ta = reference level air temperature (¯C); e0 = saturation vapor pressure (mbar); ea = atmospheric vapor pressure (mbar); p = atmospheric pressure (mbar).
For saturated surfaces, the Bowen ratio can then be used to calculate evapotranspiration as a residual of the surface energy balance (Penman, 1948). Since direct measurement of ET is difficult and expensive, the energy balance method is fairly common.
6.4.2 Climate Feedbacks and Response to Global Warming
Five components of the hydrosphere play major roles in climate feedbacks – atmospheric moisture, clouds, snow and ice, land surface, and oceans. Changes to the hydrologic cycle, among other things, as a result of altered climate conditions are then referred to as responses. Interactions with climate can best be explored by examining potential response to a climate perturbation, in this case, predicted global warming.
Current debate regarding the role of the hydrologic cycle in climate focuses on potential responses to anthropogenically induced global warming through an enhanced greenhouse effect due to increased atmospheric CO2 and other gases. Based on GCM simulation results, the Intergovernmental Panel on Climate Change (IPCC) has concluded that global mean surface atmospheric temperature will increase by 1.0 to 3.5°C in the next century, though this will be distributed unevenly over the Earth, with the most significant warming expected at high latitudes. Warmer temperatures are expected to accelerate the hydrologic cycle, though the magnitude and distribution of hydrologic changes, particularly at the regional scale important for water resources, are much more speculative (IPCC, 1996a).
6.4.2.1 Climate feedbacks
In its assessment of climate change, the IPCC (1990) identified five hydrosphere-related feedback mechanisms in the climate system likely to be activated by increased greenhouse gas concentrations in the atmosphere. These feedbacks are briefly described below; for more detailed discussion of the climate system, refer to Chapter 17.
6.4.2.1.1 Atmospheric moisture.
Short residence times and rapid phase changes for water in the atmosphere give it a disproportionately large influence on climate. Changes in atmospheric moisture affect cloud properties and are related to the cloud feedback mechanisms discussed below. In addition, water vapor is the most effective greenhouse gas due to its large heat capacity and absorption spectrum; thus expected increases in atmospheric vapor content (due to accelerated evaporation) would have a positive feedback effect. Increased evaporation and associated release of latent heat to the atmosphere (upon condensation) would warm the troposphere, increasing its moisture storage capacity. Additional water vapor then traps more terrestrial radiation, enhancing the greenhouse effect and further warming the troposphere. Although runaway warming would be prevented by changes in lapse rates to increase the flux of water vapor from the troposphere to higher altitudes, the predicted net effect of the atmospheric moisture feedback is surface and atmospheric warming (Ramanathan, 1988).
6.4.2.1.2 Clouds.
Cloud feedback mechanisms are among the most complex in the climate system, due to the many disparate roles played by clouds, which control a large portion of the planetary albedo but also trap terrestrial radiation, reducing the energy escaping to space. To complicate matters further, different types of clouds behave differently in the same environment. In the present climate mode, clouds have a global mean cooling effect, but the sign of cloud feedback in climate models remains controversial.
Considerable uncertainty about the types of clouds that will increase due to greenhouse warming is the primary obstacle to predicting cloud feedback. Higher cloud top heights, assuming no change in cloud cover or water content, might result in surface warming due to greater capacity to absorb outgoing (terrestrial) radiation. Conversely, higher water content would increase cloud albedo and result in net surface cooling potentially capable of balancing additional greenhouse warming (Chahine, 1992). Ocean surface warming has also shown a moderating effect, increasing convective activity and the formation of high-albedo cirrus clouds (Chahine, 1992).
6.4.2.1.3 Snow-ice albedo.
Although cryospheric processes remain among the greatest sources of uncertainty in climate modeling, models have consistently shown enhanced warming at the poles, resulting in melting of sea ice and less snow and ice cover. Since snow and ice have higher albedos than the underlying land surfaces and oceans, this results in increased absorbed atmospheric radiation at the surface and further warming. Increased vegetative cover from the predicted poleward migration of currently more temperate biomes would also reduce surface albedo of the polar regions (IPCC, 1998). Significant melting of sea ice could also result in changes to ocean thermohaline circulation, as has been observed at several points in the paleoclimate record (see below).
6.4.2.1.4 Land surface/biosphere.
The complexity and high regional variability of land surface and biosphere effects make them extremely difficult to model, though some general feedbacks have been identified. Changes in precipitation (amount and temperature) and evaporation regimes will affect soil moisture storage and infiltration rates (which in turn influence runoff magnitude). Higher evaporation rates would be expected to reduce soil moisture and runoff, though this could be partially offset by reduced transpiration caused by elevated CO2. Increased carbon dioxide increases stomatal resistance in plants, with the potential to reduce transpiration loss per unit leaf area by up to 50%, but also increases plant growth. The net effect on transpiration is uncertain (Rosenberg et al., 1990).
6.4.2.1.5 Ocean circulation.
Paleoclimate evidence has linked changes in thermohaline circulation and the formation of North Atlantic Deep Water (NADW) with several of the major climate shifts of the last glacial period. Therefore, ocean circulation feedback will probably play some role in determining the hydrologic and climatic response to greenhouse warming, though long ocean response times could make this a less important feedback in the short term. The mechanism for thermohaline response is the influx of low-density freshwater into the polar oceans due to precipitation and the melting of glaciers and icecaps. Since density is the dominant driving force for sinking, increased high-latitude precipitation and/or significant melting events could trigger a slowing or stoppage of deep-water formation. As a result, global circulation and poleward heat transfer would be greatly reduced, lowering surface temperatures and providing a negative feedback on global warming. Broecker (1997) hypothesized that a net increase in freshwater input to the North Atlantic of 50% – which is within predicted ranges – would disrupt the salt balance sufficiently to trigger an instability in and reorganization of the thermohaline circulation.
6.4.2.2 Hydrologic response
Accelerated hydrologic processes are predicted to result in an increase of global mean precipitation by 3 to 15%, though changes in regional precipitation would likely vary by ± 20% (Schneider et al., 1990). Like temperature, precipitation changes would be unevenly distributed, with high- and most mid-latitude areas receiving higher precipitation, while rainfall in the tropics may decrease. Changes in the amount and type of precipitation (rain versus snow) also have important implications for runoff magnitude and timing, with regional changes in runoff predicted to vary by as much as ± 50% (Schneider et al., 1990). Current studies of El Niño/southern oscillation and other circulation anomalies demonstrate the potential for significant effects of altered global circulation on precipitation patterns.
6.5 Water and Biogeochemical Cycles
Transport in water is an important mechanism for transfer of biogeochemical elements between the atmosphere, land, and oceans. In particular, rain is the primary means of removal from the atmosphere for many substances, and rivers (and to some extent groundwater) convey weathering products and runoff from the land surface to the oceans.
The following sections summarize only the most prominent interactions between the elemental cycles and the links in the hydrologic cycle. Water also plays a role in many chemical and biological reactions that are beyond the scope of this discussion. The carbon, nitrogen, sulfur, and phosphorus cycles are discussed in detail inChapters 11, 12, 13, and 14, respectively.
6.5.1 Carbon
Rainwater and snowmelt water are primary factors determining the very nature of the terrestrial carbon cycle, with photosynthesis acting as the primary exchange mechanism from the atmosphere. Bicarbonate is the most prevalent ion in natural surface waters (rivers and lakes), which are extremely important in the carbon cycle, accounting for 90% of the carbon flux between the land surface and oceans (Holmén, Chapter 11). In addition, bicarbonate is a major component of soil water and a contributor to its natural acid-base balance. The carbonate equilibrium controls the pH of most natural waters, and high concentrations of bicarbonate provide a pH buffer in many systems. Other acid-base reactions (discussed in Chapter 16), particularly in the atmosphere, also influence pH (in both natural and polluted systems) but are generally less important than the carbonate system on a global basis.
6.5.2 Nitrogen
In the nitrogen cycle, precipitation is the primary mechanism for deposition from the atmosphere to the terrestrial-ocean system. Nitrate in rain is also a significant contributor to acid rain in the eastern US and Europe. River runoff is again the most significant flux between the terrestrial and ocean reservoirs in the nitrogen cycle. River loads are significantly increased by human activity, with fertilizers, agricultural and industrial runoffs, and acid rain contributing about one-sixth of river nitrogen in one study (Berner and Berner, 1987).
6.5.3 Sulfur
As with the nitrogen cycle, the sulfur cycle relies on rain and rivers for transport between the atmosphere, land surface, and oceans. The high solubility of H2O2 in water makes cloud droplets the locus of oxidation of SO2. Rainout is the primary removal mechanism for sulfur (mainly as sulfate) from the atmosphere, although dry deposition can also be important, particularly for SO2. Sulfur has an additional link with the atmospheric portion of the hydrologic cycle, as sulfate is the dominant component of cloud condensation nuclei in many environments (Bigg et al., 1984). This is of particular concern for acid rain given the magnitude of anthropogenic sulfur emissions. Rivers are also an important transporter of sulfur, with sulfate representing the fourth most prevalent dissolved substance in global average river water (after bicarbonate, calcium ion, and silica).
6.5.4 Phosphorus
Unlike other biogeochemical elements, phosphorus does not have a significant atmospheric reservoir. Thus, while some amount of phosphorus is occasionally dissolved in rain, this does not represent an important link in the phosphorus cycle. River runoff is the primary means of transport between the land surface and oceans, and unlike the other elements discussed, phosphorus is transported in both dissolved and particulate form.
Phosphorus is extremely important in biological reactions and is thus cycled through biological systems many times before it ultimately reaches the ocean. Phosphorus cycling is particularly important in lake and wetland systems, where it is often temporarily stored in sediments. Consequently, the groundwater link is more important in the phosphorus cycle than in other elemental cycles. Concentrations of dissolved P in groundwater depend on biological and inorganic reactions.
6.6 Water and the Tectonic Cycles
In addition to transporting biogeochemical elements between the Earth’s reservoirs, water serves as the primary change agent for the land surface itself, transporting the products of weathering and erosion through the river networks to the oceans. Weathering and erosion, primarily by water and glaciers, balance geologic uplift in mountain regions and redistribute sediments to the lowland floodplains and continental shelves to help maintain a constant recycling of the lithosphere.
The suspended sediment load carried by rivers, which discharge 13.5 Tg per year to the oceans, consists of particulate sediments and dissolved solids. Transport of larger bedload sediments is estimated at 1–2 Tg per year, although all of the bedload may not typically reach the ocean (Milliman and Meade, 1983). Since sediment load depends on erosion, yields tend to be highest for drainage basins with extensive geological activity. Consequently, glacial and southeast Asian rivers (due to high uplift rates in the Himalayas) have the highest sediment concentrations (sediment per unit runoff or drainage area), while desert rivers in Australia and Africa have the lowest (Milliman and Meade, 1983). The topic of sediment transport by rivers is a major focus of Chapter 8.
River water chemistry is determined by the relative concentrations of major dissolved components (bicarbonate, calcium ion, silica, and sulfate), which are in turn controlled by the environment. Rivers in precipitation-dominated environments (high precipitation and runoff) tend to have low concentrations of sodium-chloride-dominated salts. Evaporation-dominated rivers (low precipitation and runoff) are also NaCl dominated but with high total salt concentrations. Areas with moderate precipitation and runoff generate rock-dominated river chemistry, with moderate concentrations of calcium bicarbonate salts (Gibbs, 1970). Natural salt concentrations can be altered or overwhelmed by human activities, particularly by irrigated agriculture.
6.7 Anthropogenic Influences
Though the hydrosphere continues to operate in response to the same forces it always has, humans have had an unmistakable role in altering some of its balances. In general, these impacts have had relatively little effect on the overall global water balance, and there is little chance that direct manipulation of the hydrosphere will alter water storage and cycling on a global basis.
On regional scales, however, people have spent the last several thousand years trying to redistribute water resources temporally and spatially. Weirs, canals, and reservoirs have been built to control the timing of runoff and, more recently, to relocate surface water supplies, with the unintended result of greater evaporation losses from reservoir surfaces. Irrigated agriculture also diverts ocean-bound flow, much of which is then returned to the atmosphere through evapotranspiration. Thus, people pay for the privilege of redistributing water with greater losses to the atmosphere.
Dams and reservoirs represent some of the largest engineering projects of the 20th century, and they play a major role in the alteration of the hydrologic cycle on a regional scale. The Columbia River system in the northwestern United States and southwestern Canada is one of the most extensively dammed river systems in the world, with more than 50 dams providing irrigation, hydroelectric power, flood protection, and water supply for the Pacific Northwest. The dams have significantly altered the natural annual hydrograph, as shown in Fig. 6-12. The May-June runoff peaks, 2 to 2.5 times the annual average runoff in the 1915–1924 period prior to dam construction, were barely 1.5 times the average flow between 1985 and 1994. Meanwhile, autumn low flows during the 1985–1994 period are close to the mean annual flow, compared to low flows at about half the mean prior to river regulation.
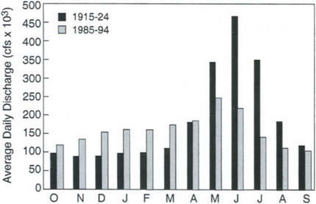
Fig. 6-12 Comparison of mean monthly averaged daily discharges for the Columbia River at The Dalles, Oregon for water years 1915–1924 (1 Oct. 1914–30 Sep. 1924) and 1985–1994. (Data from US Geological Survey, Station 14105700.)
The consequences of this regulated system include significantly lower total discharge (beyond what would be expected from climate variability), ecological effects of altered freshwater inputs to the Pacific, and altered sediment budgets due to sediment trapping behind dams. One unintended result of the changed hydrograph has been reduced autumn and winter surface salinity from the mouth of the Columbia along the North American coast to the Aleutian Island chain, which has potentially negative ecological consequences for endangered salmon runs.
Regional water balances are also altered by agricultural and domestic water uses drawing on underground aquifers, increasingly at rates that exceed natural recharge capability and result in groundwater overdraft. Pollution of surface and groundwaters, though it has no physical effect on the water cycle itself, results in a loss of freshwater resources in addition to the effects on balances in other biogeochemical cycles.
One of the largest human influences on the hydrologic cycle results from changes in land use. Alteration of the land surface and natural vegetation disrupts the natural balance of precipitation, evapotranspiration, and runoff at a given location. This effect tends to be exaggerated by the fact that land use change (e.g. agriculture and urbanization) is often associated with the direct physical changes discussed above.
These and other direct human impacts on the hydrosphere are unlikely to affect the global hydrologic cycle, particularly since humans have not had a great deal of success in manipulating the water balances of the ocean and atmosphere, the largest and most sensitive reservoirs in the system, respectively. Significant anthropogenic effects on the hydrologic cycle are much more likely to arise from indirect changes, most notably human-induced climate change.
6.8 Conclusion
Cycling of water between the atmosphere, land surface, and oceans is important not only to humans and other organisms, which rely on water to live, but in maintaining balances in other cycles as well. Hydrologic fluxes, predominantly rain and rivers, transport significant amounts of carbon, nitrogen, sulfur, and phosphorus, among other elements, between reservoirs in their own biogeochemical cycles. Rivers are also a major link in the tectonic cycle, transporting sediment eroded from upland areas to inland basins and to the oceans. The heat capacities and physical properties of all phases of water also give the hydrosphere an important role in the global heat balance and climate.
To this point, direct human impacts on the hydrosphere have remained restricted to the regional scale. Although they can still be important, particularly in terms of water supply, these direct manipulations of the hydrologic cycle are unlikely to affect the global water balance significantly. However, this is not to suggest that the global water cycle is immune to human influence; its close ties to other physical and biogeochemical cycles subject the hydrologic cycle to indirect effects of human impacts on these cycles as well. The most immediate human threat to the existing global water balance, therefore, may not be the damming of rivers or mining of groundwater but more likely climate change induced by anthropogenic greenhouse gas emissions. Coupled with feedbacks linked to the sulfur cycle, carbon cycle, and biosphere, as well as internal feedbacks and responses, climate change has the potential to alter the hydrologic cycle more than the combined effects of thousands of years of hydraulic engineering.
The Earth’s history, and its future, are shaped not by independent events but by an intricately linked series of feedbacks and responses spanning the spectrum of physical, chemical, and biological cycles, of which the hydrologic cycle is only a part, albeit a central one.
Baumgartner, A., Reichel, E. The World Water Balance: Mean Annual Global, Continental and Maritime Precipitation and Run-Off. Oxford: Elsevier Scientific Publishers; 1975.
Berner, E. K., Berner, R. A. The Global Water Cycle: Geochemistry and Environment. Amsterdam: Prentice-Hall; 1987.
Bigg, E. K., Gras, J. L., Evans, C. Origin of Aitken particles in remote regions of the Southern Hemisphere. J. Atmos. Chem. 1984; 1:203–214.
Broecker, W. S. Thermohaline circulation, the Achilles heel of our climate system: Will man-made CO2 upset the current balance? Science. 1997; 278:1582–1588.
Budyko, M. I. Climate and Life. Englewood Cliffs, NJ: Academic Press; 1974.
(National Research Council). Burges, S. J. Streamflow prediction — capabilities, opportunities, and challenges. In: Hydrologic Science: Taking Stock and Looking Ahead. San Diego: National Academy Press; 1998.
Chahine, M. T. The hydrologic cycle and its influence on climate. Nature. 1992; 359:373–380.
Dickinson, R. E., Modeling evapotranspiration for three-dimensional global climate modelsHansen, J. E., Takahashi, T., eds. Geophysical Monographs; 29. American Geophysical Union, Washington, DC, 1984. 58–72.
Dingman, S. L. Physical Hydrology. Macmillan; 1994.
Dunne, T., Leopold, L. B. Water in Environmental Planning. W. H. Freeman; 1978.
Eltahir, E. A. B., Bras, R. L. Precipitation recycling. Rev. Geophys. 1996; 34:367–378.
Falkenmark, M., Chapman, T. Comparative Hydrology: An Ecological Approach to Land and Water Resources. San Francisco: UNESCO; 1989.
Gibbs, R. J. Mechanisms controlling world water chemistry. Science. 1970; 170:1088–1090.
Holzman, B., Sources of moisture for precipitation in the United States. Technical Bulletin 589. U. S. Department of Agriculture, Paris, 1937.
Horton, R. E. The field, scope, and status of the science of hydrology. In: American Geophysical Union Transactions. Reports and Papers, Hydrology; 1931:189–202.
IPCC, Climate Change: The IPCC Scientific Assessment. Houghton, J. T. et al. Cambridge University Press, 1990.
IPCC, Climate Change 1995: The Science of Climate Change. Contribution of Working Group I to the Second Assessment Report of the Intergovernmental Panel on Climate Change. Houghton, J. T. et al. Cambridge University Press, Cambridge, UK, 1996.
IPCC, Climate Change 1995: The Science of Climate Change. Contribution of Working Group II to the Second Assessment Report of the Intergovernmental Panel on Climate Change. Watson, R. T. et al. Cambridge University Press, Cambridge, UK, 1996.
IPCC, The Regional Impacts of Climate Change: An Assessment of Vulnerability. Watson, R. T. et al. Cambridge University Press, Cambridge, UK, 1998.
Langbein, W. B., Wells, J. V. B. The water in the rivers and creeks. In: Yearbook of Agriculture 1955. Cambridge, UK: US Department of Agriculture; 1955:52–62.
Linsley, R. K., Kohler, M. A., Paulhus, J. L. H. Hydrology for Engineers, 3rd edn. McGraw-Hill; 1982.
Translated by R. L. Nace L′vovich, M. I. World Water Resources and Their Future. New York: American Geophysical Union; 1974.
Milliman, J. D., Meade, R. H. World-wide delivery of river sediment to the oceans. J. Geol. 1983; 91:1–21.
Nace, R. L. World water inventory and control. In: Chorley R. J., ed. Water, Earth, and Man. Washington, DC: Methuen and Co. ; 1969:31–42.
Penman, H. L., Natural evaporation from open water, bare soil and grass. Proc. R. Soc. Lond. ; 193. 1948:120–145.
Probst, J. L., Tardy, Y. Long range stream-flow and world continental runoff fluctuations since the beginning of this century. J. Hydrol. 1987; 94:289–311.
Ramanathan, V. The greenhouse theory of climate change: A test by an inadvertent global experiment. Science. 1988; 240:293–299.
Rosenberg, N. J., Kimball, B. A., Martin, P., Cooper, C. F. From climate and CO2 enrichment to evapotranspiration. In: Waggoner P. E., ed. Climate Change and US Water Resources. Edinburgh, UK: Wiley; 1990:151–175.
Schneider, S. H., Gleick, P. H., Mearns, L. O. Prospects for climate change. In: Waggoner P. E., ed. Climate Change and US Water Resources. New York: Wiley; 1990:41–73.
(Proceedings of the Hamburg Symposium) Shiklomanov, I. A., Sokolov, A. A., Methodological basis of world water balance investigation and computation. New Approaches in Water Balance Computations. International Association for Hydrological Sciences Publication No. 148. 1983.
Chapter 4 Shuttleworth, W. J. Evaporation. In: Maidment D. R., ed. Handbook of Hydrology. New York: McGraw-Hill, 1993.
Thornthwaite, C. W. An approach toward a rational classification of climate. Am. Geogr. Rev. 1948; 38:55–94.
(Translation of 1974 USSR publication. ) UNESCO. World Water Balance and Water Resources of the Earth. New York: UNESCO Press; 1978.
