The Acid—Base and Oxidation—Reduction Balances of the Earth
16.1 Introduction
Biogeochemical cycles interact with each other in many complex ways. Among these interactions are two related and important chemical features of the planet: acid-base balances and oxidation-reduction systems. The acid-base balances have a wide range of consequences in a variety of aqueous phase systems, including control of the weathering and solubility of many minerals, biological influences (including toxicity), and control of numerous aqueous phase and heterogeneous reaction rates. While it is often taken for granted that one or another acid-base balance is a fixed parameter, these systems are in fact extremely sensitive to small changes in the controlling biogeochemical factors and also to anthropogenic influences such as “acidic precipitation.”
It is also often taken for granted that many of the Earth’s subsystems are exposed to free oxygen (O2), leading to a range of one-way reactions of reduced materials (such as organic carbon or metal sulfides) to an oxidized form. As pointed out many times in earlier chapters, the oxidation-reduction status of the planet is the consequence of the dynamic interactions of biogeochemical cycles. As is the case with the acid-base balances, there is considerable sensitivity to perturbations of “redox” conditions, sometimes dramatically as in the case of bodies of water that suddenly become anaerobic because of eutrophication. Another extreme example is the loss of ozone in the so-called “ozone hole.”
16.1.1 Similarities and Differences of the Fundamental Concepts of Acid-Base and Oxidation-Reduction Balances
Referring to the discussion of the fundamental concepts regarding half cells and the Nernst equation in Chapter 5 ( Section 5.3.1) it is possible to briefly summarize the similarities and differences of these two sets of systems. It is important to recognize the ways in which they are different when considering the behavior of complex multivariate systems such as the oceans and clouds, or a lake-river system.
First, the simple thermodynamic description of pε (or Eh) and pH are both most directly applicable to the liquid aqueous phase. Redox reactions can and do occur in the gas phase, but the rates of such processes are described by chemical kinetics and not by equilibrium concepts of thermodynamics. For example, the acid-base reaction
and the redox reaction
are known or supposed to occur in the atmosphere. However, they are not normally considered along with the acid-base and redox systems in the aqueous phase. One of the most important reasons for separating the aqueous and gas phases is that the transfer between them is often governed by physical transport rates and the systems are usually not in thermodynamic equilibrium. Hence, we find that the gas phase and aqueous phase systems are treated separately, although it might at first seem logical to couple them.
Second, the concepts of pH and pε (or Eh) for aqueous phase systems can be written down as mathematical analogs, as cited by Stumm and Morgan (1970, 1981):
where [e−] is the activity of free electrons in the system. Just as a large value of [H+] implies a low pH and high relative acidity, a large value of [e−] implies low pε and strong reducing conditions, and vice versa. However mathematically convenient this may be, it fails to adequately recognize the true nature of the fundamental differences of acid-base and redox reactions.
Acid-base reactions are strictly involved with the exchange of protons (H+ ions) for example, within the aqueous phase. Redox reactions, on the other hand, involve a change in oxidation state of the reactants, requiring the exchange of electrons from one chemical species to another. Indeed, while charge balance is maintained in both redox and acid-base reactions, the former involves changes in oxidation state while the latter does not. The change in the oxidation state or electron density around an element has a more pronounced influence on ultimate molecular form and thus other important properties (solubility, reaction pathway, toxicity, etc.) than does the loss or gain of hydrogen ions.
To summarize, understanding the acid-base and redox systems of the Earth requires careful, if separate, consideration of the aqueous and gas phases and their interplay with solid phases. It also requires recognition of the fundamental similarities and differences of these two related systems.
16.1.2 Reservoirs in which Acid-Base and/or Redox Reactions and Balances Occur
Foregoing any discussion of the very slow processes within the lithosphere, the immediate focal points are the atmosphere, the hydrosphere, and the interfaces between them, and the solid phases (sediment, the pedosphere, and lithosphere). For the aqueous phase the reservoirs are:
In addition to these relatively simple liquid phase aqueous systems, it is necessary to identify situations in which any of these aqueous phase reservoirs come into physical and chemical contact with solid surfaces (e.g., rocks, biomass, sediments, soils, magma etc.). In general, the presence of two or more phases (liquid plus one or more solid phase) provides important constraints on the chemical reactions that may occur within the system as a whole.
This hierarchical list also conveys the notion of a range of system response times and sensitivities, with the atmospheric cases being fast and sensitive to perturbations and the oceans being slowest and least subject to short-term changes.
We will first consider acid-base balances, then redox systems. Finally, we will illustrate in conclusion that both the ultimate H+ ion concentration (pH) and electron concentration (pε) result from interactions of biogeochemical cycles.
16.2 A Hierarchy of Acid-Base Balances
The simplest acid-base relationships should involve the smallest number of molecular species and the smallest number of phases. Adding species and involving more phases produces a hierarchy of increasing chemical complexity and, consequently, increasing algebraic difficulty in describing equilibrium conditions. The simplest case in our list of reservoirs is liquid water in clouds, even though this putative simplest system actually requires consideration of ten or more variables simultaneously.
Before proceeding through a hierarchy of examples, a word about the term equilibrium is in order, particularly as it applies to the dynamically changing components of the Earth system. It is a fact that any particular chemical system itself will rarely be in true equilibrium, just as the physical systems of Earth are not ever really in a perfect steady state. The equilibrium conditions are extremely relevant because they describe the tendency of the system to which termodynamically favorable reactions tend. That is, no matter what the condition is, all systems are moving toward equilibrium.
16.2.1 Key Acids and Bases
Not surprisingly, the acid-base balances within the Earth system almost all involve elements of high abundance, i.e., elements that have low atomic number. In many cases, the acidic molecule is an oxygen-containing oxidation product of an element. Table 16-1 lists the main acids and bases in the global environment. The sources of these acids are chemical reactions of reduced forms of the element involved. Both gas and aqueous phase reactions exist for production of acids.
Table 16-1
Dominant acids and bases in the Earth system
| A. | Acids | |
| 1. | Carbon based: | |
| H2CO3 (carbonic acid) aqueous phase | ||
| HC2H3O2 (acetic acid) aqueous, gas phases | ||
| HCHO2 (formic acid) aqueous, gas phases | ||
| H2C2O4 (oxalic acid) aerosol particles; solid phase | ||
| RCOOH (many carboxylic acids) | ||
| 2. | Nitrogen based: | |
| HNO3 (nitric acid) gas, aqueous, solid phases | ||
| HNO2 (nitrous acid) gas, aqueous phases | ||
| 3. | Sulfur based: | |
| H2SO4 (sulfuric acid) aerosol, aqueous phases | ||
| H2SO3 (sulfurous acid) aqueous phase | ||
| CH3SO3H (from oxidation of (CH3)2S, methane sulfonic acid) aerosol, aqueous phases | ||
| B. | Bases | |
| 1. | Nitrogen based: | |
| NH3, RNH2, R2NH, R3N (ammonia and amines) gas and aqueous phases | ||
| 2. | Igneous mineral based: | |
| Al, Mg silicates (weathering reaction in Chapter 8 and 9) | ||
| 3. | Sedimentary mineral based (examples): | |
| CaCO3 | ||
| Al(OH)3 | ||
| ( Chapter 8 and 9) |
16.2.2 The Simplest Case of Liquid Water in Cloudy Air
Referring back to Chapter 7 ( Section 7.7), we see that clouds form at low supersaturations because of vapor-pressure depression by solutes from cloud condensation nuclei (CCN). This solute plus any added from the dissolution of component gas phase species (e.g., CO2, SO2, NH3, and HNO3) are then the starting constituents that enter into the interactions that lead toward equilibrium. Given the tiny sizes of the aerosol particles that act as CCN (0.01 to perhaps 0.1 µm) and the small amount of aerosol substances in air (0.1–10 µg/m3), it might seem possible to simply neglect the solute of aerosol origin and consider only the solutes coming in from the gas phase. Indeed, many textbooks assume that, in the absence of pollution, the dominant solute in cloud and rainwater is dissolved CO2. After all, 300+ ppm by volume of CO2 translates to about 0.5 g/m3 of possible solute, so how could microgram levels matter? As happens to be the case, CO2 is not very water soluble, and its aqueous form H2CO3 is a very weak acid; hence, it will be seen that CO2 is seldom of any importance to the acid base balance of the cloud/rainwater even though it produces the dominant solute in rivers ( ).
).
We will illustrate the necessity of including solute from CCN by a simple calculation, recalling that pH = 5.6 is the supposed equilibrium value for water in contact with 300 ppm of CO2. (That calculation will appear later.) In clean, marine air, the concentration of submicrometer aerosol particles (by far the most numerous) is small, say 0.25 µg m−3. It is known from measurements that the molecular form is often NH4HSO4, and we assume it is all dissolved in 0.125 g/m−3 of liquid water in a cloud – which is typical for fair-weather marine clouds. Thus the average concentration of sulfate ion [ ], mol/L, is
Because the second dissociation constant of H2SO4 is large (ca. 10−2), and because about half the cation in the system is H+ and half , we then have
and pH = 4.7, a value often observed in unpolluted marine settings. Note that pH = 4.7 is almost a factor of 10 more acidic (i.e., a whole unit of pH) than would be the case for CO2 alone. By this simple calculation, it is easy to see that high levels of H2SO4 in polluted air (5–10 µg m−3) can indeed cause low pH rainwater.
Table 16-2 presents what might be termed the minimum set of constituents that must be considered in the case of cloud/rainwater. If we consider the amount of water, L, to be fixed by atmospheric physical processes, the minimum number of input components that can vary are: SO2, NH3, CO2, and whatever solute is present from the CCN, often one or another sulfate compound between H2SO4 and (NH4)2SO4. Occasionally, salt particles from the ocean surface may be sufficiently abundant to provide enough solute to influence the pH via the inherent alkalinity of seawater, and we will consider that as a second, somewhat more complicated possibility.
Table 16-2
List of input components for the simplest case of the acid-base balance of unpolluted marine clouds. Also shown are the mass conservation statements, chemical equilibrium expressions and constants, and the requirement for charge balance

Table 16-2 also provides a list of 15 equations that can be solved simultaneously to yield the equilibrium condition (Taylor et al., 1983). Furthermore, if the concentration of each species is calculated as a function of pH (the so-called master-variable diagram or Sillén diagram, named after Sillén (1967) who popularized the method, it is possible to examine various sensitivities in the system, e.g., to the addition of more solute (see explanatory box on Sillén diagrams).
Figure 16-1 is a master-variable diagram corresponding approximately to the previous clean marine case, illustrating that derived from CO2 is only important at pH > 7, and that at equilibrium H+, NH4, and
 are the dominant species. Figure 16-2 extends this approach to the small population of droplets without any
 in them that are nucleated on particles of seasalt that is present. In this case, pH = 6.7 and the dominant cation is seawater “alkalinity” or Ak+ (alkalinity in seasalt is the sum of cation concentration due to dissolved carbonates such as CaCO3, MgCO3 etc.), while the dominant anions are
 from SO2 and
 from CO2. Interestingly, these two categories of droplets can coexist in the same cloud if the submicrometer sulfate and supermicrometer seasalt particles are not chemically mixed with each other.
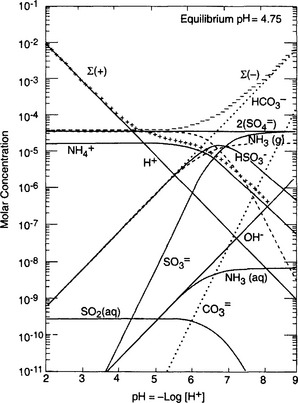
Fig. 16-1 Master-variable diagram of clean marine cloud at a model altitude of 875 m. Equilibrium occurs where Σ[+] = Σ[–], i.e. charge balance. Input conditions are 0.2 µg/m3 of aerosol, roughly half neutralized by
 in the amount 0.039 µg/m3. 0.1 ppb by volume SO2 and 0.125 g/m3 of liquid water, 340 ppm CO2, temperature is 278 K. (After Twohy et al., 1989.)
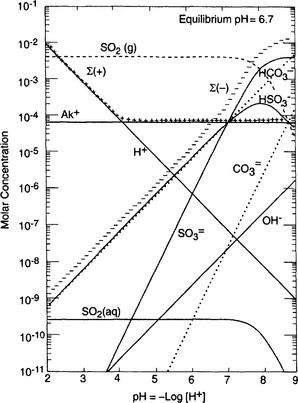
Fig. 16-2 Same as Fig. 16-1, except for the ca. 0.001 g/m3 of water nucleated on alkaline seasalt particles in the same cloud. 1 µg/m3 of seasalt.
16.2.3 Anthropogenic Modifications of the Acid-Base Balance of Rainwater: Alkalinity in Cloud Water “Acid Rain”
It is easy to see from the simple, clean marine case in Fig. 16-1 that the constituents controlling the pH are H+, as cations and
 as the sole important anion. Any ionic solute that is added to this mixture, e.g. H2SO4 from the oxidation of anthropogenic SO2, will simply add more moles of solute to the system. In the real case of acid rain in industrial regions, many solutes are added; including some that are alkaline, trace metals, NH3, and significant amounts of the strong acids H2SO4 and HNO3. Sometimes, organic acids are also added, particularly, formic, acetic, and oxalic acids. If the acid that is added is a strong acid, the increased anion concentration is essentially pH
independent and the horizontal line for 2[ ] (i.e., the equivalent concentration of sulfate) is subsequently elevated as in Fig. 16-3. Water that lacks material to react with the added acid is said to be unbuffered, as is indeed the usual case for rainwater. The equilibrium pH decreases as the amount of H2SO4 added increases from cases c through a.
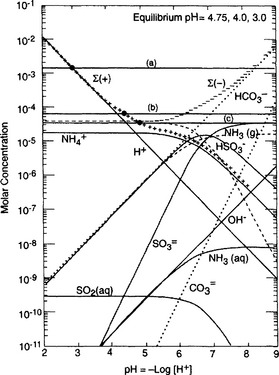
Fig. 16-3 Same as Fig. 16-1, except (a) 10 µg/m3 of H2SO4 aerosol; (b) 0.4 µg/m3 and (c) 0.2 µg/m3.
Another way to illustrate the sensitivity of the acid-base balance to perturbations appears in the form of titration curves, as in Fig. 16-4. While this indicates a significant temperature dependence (due to the dependence of the equilibrium constants and gas solubilities on temperature), the main feature is the strong falloff in pH when the concentration of strong acid anion exceeds that of the weak base, in this case ammonia. Except in certain agricultural areas with high NH3 source strengths (e.g., dairy-intensive areas like the Netherlands), the total ammonia available in the atmosphere is low, yielding curves like those lower in the figure. This is the essential nature of the problem of acidic precipitation – a large decrease of pH with the addition of small amounts of acid.
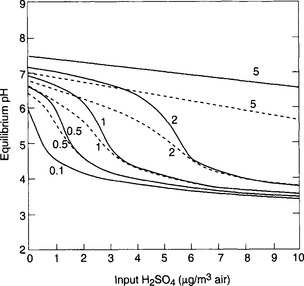
Fig. 16-4 pH sensitivity to and
and . Model calculations of expected pH of cloud water or rainwater for cloud liquid water content of 0.5 g/m. 100 pptv SO2, 330 ppmv CO2, and NO3. The abscissa shows the assumed input of aerosol sulfate in µg/m3 and the ordinate shows the calculated equilibrium pH. Each line corresponds to the indicated amount of total NH3 +
 in units of µg/m3 of cloudy air. Solid lines are at 278 K, dashed ones are at 298 K. The familiar shape of titration curves is evident, with a steep drop in pH as the anion concentration increases due to increased input of H2SO4. (From Charlson, R. J., C. H. Twohy and P. K. Quinn, “Physical Influences of Altitude on the Chemical Properties of Clouds and of Water Deposited from the Atmosphere.” NATO Advanced Research Workshop Acid Deposition Processes at High Elevation Sites, Sept. 1986. Edinburgh, Scotland.)
16.2.4 Acid-Base Balances in Freshwater Systems
Freshwaters, ranging from surface runoff water to small streams, lakes, and rivers, exhibit a very wide range of solute compositions and concentrations that are dictated by the total history of processes that have influenced the composition, starting with the formation of cloud water. Figure 16-5 shows a Sillén diagram for “average” river water, using data from Stumm and Morgan (1981). Also shown in a dashed line in Fig. 16-5 is the estimate from Fig. 16-1 for the pH in the pristine rainwater case, showing the radical changes that occur between rainwater and streamwater. Starting with dissolution of minerals at the continental (rock or soil) surface, water is further processed by ion exchange reactions in soils and sediments, adding alkali and alkaline-earth metal ions that dominate the cation load. Anions are added as well, particularly Cl− and from minerals and weathering reactions and, most importantly,
 from dissolved, biologically produced CO2 in soil water.
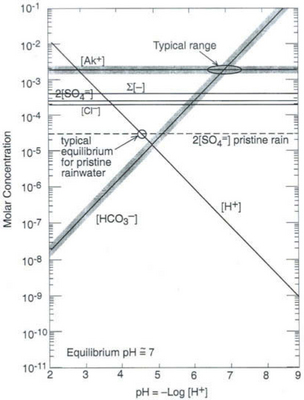
Fig. 16-5 Sillén (master variable) diagram for “average” river water, using data from Stumm and Morgan (1970).
The in rivers is greatly enhanced over that in rain (the latter being due to atmospheric CO2 alone), mainly because of high CO2 partial pressure in soils from bacterial and fungal decay of biomass and from root respiration. This CO2 is highly variable temporally and from place to place, so [
 ] in soil water and river water is also highly variable. The main cations (Na+, K+, Mg2+, and Ca2+) are variable as well, causing a range of compositions as indicated in Fig. 16-5.
16.2.5 The Acid-Base Balance of the Ocean
Referring back to Chapter 10, the chemical composition of the ocean can be approximated by an equilibrium model (actually proposed by Sillén) and can be explained more completely by a dynamical model. Of the constituents in seawater, two emerge as being dominant in controlling the pH: , and alkalinity (Ak+) which is the excess of cations like Ca2+, Mg2+ etc. above and beyond the primary solute anions Cl− and
 . Figure 16-6 is replotted from Sillén’s own graph depicting the acid-base balance of seawater. The high pH of seawater, typically 8 < pH < 8.4 (shown) is a balance of Ak+ (not shown) and
 .
.
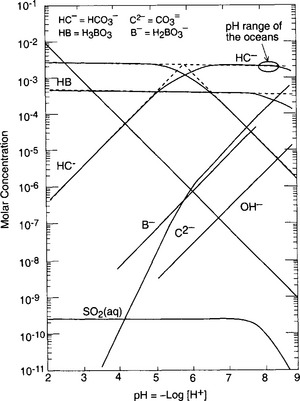
Fig. 16-6 Sillén (master variable) diagram for seawater. Replotted from Sillén’s own graph (Sillén, 1967).
16.3 Oxidation-Reduction Balances of the Earth System
Just as was the case with acid-base interactions, numerous elements are involved in the oxidation-reduction or redox processes that may also be thought of in terms that are global. Redox reactions are often broken down into half reactions in which electrons (e−) are added or taken away from element or molecules ( Chapter 5, Section 5.2.1) analogous to hydrogen ions in acid-base reactions. This approach makes possible a clear method for describing equilibrium thermodynamics of the redox reactions.
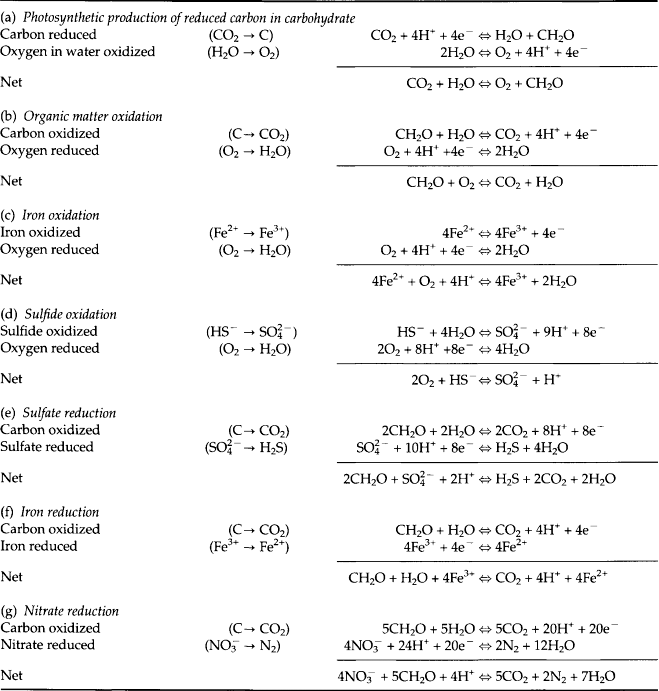
Oxidation-reduction reactions in water are dominated by the biological processes of photosynthesis and organic matter oxidation. A very different set of oxidation reactions occurs within the gas phase of the atmosphere, often a consequence of photochemical production and destruction of ozone (O3). While such reactions are of great importance to chemistry of the atmosphere – e.g., they limit the lifetime in the atmosphere of species like CO and CH4 – the global amount of these reactions is trivial compared to the global O2 production and consumption by photosynthesis and respiration.
An intriguing aspect of environmental redox reactions is the interplay between thermodynamics and kinetics. Reaction rates vary from a second or less for some of the fast electron transfer reactions in the atmosphere to millions of years for some organic matter degradation reactions. Global-scale redox reactions are driven by photosynthesis and photochemistry, both of which use energy from the sun to create local centers of thermodynamically unstable compounds, like plants of all sizes or reducing compounds in sunlit surfaces of natural waters and the atmosphere. This process sets the stage for the cascade of thermodynamically favorable, energy-yielding reactions that oxidize reduced compounds and tend to decrease the free energy of the planet. In water, nearly all oxidation reactions are microbially (enzymatically) catalyzed, creating a vast range of rates toward thermodynamic equilibrium. While kinetically slow, degradation of organic matter by a variety of oxidation reactions is efficient enough to destroy all but a small amount of the compounds produced with the sun’s energy before they are buried. That this small fraction escapes oxidation is extremely important to the global redox balance because it frees an equivalent amount of molecular oxygen to the atmosphere creating an environment suitable for higher forms of life. It also releases sufficient oxygen to produce the ozone layer, blocking out damaging solar UV radiation.
16.3.1 Redox Couples in the Environment
Only a few elements are dominant in the electron transfer reactions in the environment (Table 16-3). There are vastly more elements that undergo redox transformations at Earth temperature and pressures, but carbon, nitrogen, oxygen, sulfur, iron, and manganese are by far quantitatively the most important because of their abundance and different oxidation states. Redox reactions consist of two half reactions (Table 16-4) in which one element gains electrons (it is reduced) and in the other loses electrons (the element is oxidized). The most ubiquitous of these reactions is between oxygen and carbon in which carbon is reduced from CO2 to organic matter during photosynthesis (Table 16-4a). We use the simple approximation of carbohydrate, CH2O, to represent organic matter. The opposite reaction oxic respiration is the thermodynamically favored respiration reaction (Table 16-4b). Two other globally important oxidation reactions by O2 are the oxidation of reduced iron and sulfur (Table 16-4c and d) in sedimentary rocks.
Table 16-3
Oxidation states of key elements. The oxidation state of an element is its charge or valence state in various chemical species. Many elements have more than one oxidation state. In nature you can usually determine the oxidation state of an element in a compound by assuming O(–II) and H(I)
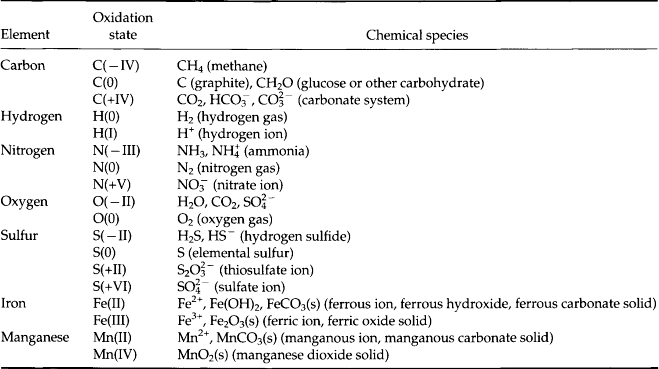
The reduced forms of sulfur and iron and other elements are created during anoxic respiration of organic carbon in the absence of oxygen (Table 16-4e,f). Note that any reaction in which an element loses electrons during transformation to a higher oxidation state is called an oxidation, whether or not the reaction involves oxygen. The energy released during the different oxidation reactions can be calculated from thermodynamic values for the free energies of formation in which all free energy values are related to the standard hydrogen electrode (see Chapter 5, Section 5.3.1). The free energy changes for the important half reactions are given in Table 16-5. When these reactions are coupled with organic matter oxidation, the largest amount of free energy is released in the reaction with oxygen, with oxidation by reduction of , Mn (IV), Fe (III),
 , and production of CH4 yielding successively less energy.
Table l6-5
The standard free energy of reaction, , for the main environmental redox reactions
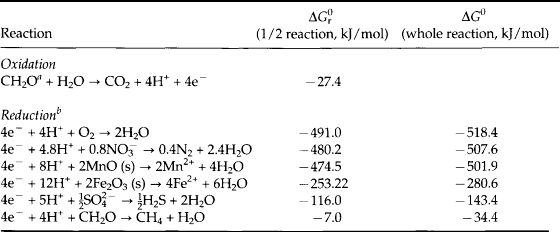
aCH2O represents organic matter. ΔGf = −129 kJ/mol.
bThe free energies of formation are (kJ/mol) (Stumm and Morgan, 1981): H+ = 0; MnO2 (pyrolusite) = −465.1; Mn2+ = −228.0; H2O = −237.0; = −111.3; N2 = O; Fe2+ = −73.9; Fe2O3 (hematite) = −742.7;
 = −744.6; H2S = −27.9; CH4 = −34.4; CO2= −394.4; O2 =+16.3.
We shall see later in the chapter that the global burden of free O2 is essentially all in the atmosphere. Since most reduced compounds are solids on the continental surface, in soils and sediments, oxidation by O2 occurs primarily at the interface of the atmosphere with oxidizable surfaces. The actual sequence of organic matter oxidation reactions in nature is most clearly demonstrated in the chemistry of pore waters of sediments where organic matter is degraded and where the sediments are bathed by oxygen-containing bottom water. Studies of the concentration of electron acceptors (oxidants) in sediment pore waters reveal that the sequence of oxidant use follows the order in which the gain of free energy is the greatest. Figure 16-7 is a schematic compilation of many different sets of pore water measurements. The whole range is rarely observed in a single setting because the supply of organic matter to the sediments is exhausted before methane formation occurs if the concentration of oxygen in the bottom waters is high. In environments where organic matter supply is high and oxygen concentration in bottom waters low, the reactions proceed from reduction to CH4 formation.
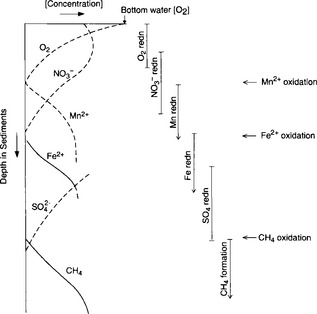
Fig. 16-7 Changes in concentration of metabolites in sediment. The reaction order follows the sequence dictated by thermodynamics (i.e., the most energy releasing reactions occur first). (Modified from Froelich et al., 1979.)
Normally in chemistry one does not expect reaction rates or sequences to follow thermodynamic energy gain. Rather, they are dictated by activation energy barriers (with the exception of linear free energy relationships). Since virtually all the organic matter oxidation reactions in nature are microbially mediated, the observation in Fig. 16-7 demonstrates that the microbial (enzyme) catalysis effectively reduces activation energy barriers so that the maximum amount of available free energy can be utilized by the opportunistic bacteria.
16.3.2 Thermodynamic Disequilibrium and Microbial Catalysis of Oxidation Reactions
While the sequence of oxidation reactions in nature follow thermodynamic predictions for free energy gain, this does not mean the environment approaches equilibrium with respect to redox reactions. This is evident given the existence of organic life in our oxygen-containing environment, but it is also the case in more subtle forms in natural waters. A classic example of this is illustrated by the concentrations of redox couples (elements that exist in different oxidation states) in environments in which oxygen-containing and oxygen-depleted waters coexist. Concentrations of a variety of redox couples measured in Saanich Inlet, a fjord with restricted circulation on Vancouver Island, Canada, are presented in Fig. 16-8. The oxygen/hydrogen sulfide interface is at about 130 m water depth indicating a dramatic change in the redox potential at this horizon. Values of the pε (see Chapter 5, Section 5.3.2 regarding pe) and pεw (pεw is the pε at the pH of the environment, pH = 7.4 in this case) of eight measured redox couples are compared with the values calculated from their measured activities, pεC, in Table 16-6. The calculated pε values, pεC, vary by 17 orders of magnitude in the region around the O2/H2S interface. Couples with vastly different pε values exist in the oxygen containing region where reduced species I−, Mn2+, and Cr(OH)2+ coexist with oxidized forms resulting in pεC values of between 6.6 and 12.8. The state of disequilibrium is less dramatic in the waters containing hydrogen sulfide where pεC values range between –2.6 to –3.4 for the N2/ , FeOOH/Fe2+ and
 /HS− couples.
Table 16-6
Redox half reactions, pε0, , and calculated pε values from the redox species distributions pεc for the zone 125–135 m in Saanich Inlet
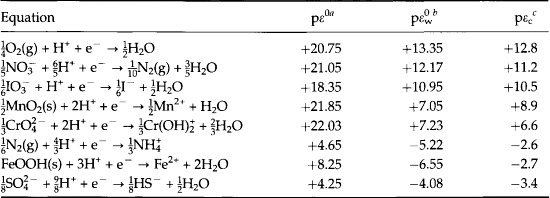
apε0 ≡ log K; log K estimated from free energy ( ) data. pε0 is the pε to expect at equilibrium if the ratio of the oxidized and reduced species are at unit activity:
bp is the pε0 normalized to constant pH:
 = pε0 + n (− 7.4); pH here = 7.4.
cpεc is the calculated pε using the measured activities of the oxidized and reduced species:
assuming: pressure (N2) = 0.76, [ ] = 28 × 10−3 mol/kg; pH = 7.4.
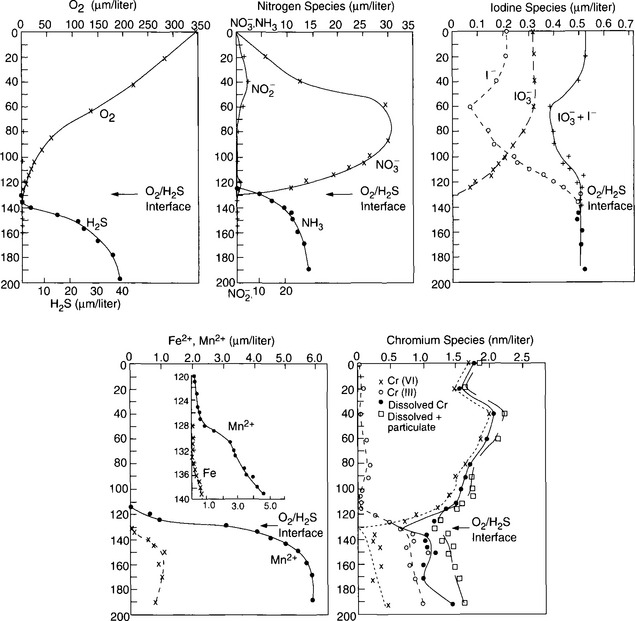
Fig. 16-8 Depth distribution of the concentration of redox couples in a partially anoxic fjord, Saanich Inlet. (Redrawn from Emerson et al., 1979.)
These measurements indicate that it is not possible to identify a single value of pε surrounding the O2/H2S interface in the environment. Redox couples do not respond to the pε of the environment with the same lability as hydrogen ion donors and acceptors. There is no clear electron buffer capacity other than the most general states of “oxygen containing” or “H2S containing.” The reason for the vast differences in pεC in the oxic waters is the slow oxidation kinetics of the reduced forms of the redox couples. The reduced species for which the kinetics of oxidation by O2 has been most widely studied is Mn2+. This oxidation reaction is slow and known to be catalyzed by solid surfaces and by bacteria. Recent studies at natural seawater concentration levels in the absence of catalysis indicate that the residence time for homogeneous oxidation is on the order of 6–7 years at 25°C and pH = 8 (von Langen et al., 1997). Results of studies of the catalysis of this oxidation reaction in laboratory experiments and on field samples taken from the O2/H2S interface of Saanich Inlet are presented in Table 16-7. The oxidation rate constant normalized for different O2, Mn, pH, and solid concentrations indicates that the character of the solid is important partly because some surfaces bind Mn2+ more strongly and partly because they facilitate the electron transfer differently. Catalysis by enzymes is clearly the most effective oxidation enhancing process as indicated by the laboratory studies with spores and material from the O2/H2S interface of Saanich Inlet. Microbial catalysis in this environment reduces the oxidation lifetime of Mn2+ to about one day. This example illustrates the generally empirical nature of our current understanding of the rate of electron transfer reactions in nature and why it is presently not possible to predict many of these rates even though they frequently control the distribution of redox couples in the environment.
Table 16-7
The surface or enzyme-catalyzed reaction rate constant, kMn, for oxidation of Mn2+ normalized for oxygen concentration [O2], pH and particulate concentration [X]. d[Mn2+]/dt = kMn [Mn][O2][OH]2[X]

e[X] is taken to be the concentration of particulate Mn.
16.3.3 Oxidation Processes in the Atmosphere
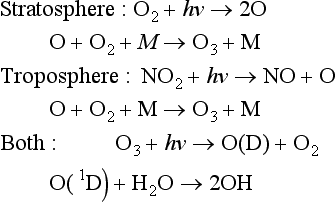
Owing to the high availability of O2 in air, redox reactions there are extremely one-sided, with reduced compounds that may enter the atmosphere becoming oxidized at various rates. However, while O2 is the source of the oxidizing agent, mechanistically most of the oxidation reactions proceed via shorter-lived species containing oxygen, often with an odd number of O atoms. Examining Fig. 7-11, we can group together several sets of highly reactive oxidizing agents:
“Odd” implies uneven numbers of the atom. With few exceptions, these and related oxidizing agents are free radicals; i.e., they are molecules with an odd number of electrons such that one of the electrons is unpaired. This leads to higher reaction rate constants, often higher by many orders of magnitude than for ordinary molecules. Ozone, of course, is not a free radical, and as might be guessed, it is not as reactive as free radicals like OH, the hydroxyl radical.
Interestingly, many of these free radicals are produced from photochemical reactions in the atmosphere of O2 and O3, for example
So the ultimate source of oxidant is O2, although the actual species involved in the oxidation is not O2.
An important example of an atmospheric oxidation reaction is found in the main sink for carbon monoxide:
Another one is the primary atmospheric sink reaction for carbonyl sulfide:
For a more complete discussion of these reactions, consult Chapter 7. Beyond that, a thorough analysis of the redox state of the atmosphere can be found in textbooks on atmospheric chemistry, e.g., Wayne (1991).
16.3.4 Global Mass Balance of Oxygen and Carbon
Photosynthesis and oxic respiration dominate global redox processes as well as the cycles of oxygen and carbon. Because oxygen is a relatively insoluble gas it resides predominantly in the atmosphere (Fig. 16-9) whereas the largest “short-term” reservoir of carbon is dissolved inorganic carbon in the oceans (see Chapter 10 on oceanography and Chapter 11 on the carbon cycle). About half of the global photosynthesis occurs on land and half in the sea. This must be roughly the case because the δ18O of molecular oxygen in the atmosphere is about +23‰ and the sources from land and ocean photosynthesis are roughly +26 and +20‰, respectively. Of the nearly 10 000 × 1012 moles of oxygen fixed annually by photosynthesis, nearly all of it is consumed again by respiration, with only a small fraction of the marine photosynthesis escaping oxidation via burial. Since about 1.5 mol of O2 are produced for every mole of organic carbon fixed in the ocean (the value is more like 1.1 on land), removal of organic matter from the ocean environment by carbon burial represents a source of O2 to the atmosphere. Only about 0.1% of the carbon fixed by photosynthesis is buried (13 × 1012 mol C/yr, which is equivalent to 20 × 1012 mol O2/yr, Fig. 16-9). The residence time of atmospheric oxygen with respect to this net source is
If the global oxygen production caused by the small fraction of carbon fixed by photosynthesis that is buried were not balanced by an oxygen consumption term, and other processes remained the same, the O2 content of the atmosphere would roughly double in about 2 million years. This is a short time geologically, particularly because it is believed there has been enough oxygen in the atmosphere to support animal life for at least 600 million years.
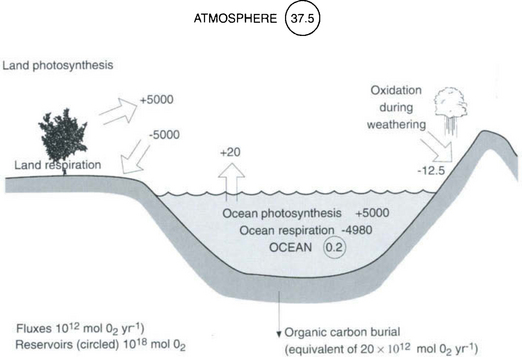
Fig. 16-9 The global oxygen balance. Ocean photosynthesis is estimated. Organic C fluxes are converted to oxygen fluxes using a stoichiometry of ΔO2/ΔOC = 1.5 in the marine environment and 1.1 on land. Oxygen consumption during weathering of C, S, and Fe in sedimentary rocks, in the ratio of 6:2:1, is. At steady state organic carbon burial and O2 consumption during weathering must be equal, which is certainly possible within the errors of these two estimates. from satellite color (Antoine et al., 1996). It is assumed that photosynthesis on land and in the ocean are about equal. The global carbon burial rate is from Hedges and Keil (1995) from Holland (1978)
The primary oxygen sink that balances the burial of organic matter in the sea is oxidative weathering of reduced compounds in sedimentary rocks. Organic matter dominates the reduced redox elements being oxidized in these rocks, but sulfide as pyrite and ferrous iron also play an important role. According to Holland (1978) the present rate of oxidation of reducing compounds of C, S2−, and Fe2+ in sedimentary rocks consumes 12.5 × 10¹² mol of O2 annually. Notably, both sulfide and reduced iron exist in sedimentary rocks because the oxidized forms of these compounds were reduced during anaerobic organic matter oxidation via equations (e) and (f) in Table 16-4 where the “proto” rocks were being formed. Thus, the reduced compounds in sedimentary rocks are either organic C or its proxy – elements reduced during the oxidation of organic carbon.
The oxygen budget in Fig. 16-9 is written using present estimates of oxygen produced via organic matter burial in the oceans and independently determined O2 consumption rates by sedimentary rock weathering reactions. In order for the atmospheric oxygen concentration to be stable over millions of years, these two quantities must balance. Given the certainty of these estimates there is remarkable agreement today, but why should this be so? Why does global respiration oxidize all but a small fraction of the photosynthetically produced organic matter, and why is its electron donor capacity almost exactly equal to that of rocks that were formed on average several 100 million years ago? What process keeps the global redox system in whack? One is forced to assume that there are feedback mechanisms among the concentration of oxygen in the atmosphere, the oxidation of reduced organic carbon, sulfur, and iron in sedimentary rocks and the burial of organic matter in marine sediments. This can be achieved if the oxidation reactions are dependent in some way on the oxygen concentration in the atmosphere. If all of the reduced elements in sedimentary rocks were not oxidized, then the burial of these compounds, would increase along with the flux of O2 to the atmosphere, and ultimately, the oxygen content of the atmosphere. The increased atmospheric oxygen concentration would then oxidize more of the reduced compounds bringing the system back to a steady state. By the same argument, a more efficient oxidation of all reducing compounds and the organic matter produced during photosynthesis, would decrease the net flux of oxygen to the atmosphere and ultimately the concentration of atmospheric O2, with the feedback of enhanced organic carbon burial. This argument is illustrated in Fig. 16-10 which is adapted from Holland (1978). The figure illustrates that the atmospheric oxygen concentration is poised between the processes of oxygen production and oxygen consumption. However, the details of the mechanisms controlling this delicate balance between organic matter production and oxidation, remain undiscovered. They represent one of the fascinating mysteries of the global redox processes.
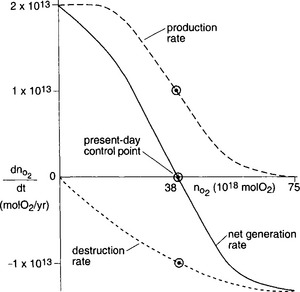
Fig. 16-10 A schematic representation of how the oxygen reduction and production rate, dnO2,/dt combine to determine the size of the global oxygen reservoir. (Adapted from Holland, 1978.)
16.4 Conclusion
Having reviewed the acid-base and redox balances of Earth, it is easy to see that they are both the consequences of the interaction of several biogeochemical cycles. In the case of the acid-base balances, the cycles of C, N, and S stand out, along with the hydrologic cycle. For the redox balances, C, N, O, S, and Fe, and Mn are the dominant cycles. Importantly, both acid-base and redox systems are heavily mediated by biota. Beyond these simple generalizations lie a number of still open scientific questions including the intriguing challenge to find the feedbacks that are involved in both systems. The stability of atmospheric O2 is an important case where feedbacks are likely, but many other examples can be presumed to exist.
Antoine, D., Andre, J. -M., Morel, A. Oceanic primary production, 2. Estimation at global scale from satellite (coastal zone color scanner) chlorophyll. Global Biogeochem. Cycles. 1996; 10:57–70.
Charlson, R. J., Rodhe, H. Factors controlling the acidity of natural rainwater. Nature. 1982; 295:683–685.
Davies, S. H. R., Mn(II) oxidation in the presence of metal oxides. PhD dissertation. California Institute of Technology, New York, 1985.
Davies, S., Morgan, J. J. Manganese (II) oxidation kinetics on metal oxide surfaces. J. Colloid Interface Sci. 1989; 129:63–77.
Emerson, S., Cranston, R., Liss, P. Redox species in a reducing fjord: Equilibrium and kinetic considerations. Deep-Sea Res. 1979; 26:859–878.
Froelich, P. M., Klinkhammer, G. P., Bender, M. L., et al. Early oxidation of organic matter in pelagic sediments of the eastern equatorial Atlantic; suboxic diagenesis. Geochem. Cosmochim. Acta. 1979; 43:1075–1090.
Hastings, D., Emerson, S. Oxidation of manganese by spores of a marine Bacillus: Kinetics and thermodynamic considerations. Geochem. Cosmochim. Acta. 1986; 50:1819–1824.
Hedges, J., Keil, R. Sedimentary organic matter preservation: an assessment and speculative synthesis. Marine Chem. 1995; 49:81–115.
Holland, H. The Chemistry of the Atmosphere and Oceans. Pasedena, California: Wiley Interscience; 1978.
Morgan, J. J. Chemical equilibria and kinetic properties of manganese in natural waters. In: Faust S. D., Hunter J. V., eds. Principles and Applications of Water Chemistry. New York: Wiley; 1967:561–623.
Sillén, L. G., Equilibrium Concepts in Natural Water Systems. Adv. Chem. Soc. ; 67. American Chemical Society, New York, 1967. 45–56.
Stumm, W., Morgan, J. J., Aquatic Chemistry. 1st edn. John Wiley and Sons, Washington, DC, 1970.
Stumm, W., Morgan, J. J., Aquatic Chemistry. 2nd edn. John Wiley and Sons, New York, 1981.
Taylor, G. S., Baker, M. B., Charlson, R. J. Heterogeneous interactions of the C, N, and S Cycles in the atmosphere: The role of aerosols and clouds. In: Bolin B., Cook R. B., eds. The Major Biogeochemical Cycles and their Interactions. New York: John Wiley and Sons, 1983.
Tebo, B., Emerson, S. Microbial manganese (II) oxidation in the marine environment: A quantitative study. Biogeochemistry. 1986; 2:149–161.
51-50 Twohy, C. H., Austin, P. H., Charlson, R. J. Chemical consequences of the initial diffusional growth of cloud droplets: a marine case. Tellus. 4(B), 1989.
von Langen, P. J., Johnson, K. S., Coale, K. H., et al. Oxidation kinetics of manganese (II) in seawater at nanomolar concentrations. Geochem. Cosmochim. Acta. 1997; 61:4945–4954.


 ]
] [HA] so that the plot of log [A−] vs. pH is a straight line on log-log paper. The same holds for systems with a fixed gas phase, e.g., CO2. Subsequently the concentrations of the dependent variables are plotted vs. pH, as in