The Oceans
The oceans play a major role in the global cycles of most elements. As is evident in images from space, most of the Earth’s surface is ocean. When viewed from space we see the oceans cover 71% of the Earth’s surface. The oceans are in interactive contact with the lithosphere, atmosphere, and biosphere, and virtually all elements pass through the ocean at some point in their cycles. Given sufficient time, the water and sediments of the ocean are the receptacle of most natural and anthropogenic elements and compounds. Transport processes across the ocean boundaries and within the ocean are central to studies of the global cycles. Such processes as air/sea exchange of gases and aerosols, biological production of particles within the sea, and sedimentation need to be considered. The productivity of the ocean and climate are influenced by wind-generated surface currents and thermohaline circulation in the deep ocean. The complicated and diverse processes in estuaries influence how much material of riverine origin reaches the sea. There is currently a great deal of concern about how people are affecting the ocean and climate processes. In order to make sound predictions for the future we need a solid understanding of present and past conditions and especially how the ocean-climate system responds to natural and anthropogenic changes in forcing.
The ocean is also by far the largest reservoir for most of the elements in the atmosphere-biosphere-ocean system. Perturbations caused by our increased population and industrialization are passing through the ocean, and because the time scale for ocean circulation is long (about 2000 years) relative to the time scale of modern society, a new steady state or quasi-equilibrium will be established slowly. Until that time, local concentrations of toxic chemicals, especially in estuaries and bays with restricted circulation, will be the major concern for mankind.
In this chapter we first review some of the basic descriptive aspects of the ocean and its physiographic domains and show briefly how the ocean fits into the global water balance. We then present a brief review of surface and abyssal ocean circulation. The superposition of the biological cycle on ocean circulation is what controls the distribution of a large number of elements within the ocean, so spatial variations and the stoichiometry of biological productivity and the transport of biologically produced particles are reviewed. Ocean sediments are the main site of deposition for most elements and thus they record the course of events over geological time. Sediments are considered in Chapter 8 and are not considered in detail here. Finally, we review the basic properties of ocean chemistry and attempt to classify the elements into groups according to the mechanisms that control their distribution.
10.1 What is the Ocean?
The topography and structure of the ocean floor are highly variable from place to place and reflect tectonic processes within the Earth’s interior. These features have varied in the past so that the ocean bottom of today is undoubtedly not like the ocean bottom of 50 million years ago. The major topographic systems, common to all oceans, are continental margins, ocean-basin floors, and oceanic ridge systems. Tectonic features such as fracture zones, plateaus, trenches, and mid-ocean ridges act to subdivide the main oceans into a larger number of smaller basins.
Mapping the sea floor using ships is a tedious process. The newest bathometric maps of the global oceans with horizontal resolution of 1 to 12 km have been derived by combining available depth soundings with high-resolution marine gravity data from the Geosat and ERS-1 spacecraft (Smith and Sandwell, 1997). Marine gravity anomalies are caused primarily by topographic variations on the ocean floor. This remote-sensing approach reveals all the intermediate and large-scale structures of the ocean basins ( Plate 4) including incised canyons on continental margins, spreading ridges, fracture zones, and seamounts. This approach has led to discovery of previously unknown features in remote locations.
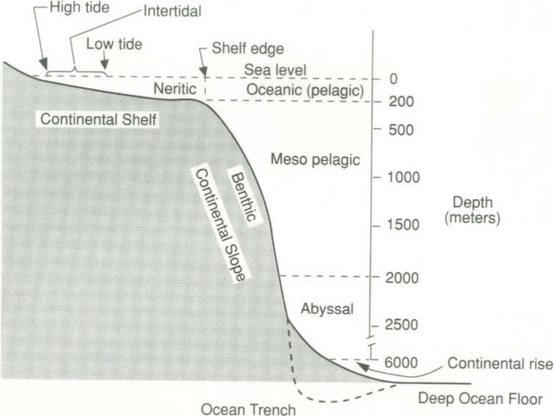
The continental margin regions are the transition zones between continents and ocean basins. The major features at ocean margins are shown schematically in Fig. 10-1. Though the features may vary, the general features shown occur in all ocean basins in the form of either two sequences: shelf-slope-rise-basin or shelf-slope-trench-basin. The continental shelf is the submerged continuation of the adjacent land, modified in part by marine erosion or sediment deposition. The seaward edge of the continental shelf can frequently be clearly seen and it is called the shelf break. The shelf break tends to occur at a depth of about 200 m over most of the ocean. Sea level was 121 ± 5 m lower during Pleistocene glacial maxima (Fairbanks, 1989). At those times the shoreline was at the edge of present continental shelf, which was then a coastal plain. On average, the continental shelf is about 70 km wide, although it can vary widely (compare the east coast of China with the west coast of Peru). The Arctic Ocean has the largest proportion of shelf to total area of all the world’s oceans. The continental slope is characterized as the region where the gradient of the topography changes from 1:1000 on the shelf to greater than 1:40. Thus continental slopes are the relatively narrow, steeply inclined submerged edges of the continents. The continental slope may form one side of an ocean trench as it does off the west coast of Mexico or Peru or it may grade into the continental rise as it does off the east coast of the US. The ocean trenches are the topographic reflection of subduction of oceanic plates beneath the continents. The greatest ocean depths occur in such trenches. The deepest is the Challenger Deep which descends to 11 035 m in the Marianas Trench. The continental rises are mainly depositional features that are the result of coalescing of thick wedges of sedimentary deposits carried by turbidity currents down the slope and along the margin by boundary currents. Deposition is caused by reduction in current speed when it flows out onto the gently sloping rise. Gradually the continental rise grades into ocean basins and abyssal plains.
The relationships between ocean depths and land elevations are shown in Fig. 10-2. On the average continents are 840 m above sea level, while the average depth of the oceans is 3730 m. If the Earth were a smooth sphere with the land planed off to fill the ocean basins the earth would be uniformly covered by water to a depth of 2430 m.
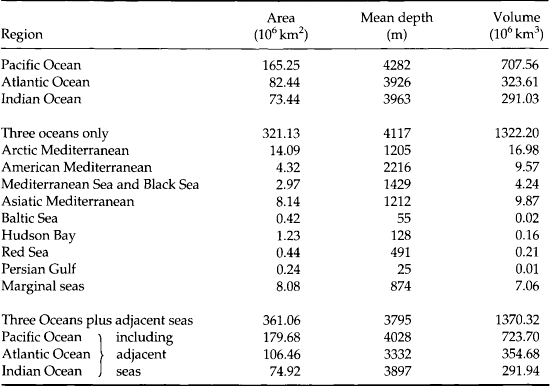
The area, volume and average depth of the ocean basins and some marginal seas are given in Table 10-1. The Pacific Ocean is the largest and contains more than one-half of the Earth’s water. It also receives the least river water per area of the major oceans (Table 10-2). Paradoxically it is also the least salty (Table 10-3). The land area of the entire Earth is strongly skewed toward the northern hemisphere.
Table 10-2
A breakdown of the water balance for the four main ocean basins (cm/yr for the area of the respective basins)a

aFrom M. I. Budyko (1958). “The Heat Balance of the Earth’s Surface” (Trans. N. A. Stepanova). Office of Technical Services, Department of Commerce, Washington.
Table 10-3
Average temperatures and salinity of the oceans, excluding adjacent seasa
| Temperature (C) | Salinity (parts per thousand) | |
| Pacific (total) | 3.14 | 34.60 |
| North Pacific | 3.13 | 34.57 |
| South Pacific | 3.50 | 34.63 |
| Indian (total) | 3.88 | 34.78 |
| Atlantic (total) | 3.99 | 34.92 |
| North Atlantic | 5.08 | 35.09S |
| South Atlantic | 3.81 | 34.84 |
| Southern Oceanb | 0.71 | 34.65 |
| World ocean (total) | 3.51 | 34.72 |
aAfter L. V. Worthington (1981). The water masses of the world ocean: some results of a fine-scale census. In “Evolution of Physical Oceanography” (B. A. Warren and C. Wunsch, eds), pp. 42–69. MIT Press, Cambridge, MA.
The ocean contains the bulk of the Earth’s water (1.37 × 1024 g) and moderates the global water cycle. The distribution of the mass of water is about 80% in the ocean and about 20% as pore water in sediments and sedimentary rocks. The reservoir of water in rivers, lakes, and the atmosphere is trivial (0.003%). Disregarding the pore water because it is not in free circulation, we find that 97% of the world’s cycling water is in the ocean (Table 10-4). The average residence time of water in the atmosphere with respect to net transfer (evaporation minus precipitation over oceans) from the oceans to the continents is about one third of a year (0.13 × 10²⁰ g/(3.83 – 3.47 × 10²⁰ g/yr) = 0.33 yr). The ocean’s role in controlling the water content of the atmosphere has important implications for past and present climates of the Earth. One of the possible positive feedbacks of global warming will be increased atmospheric water content resulting from warming of the sea surface.
Table 10-4
A detailed breakdown of the water volume in various reservoirsa
| Environment | Water volume (103 km3) | Percentage of total |
| Surface water | ||
| Freshwater lakes | 125 | 0.009 |
| Saline lakes and inland seas | 104 | 0.008 |
| Rivers and streams | 1.3 | 0.0001 |
| Total | 230 | 0.017 |
| Subsurface water | ||
| Soil moisture | 67 | 0.005 |
| Ground water | 8000 | 0.62 |
| Total | 8067 | 0.625 |
| Ice caps and glaciers | 29,000 | 2.15 |
| Atmosphere | 13 | 0.001 |
| Oceans | 1,330,000 | 97.2 |
| Totals (approx.) | 1,364,000 | 100 |
aData from Berner and Berner (1987).
10.2 Ocean Circulation
The chemistry and biology of the ocean are superimposed on the ocean’s circulation, thus it is important to review briefly the forces driving this circulation and give some estimates of the transport rates. There are many reasons why it is important to understand the basics of the circulation. Four examples are given as an illustration.
1. Poleward-flowing, warm, surface, western boundary currents such as the Gulf Stream and the Kuroshiro have a profound effect on the sea-surface temperature (SST) and the climate of land areas bordering the oceans. For example, the Gulf Stream transports approximately 3.2 PW of heat to the North Atlantic (Hartmann, 1994), moderating the climate of northern Europe.
2. The El-Niño southern oscillation (ENSO) phenomenon is an interannual perturbation of the climate system characterized by a periodic weakening of the trade winds and warming of the surface water in the central and eastern equatorial Pacific Ocean. The impacts of ENSO are felt worldwide through disruption of atmospheric circulation and weather patterns (McPhaden, 1993; Wallace et al., 1998).
3. Atmospheric testing of nuclear bombs resulted in contamination of the surface of the ocean with various isotopes including 14C, 3H, 90Sr, 239Pu, and 240Pu. These isotopes are slowly being mixed through the ocean and can be used as radioactive dyes and clocks (e.g. Broecker and Peng, 1982).
4. The atmospheric CO2 concentration has been increasing since the beginning of the industrial age, but the increase (∼3.2 Gt C/yr) is less than anthropogenic emissions and deforestation (∼7.0 Gt C/yr) (Siegenthaler and Sarmiento, 1993). Some of the CO2 has gone into the ocean (∼2Gt C/yr). All CO2 taken up by the ocean is by the process of gas exchange. Some of the excess CO2 has been transported into the intermediate and deep water by the subduction of water masses. Circulation replenishes the surface with water undersaturated with respect to the anthropogenically perturbed CO2 levels.
In this section we briefly review what controls the density of seawater and the vertical density stratification of the ocean. Surface currents, abyssal circulation, and thermocline circulation are considered individually.
10.2.1 Density Stratification in the Ocean
The density of seawater is controlled by its salt content or salinity and its temperature. Salinity is historically defined as the total salt content of seawater and the units were given as grams of salt per kilogram of seawater or parts per thousand (%o). Salinity was expressed on a mass of seawater basis because mass, rather than volume, is conserved as temperature and pressure change. In modern oceanography salinity is determined as a conductivity ratio on the practical salinity scale and has no units (Millero, 1993). For more details on the formal definition of salinity and on the preparation of very accurate standards see UNESCO (1981). The salinity of surface seawater is controlled primarily by the balance between evaporation and precipitation. As a result the highest salinities are found in the subtropical central gyre regions centered at about 20° North and 20° South, where evaporation is extensive but rainfall is minimal. Surprisingly, they are not found at the equator where evaporation is large, but so is rainfall.
The temperature of seawater is fixed at the sea surface by heat exchange with the atmosphere. The average incoming energy from the sun at the Earth’s surface is about four times higher at the equator than at the poles. The average infrared radiation heat loss to space is more constant with latitude. As a result there is a net input of heat into the tropical regions and this is where we find the warmest surface seawater. Heat is transferred from low to high latitudes by winds in the atmosphere and by currents in the ocean. The geothermal heat flux from the interior of the Earth is generally insignificant except in the vicinity of hydrothermal vents at spreading ridges and in relatively stagnant locations like the abyssal northern North Pacific (Joyce et al., 1986) and the Black Sea (Murray et al., 1991).
Because seawater signatures of temperature and salinity are acquired by processes occurring at the air–sea interface we can also state that the density characteristics of a parcel of seawater are determined when it is at the sea surface. This density signature is locked into the water when it sinks. The density will be modified by mixing with other parcels of water but if the density signatures of all the end member water masses are known, this mixing can be unraveled and the proportions of the different source waters to a given parcel can be determined.
To a first approximation the vertical density distribution of the ocean can be described as a three-layered structure. The surface layer is the region from the sea surface to the depth having a temperature of about 10°C. The transition region where the temperature decreases from 10°C to 4°C is called the thermocline. The deep sea is the region below the thermocline.
Because temperature (T) and salinity (S) are the main factors controlling density, oceanographers use T–S diagrams to describe the features of the different water masses. The average temperature and salinity of the world ocean and various parts of the ocean are given in Fig. 10-3 and Table 10-3. The North Atlantic contains the warmest and saltiest water of the major oceans. The Southern Ocean (the region around Antarctica) is the coldest and the North Pacific has the lowest average salinity.
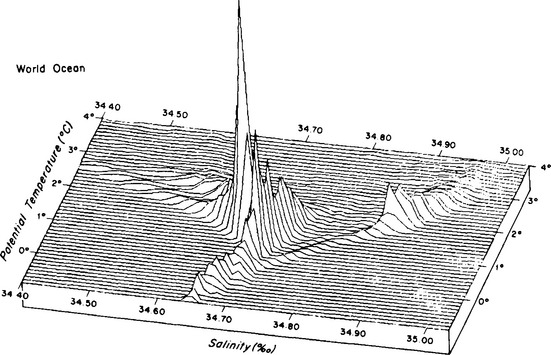
Fig. 10-3 Simulated three-dimensional T–S diagram of the water masses of the world ocean. Apparent elevation is proportional to volume. Elevation of highest peak corresponds to 26.0 × 10⁶ km3 per bivariate class 0.1°C × 0.01%o. (Reproduced with permission from L. V. Worthington, The water masses of the world ocean: some results of a fine-scale census. In B. A. Warren and C. Wunsch (1981). “Evaluation of Physical Oceanography,” MIT Press, Cambridge, MA.)
Conventional T–S diagrams for specific locations in the individual oceans are shown in Fig. 10-4. The inflections in the curves reflect the inputs of water from different sources. The linear regions represent mixing intervals between these core sources. For example, in the Atlantic Ocean the curves reflect input from Antarctic Bottom Water (AABW), North Atlantic Deep Water (NADW), Antarctic Intermediate Water (AIW), Mediterranean Water (MW), and Warm Surface Water (WSW).
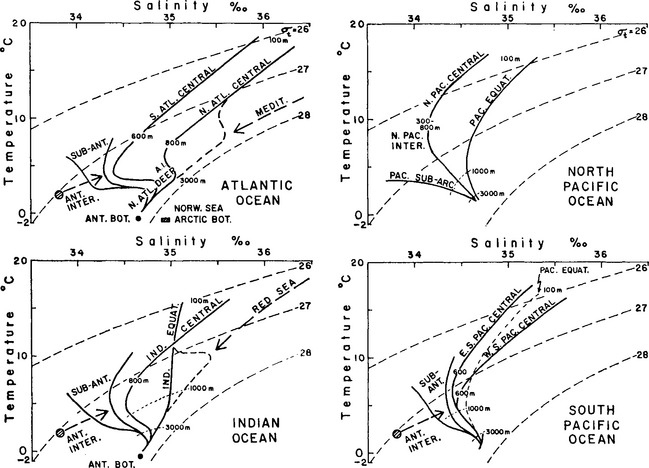
Fig. 10-4 Average temperature/salinity diagrams for the main water masses of the Atlantic, Indian, and Pacific Oceans. (Reproduced with permission from G. L. Pickard and W. J. Emery (1982). “Descriptive Physical Oceanography,” pp. 138–139, Pergamon Press.)
10.2.2 Surface Currents
Surface ocean currents respond primarily to the climatic wind field. The prevailing winds supply much of the energy that drives surface water movements. This becomes clear when charts of the surface winds and ocean surface currents are superimposed. The wind-driven circulation occurs principally in the upper few hundred meters and is therefore primarily a horizontal circulation although vertical motions can be induced when the geometry of surface circulation results in convergences (downwelling) or divergences (upwelling). The depth to which the surface circulation penetrates is dependent on the water column stratification. In the equatorial region the currents extend to 300–500 m while in the circumpolar region where stratification is weak the surface circulation can extend to the sea floor.
The net direction of motion of water is not always the same as the wind, because other factors come into play. These are shown schematically in Fig. 10-5. The wind blowing across the sea surface drags the surface along and sets this thin layer in motion. The surface drags the next layer and the process continues downward, involving successively deeper layers. As a result of friction between the layers each deeper layer moves more slowly than the one above and its motion is deflected to the right (clockwise) in the northern hemisphere by the Coriolis force (see Chapter 7). If this effect is represented by arrows (vectors) whose direction indicates current direction and length indicates speed, the change in current direction and speed with depth forms a spiral. This feature is called the Ekman spiral. If the wind blew continuously in one direction for a few days a well-developed Ekman spiral would develop. Under these conditions the integrated net transport over the entire depth of the Ekman spiral would be at 90° to the right of the wind direction (right in the northern hemisphere and left in the southern hemisphere). Normally the wind direction is variable so that the actual net transport is some angle less than 90°.
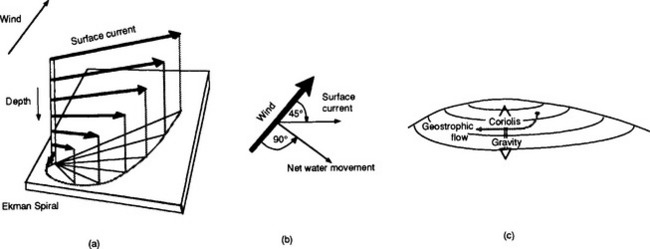
Fig. 10-5 Sketch of (a) current vectors with depth characteristic of an Eckman spiral; (b) relationship between wind, surface current, and net water movement vectors; and (c) production of circular gyres from the net interaction of the Coriolis force and Eckman transport.
As a result of Ekman transport, changes in sea-surface topography and the Coriolis force combine to form geostrophic currents. Take the North Pacific for example. The westerlies at ∼40°N and the northeast trades (∼10°N) set the North Pacific Current and North Equatorial Current in motion as a circular gyre. Because of the Ekman drift, surface water is pushed toward the center of the gyre (∼25°N) and piles up to form a sea-surface “topographic high.” As a result of the elevated sea surface, water tends to flow “downhill” in response to gravity. As it flows, however, the Coriolis force deflects the water to the right (in the northern hemisphere). When the current is constant and results from balance between the pressure gradient force due to the elevated seasurface and the Coriolis force, the flow is said to be in geostrophic balance. The actual flow is then nearly parallel to the contours of the elevated seasurface and clockwise. The seasurface topography of the Pacific Ocean was determined by Tai and Wunsch (1983) from satellite altimetry. The absolute elevation of the subtropical gyre can be clearly seen and fits the schematic description given above.
As a result of these factors (wind, Ekman transport, Coriolis force) the surface ocean circulation in the mid-latitudes is characterized by clockwise gyres in the northern hemisphere and the counterclockwise gyres in the southern hemisphere. The main surface currents around these gyres for the world’s oceans are shown in Fig. 10-6. The regions where Ekman transport tends to push water together are called convergences. Divergences result when surface waters are pushed apart.
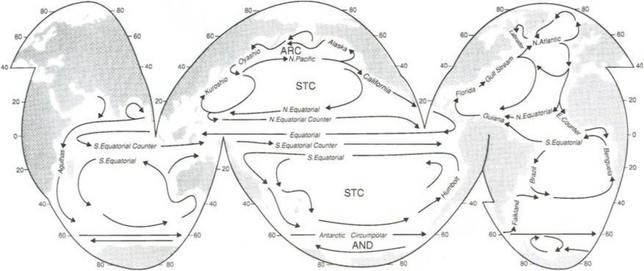
Fig. 10-6 Global map of major ocean currents. AND = Antarctic Divergence; STC = subtropical convergence; ARC = Arctic convergence.
Total transport by the surface currents varies greatly and reflects the mean currents and cross-sectional area. Some representative examples will illustrate the scale. The transport around the subtropical gyre in the North Pacific is about 70 Sv (1 Sverdrup or Sv = 1 × 10⁶ m3/s). The Gulf Stream, which is a major northward flow off the east coast of North America, increases from 30 Sv in the Florida Straits to 150 Sv at 64°30’W, or 2000 km downstream.
10.2.3 El Niño Southern Oscillation (ENSO)
The equatorial Pacific is one of the best-studied regions of ocean divergence (Philander, 1990; McPhaden et al., 1998). This is because of the ENSO phenomenon. The region around the equator normally experiences strong easterly trade winds that result in divergence from the equator and upwelling of colder, nutrient-rich water from below (Fig. 10-7). This “cold-tongue” typically extends from the coast of South America to about the date line (180°). These trade winds also drive near-equatorial surface flow westward as the South Equatorial Current (SEC). This piles up warm surface water in the western Pacific to create a deep warm pool and results in depression of the depth of the thermocline from east to west. The westward flow in the surface SEC is partly compensated by a return flow to the east in the thermocline (∼150m) called the Equatorial Undercurrent (EUC).
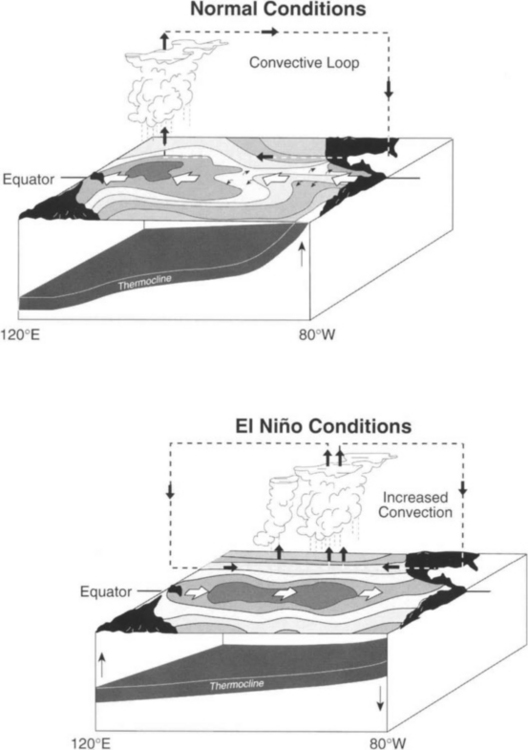
Fig. 10-7 Schematic of normal and El Niño conditions in the equatorial Pacific. (Figure kindly provided by Dr Michael McPhaden of NOAA.)
There is a zonal atmospheric circulation system associated with this normal ocean condition called the Walker Cell (Fig. 10-7). Evaporation rates are high over the warm pool and warm moist air ascends to great heights (deep convection) producing extensive cloud systems and rain. The Walker Cell is closed by westerly winds aloft and subsidence in the high-pressure zone of the eastern Pacific.
During El Niño (Fig. 10-7) the trade winds weaken, and even reverse, in the central and western Pacific resulting in a local eastward acceleration of the surface currents. Westerly wind events in the western Pacific excite downwelling equatorial Kelvin waves which propagate into the eastern equatorial Pacific where they depress the thermocline (Kessler and McPhaden, 1995) (Fig. 10-7). The winds in the eastern Pacific are usually still easterly favoring upwelling, but because the thermocline is depressed, warmer water is upwelled. The net result is migration of the “warm pool” and its associated atmospheric deep convection from the western Pacific to east of the date line (Fig. 10-7). Anomalously warm sea-surface temperatures occur from the coast of South America to the date line.
Deep convergence in the atmosphere is the main driving force for atmospheric circulation through the release of latent heat at mid-tropospheric levels. The zonal shift in the site of deep convection during El Niño affects atmospheric circulation and climate on a global basis (Wallace et al., 1998). The variations in the upwelling also influence the flux of CO2 from the ocean to the atmosphere (Feely et al., 1997) and the biological characteristics of the region (Murray et al., 1994).
10.2.4 Thermocline Circulation
The transition region between the surface and deep ocean is referred to as the thermocline. This is also a pycnocline zone where the density increases appreciably with increasing depth. Most of the density change results from the decrease in temperature (hence thermocline).
A simple but physically realistic model based on lateral transport has evolved to explain the origin of the thermocline. According to this view, the interior of the ocean is ventilated by rapid mixing and advection along isopycnal surfaces (Jenkins, 1980). The density surfaces that lie in the thermocline at 200 to 1000 m in the equatorial region shoal and outcrop at high latitudes. The argument is that water acquires its T and S (and chemical tracer) signature while at the sea surface and then sinks and is transported horizontally as shown in Fig. 10-8. A map showing the winter outcrops of isopycnal surfaces in the North Atlantic Ocean is shown in Fig. 10-9. Characteristic values of the horizontal eddy diffusion coefficient (K) are of the order of 107 cm2/s. Assuming a distance (L) of the order of 2000 km (30°) and assuming the characteristic time is τ = L2/K, we obtain a characteristic ventilation time for the main thermocline of about 130 years.
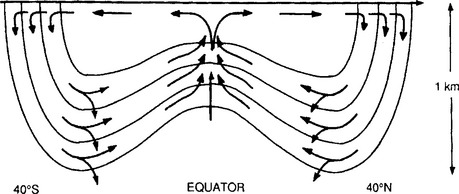
Fig. 10-8 The pathways followed by the water ventilating the main oceanic thermocline. (Reproduced with permission from W. S. Broecker and T.-H. Peng (1982). “Tracers in the Sea,” p. 440, Eldigio Press, Palisades, NY.)
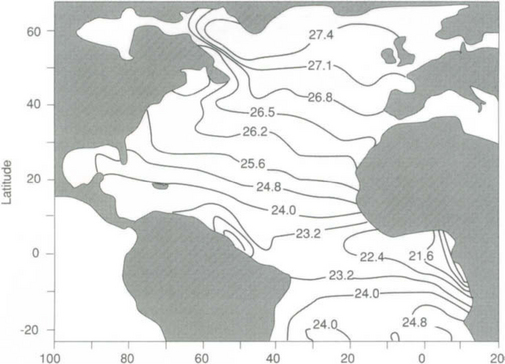
Fig. 10-9 Map of winter outcrops of isopycnal surfaces in the Atlantic Ocean. (Modified with permission from W. S. Broecker and T.-H. Peng (1982). “Tracers in the Sea,” p. 394, Eldigio Press, Palisades, NY.)
The horizontal isopycnal thermocline model is important for the problem of determining the fate of the excess atmospheric CO2. The increase of CO2 in the atmosphere is modulated by transport of excess CO2 from the atmosphere into the interior of the ocean. The direct ventilation of the thermocline in its outcropping regions at high latitudes plays an important role in removing CO2 from the atmosphere (Brewer, 1978; Siegenthaler and Sarmiento, 1993).
Nuclear bomb produced 14CO2 and 3H (as HTO) have been used to describe and model this rapid thermocline ventilation (Ostlund et al., 1974; Sarmiento et al., 1982; Fine et al., 1983). For example, changes in the distributions of tritium (Rooth and Ostlund, 1972) in the western Atlantic between 1972 (GEOSECS) and 1981 (TTO) are shown in Fig. 10-10 (Ostlund and Fine, 1979; Baes and Mulholland, 1985). In the 10 years following the atmospheric bomb tests of the early 1960s, a massive penetration of 3H (tritium) into the thermocline has occurred at all depths. Comparison of the GEOSECS and TTO data, which have a 9 year time difference, clearly shows the rapid ventilation of the North Atlantic and the value of such “transient” tracers. A similar transient effect can be seen in the penetrative distribution of manmade chlorofluorocarbons, which have been released over a longer period (40 years) (Gammon et al., 1982).
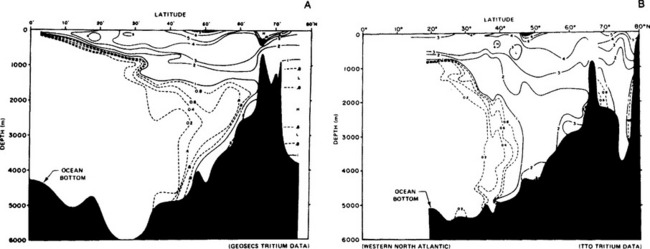
Fig. 10-10 Tritium section of the western Atlantic from 80°N to the equator versus depth (m). Vertical exaggeration is 2000:1. Horizontal scale is proportional to cruise track. (Reproduced with permission from H. G. Ostland and R. A. Fine (1979). Oceanic distribution and transport of tritium. In “Behaviour of Tritium in the Environment” (Proceedings of a Symposium, San Francisco, 16–20 October 1978, IAEA-SM-232/67, pp. 303–314. International Atomic Energy Agency, Vienna.)
10.2.5 Abyssal Circulation
The circulation of the deep ocean below the thermocline is referred to as abyssal circulation. The currents are slow and difficult to measure but the pattern of circulation can be clearly seen in the properties of the abyssal water. For example, the water of lowest temperature in the water column is usually the densest and lies deepest. As a result, charts of the bottom water temperature have been useful in describing the pattern of the abyssal circulation (e.g., Mantyla, 1975; Mantyla and Reid, 1983). The topography of the sea floor plays an important role in constraining the circulation and much of the abyssal flow is funneled through passages such as the Denmark Straight, Gibbs Fracture Zone, Vema Channel, Samoan Passage, and Drake Passage.
A requirement of the heat balance for a steady-state ocean is that the input of new cold abyssal water (Antarctic Bottom Water and North Atlantic Deep Water) sinking in the high-latitude regions must be balanced by input of heat by geothermal heating (heat flow from the Earth), downward convection of relatively warm water (e.g., from the Mediterranean) and downward diffusion of heat across the thermocline. A general mass balance of the world’s oceans requires that the water sinking in the polar regions must be exactly balanced by upwelling of water from the abyssal ocean to the surface water. A combination of the mass and heat balances together with the forcing of the wind and the effect of a rotating Earth determine the nature of the abyssal circulation.
10.2.6 The Ocean Conveyor Belt
The ocean conveyor belt is one of the major elements of today’s ocean circulation system (Broecker, 1997). A key feature is that it delivers an enormous amount of heat to the North Atlantic and this has profound implications for past, present, and probably future climates.
The conveyor belt is shown schematically in Fig. 10-11. Warm and salty surface currents in the western North Atlantic (e.g., the Gulf Stream) transport heat to the Norwegian–Greenland Seas where it is transferred to the atmosphere. This heat helps moderate the climate of northern Europe. The cooling increases the density resulting in formation of the now cold and salty North Atlantic Deep Water (NADW) (Worthington, 1970). The NADW travels south through the North and South Atlantic and then joins the Circumpolar Current that travels virtually unimpeded in a clockwise direction around the Antarctic Continent.
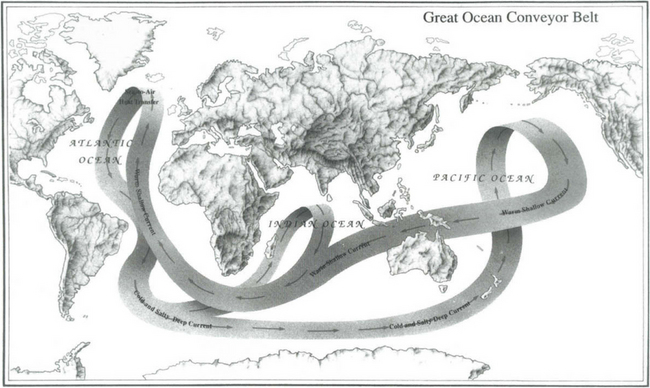
Fig. 10-11 Schematic of the ocean “conveyor belt” from Broecker (1991). (Reproduced with permission of the illustrator, Joe Le Monnier.)
Deep water also forms along the margins of Antartica and feeds the Circumpolar Current. The Weddell Sea, because of its very low temperature, is the main source of Antarctic Bottom Water (AABW) which flows northward at the very bottom into the South Atlantic, and then through the Vema Channel in the Rio Grande Rise into the North Atlantic. It ultimately returns southward as part of the NADW.
The Circumpolar Current is a blend of waters of North Atlantic (∼47%) and Antarctic margin (∼53%) origin (Broecker, 1997). This current is referred to as the Pacific Common Water and is the source of deep water to the Indian and Pacific Oceans. Deep water does not form in a similar way in the North Pacific because the salinity is too low (Warren, 1983). Pacific Common Water enters the Pacific in the southwest corner and flows north along the western boundary of the Tonga Trench. The abyssal circulation model of Stommel (1958) and Stommel and Arons (1960) predicted that deep waters flow most intensely along the western boundaries in all oceans and gradually circulate into the interior as allowed by topography. Most of the northward abyssal flow passes from the southwest Pacific to the north central Pacific through the Samoan Passage, located west of Samoa. In the North Pacific, the abyssal flow splits and goes west and east of the Hawaiian Islands. These flows meet again north of Hawaii where they mix, upwell and flow back to the South Pacific at mid-depths.
The conveyor belt is completed by return flow of surface water from the Pacific to the Atlantic. There are two main paths of this return flow, which amounts to about 19 Sv. Some passes through the Indonesian Archipelago, the Indian Ocean and around the tip of South Africa via the Agulhas Current (Gordon, 1985). Some enters the South Atlantic via the Drake Passage. Based on the salt budget, Broecker (1991) argued that the Drake Passage route transports about 50% more than the Agulhas Current. Finally there is a small transport (about 1 Sv) from the Pacific to the Atlantic through the Bering Strait.
The salt budget for the Atlantic, which is determined in part by the flux of freshwater through the atmosphere, drives the conveyor belt and can explain how it has varied in the past. At present there appears to be a net water vapor loss of about 0.32 Sv (greater than the flow of the Amazon) from the Atlantic to the Pacific. The NADW transports about 16.3 Sv of water with a salinity of 34.91. This is produced from 15 Sv of Gulf Stream water with a salinity of 35.8, 1 Sv of transport from the Bering Straits with S = 32 and a net excess of river inflow and rainfall over evaporation of about 0.3 Sv (Zauker and Broecker, 1992). It is easy to show that small changes in the freshwater budget can have a significant impact. For example, if the excess of precipitation plus runoff over evaporation increased by 50% to 0.45 Sv, the salt content of the NADW would decrease to 34.59. In order to compensate for the resulting reduction in density the water would have to be cooled by an additional 1.4°C and the conveyor would have to more than double its flow to restore the salt balance (Broecker, 1997). Model simulations have also shown that the oceans’ thermohaline circulation is extremely sensitive to freshwater input (Manabe and Stouffer, 1995).
Although the general circulation patterns are fairly well known, it is difficult to quantify the rates of the various flows. Abyssal circulation is generally quite slow and variable on short time scales. The calculation of the rate of formation of abyssal water is also fraught with uncertainty. Probably the most promising means of assigning the time dimension to oceanic processes is through the study of the distribution of radioactive chemical tracers. Difficulties associated with the interpretation of radioactive tracer distributions lie both in the models used, non-conservative interactions, and the difference between the time scale of the physical transport phenomenon and the mean life of the tracer.
An example of the power of such tracers is in the “dating” of abyssal water using 14C. 14C has an atmospheric source and a half-life of 5720 years. Stuiver et al. (1983) measured the 14C distribution in dissolved inorganic carbon in deep samples from major ocean basins (Fig. 10-12). These data were used to calibrate a box model which indicated that the replacement times for Atlantic, Indian, and Pacific Ocean deep waters (depths > 1500 m) are 275, 250, and 510 years respectively.
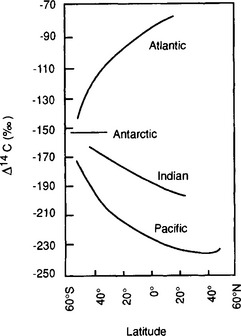
Fig. 10-12 The Δ14C values of the cores of the North Atlantic, Pacific, and Indian Ocean deep waters. The oldest waters are encountered near 40°N in the Pacific Ocean. (Modified with permission from M. Stuiver et al. (1983). Abyssal water carbon-14 distribution and the age of the world oceans, Science 219: 849–851, the AAAS.)
The present form of the conveyor belt appears to have been initiated by closure of the Panamanian seaway between the North and South American continents (Keigwin, 1982; Maier-Reimer et al., 1990). Geologic evidence indicates that gradual closing of the Isthmus of Panama lasted from 13 to 1.9 Myr ago. Paleoceanographic records indicate that closure was sufficient by 4.6 Myr ago to cause a marked reorganization of ocean circulation (Burton et al., 1997; Haug and Tiedemann, 1998). At this time the Gulf Stream intensified resulting in the transport of warm water to high latitudes. As a result NADW formation intensified and increased atmospheric moisture input to high latitudes helped trigger the growth of northern hemispheric ice sheets.
There is strong evidence that the conveyor belt has switched regularly from one mode of operation to another in the past. The associated changes in climate have been large, abrupt and global (Denton and Hendy, 1994). The changes appear to be driven by factors controlling the density of high-latitude North Atlantic surface water. These events appear to have been triggered by an increase in iceberg input, mainly from Canada (Bond et al., 1992). These icebergs transport terrigenous debris across the North Atlantic. When they melt they deposit a layer of ice rafted material on the sea floor. These periodic events in the geologic record are called Heinrich events (Broecker, 1994; Bond et al., 1997). The input of freshwater reduces the density of surface seawater and reduces production of NADW thus shutting down the present mode of the conveyor belt. The timing of these events has been perfectly preserved in the sediments of the North Atlantic from as far away as the Santa Barbara Basin (Behl and Kennett, 1996). At the time of these events the climate cools both at high latitudes and globally.
The climate records in Greenland ice reveal that over the past 60 000 years conditions switched back and forth between intense cold and moderate cold on a time scale of a few thousand years. These so-called Dansgaard–Oeschger cycles are characterized by abrupt changes in temperature, dust content, ice accumulation rate, methane concentration, and CO2 content. The onset of these cold events occurred on time scales as short as a few decades to a few years (Alley et al., 1993). Each period of intense cold has been matched by an ice-rafting event in North Atlantic sediments. As a result of the switch to a colder climate, iceberg production slows and the salinity of the north Atlantic surface water slowly increases enabling NADW formation to occur again. The return to the warm phase occurs much more slowly, over a 1000 year time frame. These cyclic events appear to have continued in the Holocene, although with much muted amplitude (Alley et al., 1997).
There is great concern that one of the effects of global warming could be reduction in formation of NADW and associated reorganization of the conveyor-belt circulation (Manabe and Stouffer, 1995). The consequences of global warming will be to warm surface seawater and to intensify the hydrologic cycle. Both factors will make it more difficult to form deep water and could lead to an “anthropogenically” induced climate shift. Paradoxically, global warming could result in climate cooling for northern Europe.
10.3 Biological Processes
Almost all elements in the periodic table are involved in at least one way or another in the biological cycle of the ocean. Many elements are essential or required nutrients. Others are carried along as passive participants. In either case the rates of biological processes need to be known.
10.3.1 The RKR Model
Essentially all organic matter in the ocean is ultimately derived from inorganic starting materials (nutrients) converted by photosynthetic algae into biomass. A generalized model for the production of plankton biomass from nutrients in seawater was presented by Redfield, Ketchum and Richards (1963). The schematic “RKR” equation is given below:
This equation was originally proposed for “average” plankton, a category that included both zooplankton and phytoplankton. This mean elemental ratio of C/N/P = 106/16/1 by atoms is highly conserved (Falkowski et al., 1998) and reflects the average biochemical composition of marine phytoplankton and their early degradation products.
The following characteristics of the RKR reaction should be noted:
1. This is an organic redox reaction. Carbon in CO2 and nitrogen in HNO3 are reduced by oxygen from water as the oxygen in these compounds is oxidized to O2. Only phosphorus does not undergo any change in oxidation state.
2. The reaction is endothermic. Energy from sunlight is stored in the form of high-energy C–C bonds (e.g., organic biomass) and O2, the raw materials for the support of heterotrophic organisms dependent upon the food source.
3. This is not a reversible reaction in the strict sense and does not spontaneously seek equilibrium between products and reactants. The exothermic reverse reaction, respiration, occurs in a different part of phytoplankton cells or is mediated by heterotrophic organisms.
4. Inasmuch as the RKR model is a generalization, specific exceptions should be expected. The most important exceptions relate to growth conditions that can affect the stoichiometry of nutrient incorporation into plankton biomass. During respiration, the reverse reaction occurs and nutrients are regenerated. Phosphorus tends to be regenerated preferentially relative to nitrogen which is preferentially regenerated relative to carbon. Recent interpretation of data along constant density surfaces in the Atlantic suggests that the regeneration ratios of P:N:C:O2 are about 1:16:117:170, slightly different than the RKR ratios (Takahashi et al., 1985; Anderson and Sarmiento, 1994).
10.3.2 Food Web Concepts
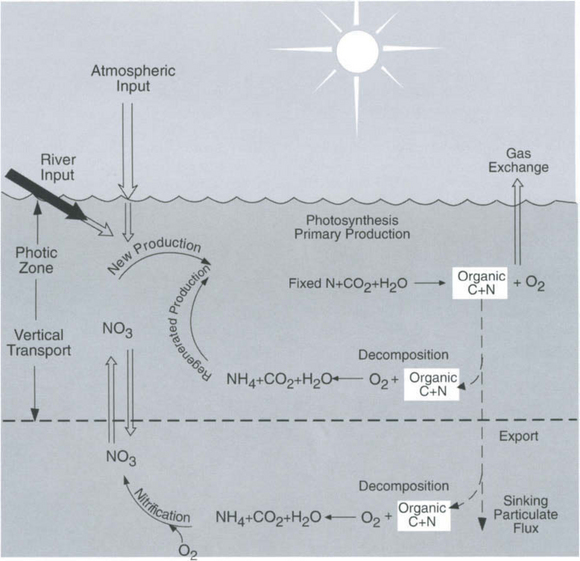
A schematic representation of biological process in the marine euphotic zone is shown in Fig.10-13. The links between the cycling of C, N, and O2 are indicated. Total primary production is composed of two parts. The production driven by new nutrient input to the euphotic zone is called new production (Dugdale and Goering, 1967). New production is mainly in the form of the upward flux of nitrate from below but river and atmospheric input and nitrogen fixation (Karl et al., 1997) are other possible sources. Other forms of nitrogen such as nitrite, ammonia, and urea may also be important under certain situations. The “new” nitrate is used to produce plankton protoplasm and oxygen according to the RKR equation. Some of the plant material produced is respired in the euphotic zone due to the combined effortsof zooplankton grazing and bacterial respiration. Oxygen is consumed and organic-N is released as ammonia according to
The released ammonia is preferentially taken up by phytoplankton relative to nitrate (Dortch, 1990) to drive regenerated production. The f-ratio is used to describe the relative amounts of new and regenerated production (Dugdale and Goering, 1967) where
The f-ratio typically varies from values as low as 0.03 to 0.30 in the open ocean (e.g., McCarthy et al., 1996) to values greater than 0.80 in the coastal ocean (Platt and Harrison, 1985).
If we define the sum of new plus regenerated production as gross production(P) and the difference of gross minus regenerated production as net production(P – R) then we can also express
Specific examples of marine ecosystem models can be seen in Frost (1987), Fasham et al. (1990), Frost and Franzen (1992), and Loukos et al. (1997).
As shown in Fig. 10-13, there is also a flux of O2 produced during net photosynthesis from the ocean to the atmosphere and an export flux of particulate and dissolved organic matter out of the euphotic zone. For a steady-state system, new production should equal the flux of O2 to the atmosphere and the export of organic carbon (Eppley and Peterson, 1979) (when all are expressed in the same units, e.g., moles of carbon). Such an ideal state probably rarely exists because the euphotic zone is a dynamic place. Unfortunately, there have been no studies where all three fluxes were measured at the same time. Part of the difficulty is that each flux needs to be integrated over different time scales. The oxygen flux approach has been applied in the subarctic north Pacific (Emerson et al., 1991) and subtropical Pacific (Emerson et al., 1995, 1997) and Atlantic (Jenkins and Goldman, 1985). The organic carbon export approach has been evaluated in the equatorial Pacific (Murray et al., 1996), subtropical Atlantic (Michaels et al., 1994) and several locations by Buesseler (1998) and Hansell and Carlson (1998).
Integrated, interdisciplinary studies of elemental cycling in the euphotic zone have been one main focus of the Joint Global Ocean Flux Study (JGOFS) and these have contributed greatly to our understanding of carbon cycling in specific ocean regions. Multi-investigator JGOFS process studies have been conducted in the North Atlantic (North Atlantic Bloom Experiment; NABE) (Ducklow and Harris, 1993), Equatorial Pacific (EqPac) (Murray, 1995, 1996; Murray et al., 1994, 1997), Subtropical Atlantic and Pacific (HOT and BATS) (Karl and Michaels, 1996), Arabian Sea (van Weering et al., 1997; Smith, 1998), and Southern Ocean (Turner et al., 1995; Gaillard and Treguer, 1997; Smetacek et al., 1997).
10.3.3 Factors Affecting the Rate of Plankton Productivity
10.3.3.1 Nutrients
Liebig’s Law of the Minimum states that under equal conditions of temperature and light, the nutrient available in the smallest quantity relative to the requirement of a plant will limit productivity. The “classic” approach for evaluating nutrient limitation is to compare the requirements of “average” marine plankton with “average” seawater. For example, plots of PO4 versus NO3 in deep ocean seawater show a very tight correlation with a slope of slightly less than 6.0 and a small but significant intercept on the PO4 axis (e.g., Fanning, 1992; Gruber and Sarmiento, 1997). When these waters are upwelled nutrient uptake takes place with RKR proportions and NO3 will run out first and become the limiting nutrient. Biological oceanographers have repeatedly demonstrated through enrichment experiments and observations of nutrient distribution that throughout the most of the coastal and open oceans phytoplankton productivity is most often limited by the availability of fixed inorganic N (Falkowski et al., 1998). There is approximately a ten-fold excess of inorganic carbon (largely as ) in deep seawater relative to the availability of phosphorus and nitrogen availability which implies that carbon is never limiting in the ocean. In addition, except under very intense bloom conditions, the carbon fixed by plankton is provided by upwelling and not from the atmosphere. The reason deep ocean sea water is slightly depleted in N relative to RKR probably reflects nitrogen loss due to denitrification, which occurs primarily in the intense oxygen minimum zones of the eastern tropical north and south Pacific, the Arabian Sea and continental margin sediments throughout the world’s oceans (Christensen et al., 1987).
In the subtropical ocean gyres the situation is more complicated (Perry, 1976). These regions are considered to be the marine analogs of terrestrial deserts because all nutrients are greatly depleted and biological biomass is small. A recent time-series study (The Hawaiian Ocean Time-series or HOT) has revealed that the ecosystem of the north Pacific subtropical gyre is temporally and spatially variable (Karl et al., 1995). This variability appears tied to the El Niño southern oscillation (ENSO) cycle. Increased stratification and decreased upper-ocean mixing during the 1991–92 El Niño event resulted in increased abundance and growth of nitrogen-fixing blue-green microorganisms called Trichodesmium. This resulted in a shift from the primarily nitrogen-limited regime that existed in 1981–90 to a phosphorus-limited condition in 1991–92. Growth of Trichodesmium spp. in subtropical habitats is favored under calm ocean conditions. Their ability to reduce N2 can remove the fixed-nitrogen limitation. N2 fixation may contribute up to half of the N required to sustain total annual organic matter export in this region (Karl et al., 1997). N2 fixation appears to be an important source of “new” nitrogen, especially under El Niño conditions. Thus the ecosystem in the subtropical gyres may switch periodically between N-limitation and P-limitation.
It has been argued that phosphorus limits oceanic productivity on the million year time scale (Broecker, 1971). The reason is that essentially all phosphorus in the ocean is introduced by rivers and thus ultimately from the weathering of continental rocks. This flux is, in effect, fixed by the rate of chemical weathering of the continents. By comparison fixed nitrogen can be derived from atmospheric N2 (via nitrogen fixation by Trichodesmium) as well as by weathering of rocks. The reservoir of atmospheric N2 is so large that nitrogen fixation can, over long time periods, adjust the overall supply of fixed nitrogen in seawater to the ratio needed by “average” plankton without significantly depleting the N2 source.
Silicic acid (H4SiO4) is a necessary nutrient for diatoms, who build their shells from opal (SiO2·nH2O). Whether silicic acid becomes limiting for diatoms in seawater depends on the availability of Si relative to N and P. Estimates of diatom uptake of Si relative to P range from 16:1 to 23:1. Dugdale and Wilkerson (1998) and Dunne et al. (1999) have shown that much of the variability in new production in the equatorial Pacific may be tied to variability in diatom production. Diatom control is most important at times of very high nutrient concentrations and during non-steady-state times, perhaps because more iron is available at those times.
Over 20% of the world’s open ocean surface waters are replete in light and major nutrients (nitrate, phosphate, and silicate), yet chlorophyll and productivity values remain low. These so-called “high-nitrate low-chlorophyll” or HNLC regimes (Chisholm and Morel, 1991) include the sub-arctic North Pacific (Martin and Fitzwater, 1988; Martin et al., 1989; Miller et al., 1991), the equatorial Pacific (Murray et al., 1994; Fitzwater et al., 1996) and the southern Ocean (Martin et al., 1990). Iron concentrations are extremely low in these regions (Johnson et al., 1997). The main source is probably particulate iron associated with atmospheric dust (Duce and Tindale, 1991). The equatorial undercurrent appears to be an additional source of the equatorial Pacific.
The results of two successful iron-fertilization experiments in the eastern equatorial Pacific have clearly shown that phytoplankton growth rate is limited by iron at that location (Martin et al., 1994; Coale et al., 1996). The species composition and size distributions of the ecosystem are influenced by iron availability (Landry et al., 1997). In particular, large diatoms do not grow at optimum rates in the absence of sufficient iron. Loukos et al. (1997) used a simple ecosystem model with iron limitation to show that the main process causing the persistence of high surface nutrients was not the low specific growth rate of the phytoplankton assemblage but the efficient recycling of nitrogen as a consequence of the food web structure imposed by iron limitation. The first-order process responsible for low phytoplankton biomass is efficient grazing of the small cells by micrograzers, which is also an indirect consequence of iron limitation (Landry et al., 1997). Grazing balances primary production and controls phytoplankton biomass. Nevertheless, because of its impact on the food web, iron deficiency is the ultimate control of the HNLC condition.
Fluxes of continental dust preserved in ice cores of Greenland and Antarctica suggest a 30-fold increase in dust flux during the last Glacial Maximum. Dramatic increases in new biological production in the HNLC regions may have resulted, resulting in the draw-down of atmospheric CO2 (Martin, 1990).
10.3.3.2 Light
Light is always necessary for photosynthesis (Raven and Johnston, 1991; Falkowski et al., 1992) and becomes limiting in the winter at high latitudes. In addition, the depth profiles of productivity and light energy correlate well at locations undergoing bloom conditions (Cullen et al., 1992). This suggests that the decline in productivity with depth reflects light penetration. Chemical constituents of seawater that can inhibit light penetration include dissolved humic substances (Gelbstuff) and suspended particulate matter. Both factors can become important factors in estuaries and other near-shore environments.
10.3.3.3 Availability of trace metals
Trace metals can serve as essential nutrients and as toxic substances (Sunda et al., 1991; Frausto da Silva and Williams, 1991). For example, cobalt is a component of vitamin B-12. This vitamin is essential for nitrogen fixing algae. In contrast, copper is toxic to marine phytoplankton at free ion concentrations similar to those found in seawater (Sunda and Guillard, 1976). The possibility that iron availability may limit primary productivity was discussed earlier.
Nickel is required by plants when urea is the source of nitrogen (Price and Morel, 1991). Bicarbonate uptake by cells may be limited by Zn as transport involves the zinc metalloenzyme carbonic anhydrase (Morel et al., 1994). Cadmium is not known to be required by organisms but because it can substitute for Zn in some metalloenzymes it can promote the growth of Zn-limited phytoplankton (Price and Morel, 1990). Cobalt can also substitute for Zn but less efficiently than Cd.
10.3.4 The Geographic Distribution of Primary Productivity
The geographic distribution of primary productivity in the ocean is shown in Fig. 10-14. High productivity is characteristic of marine zones where surface water is replenished with deeper water either by upwelling (as on western continental margins) or by deep mixing (as at high latitudes where stratification is less pronounced). Although upwelling regions are characterized by very high productivities (∼300 g C/m2 per year) they together contribute less than 1% of the total ocean production (Table 10-5). Coastal regions have mean productivities of about 100 g C/m2 per year, but account for approximately 100 times the surface area of upwelling zones. These coastal regions contribute about 25% of the total primary production with the remaining 75% coming from the wide expanses (90% of total area) of low production (50 g C/m2 per year) open ocean.
Table 10-5
Distribution of ocean productivity

aFrom Ryther (1969).
bIncludes offshore areas of high productivity.
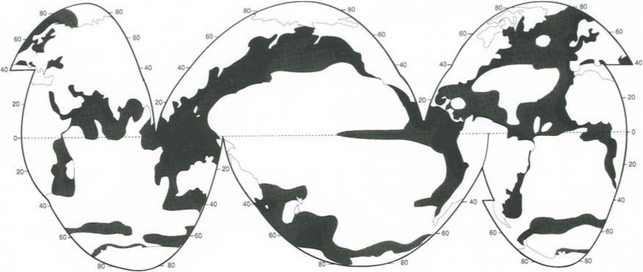
Fig. 10-14 Approximate geographical distibution of primary productivity in the oceans (g C/m2 per year).
Recently, the ocean-basin distribution of marine biomass and productivity has been estimated by satellite remote sensing. Ocean color at different wavelengths is determined and used to estimate near-surface phytoplankton chlorophyll concentration. Production is then estimated from chlorophyll using either in situ calibration relationships or from empirical functional algorithms (e.g., Platt and Sathyendranth, 1988; Field et al., 1998). Such studies reveal a tremendous amount of temporal and spatial variability in ocean biological production.
10.3.5 Forms of Organic Matter in Seawater
To this point, organic matter in the ocean has been treated primarily as RKR average plankton. We now need to focus on the fate of this biologically produced organic carbon.
There is an exceedingly broad range of size of organic material in seawater, ranging from simple organic molecules, such as dissolved glucose (scale ∼10−9 m) to the blue whale (∼102 m). Although the distribution curve of organic particles is smooth over the 10−3 to 10−9 m size interval, it has become customary to divide these particles into “dissolved” and “particulate” categories on the basis of filtration through a 0.45 µm pore size filter. By operational definition, “dissolved” particles pass the filter whereas “particulate” materials are retained.
Although somewhat arbitrary, the 0.45 µm “cutoff” between dissolved and particulate organic is for the most part convenient. For example, particles above about 1.0 µm are observable with a microscope and tend to settle in seawater. Particles less than 1.0 µm are submicroscopic and generally sink very slowly and disperse as a result of Brownian motion. In addition, particles less than 0.45 µm fall below the range of most living organisms (except for some viruses and small bacteria).
Essentially all the dissolved organic matter in seawater can be assumed to be non-living. However, particulate organic matter can be either living or dead, with the latter often referred to as “detritus.”
10.3.6 Organic Carbon Pathways in the Ocean
To understand the distribution and pathways of organic material in the ocean the key question is: “What happens to that 99% of the phytoplankton biomass that is remineralized between photosynthesis and burial?”
A major advance in our understanding of the processes controlling the vertical transport of organic matter in the ocean was the realization that most of the vertical flux of particulate material in the ocean water column is provided by large particles (> 128 µm) which account for less than 5% of the total mass concentration. These larger particles are predominantly zooplankton fecal pellets or marine snow particles. About 90% of all phytoplankton are eaten by zooplankton and encapsulated into large (100–300 µm), fast-sinking (50–500 m/day) fecal pellets. This result is particularly significant because the large, fast-sinking particles are less likely to be collected using conventional water samplers. As a result different types of “sediment traps” have been developed in order to collect a representative sample of the vertical particle flux.
Sediment trap studies in the open ocean show that the flux of organic carbon at any depth is directly proportional to the rate of primary productivity in the surface water and inversely proportional to the depth of the water column (Suess, 1980):
where Cprod is the primary production (g/m2 per year), and Cflux is the flux at depth Z (m). The original data used to calibrate this equation are shown in Fig. 10-15 as a plot of the ratio of carbon flux/primary production versus water depth. As can be seen, about 10% of the primary production falls to a depth of 400 m, whereas only about 1% reaches 5000 m.
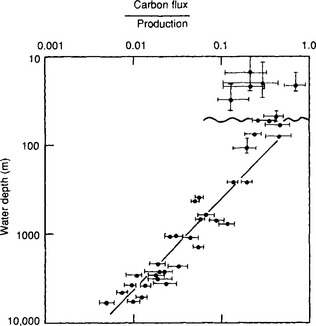
Fig. 10-15 Organic carbon fluxes with depth in the water column normalized to mean annual primary production rates at the sites of sediment trap deployment. The undulating line indicates the base of the euphotic zone; the horizontal error bars reflect variations in mean annual productivity as well as replicate flux measurements during the same season or over several seasons; vertical error bars are depth ranges of several sediment trap deployments and uncertainities in the exact depth location. (Reproduced with permission from E. Suess (1980). Particulate organic carbon flux in the oceans – surface productivity and oxygen utilization, Nature 288: 260–263, Macmillan Magazines.)
This general relationship has other implications and applications. If depth in Fig. 10-15 is transformed into time, then the slope of the plot represents a rate constant for in situ organic carbon loss from the sinking particles. Assuming an average settling rate of 100 m/day the previous equation becomes
where t=Z/(dZ/dt). Thus, the estimated time for degradation of 90% of the primary production from falling particles is 4.1 days and after this time the particles would be at about 400 m.
This discussion suggests a rapid and relatively direct transport of organic material vertically through the ocean water column. However, this transport is not efficient and under “average” ocean conditions (primary productivity = 100 g C/m2 per year and water depth of 4000 m) only 1% of the production can be expected to reach the ocean floor.
10.3.7 Oceanic Reservoirs of Organic Carbon
The distribution of dissolved, total particulate, and living particulate organic carbon in the surface (0–300 m) and deep ocean (>300m) are summarized in Table 10-6. Recent analytical advances have greatly improved our understanding of the distributions of DOC in the ocean (Hedges and Lee, 1993). The important aspects of this compilation are:
Table 10-6
Organic carbon reservoirs in the ocean

aConcentrations vary widely with geographical area and with season. The depth at which the concentration tends to approach a more or less constant level varies widely from 100 to 500 m.
bConcentrations more constant.
fPhytoplankton component only, see Table 10-4 and Williams (1975).
gTotal living matter, Parsons et al. (1977).
1. The organic carbon (and thus the organic matter) in seawater is predominantly in dissolved form (DOC) with an average for the whole ocean being 97%. In general, surface ocean concentrations are about 80 µM and decrease to about 40 µM below 500 m (Peltzer and Hayward, 1996; Hansell and Peltzer, 1998).
2. DOC in the deep ocean gradually decreases from 48 µM in the North Atlantic to 34 µM in the North Pacific (Hansell and Carlson, 1998).
3. The C/N ratio of dissolved organic matter (∼17) is greater than the RKR ratio of 6.6. DON has a similar distribution as DOC and appears to be derived from degradation-resistant biomolecules (McCarthy et al., 1997).
4. Of the remaining particulate organic matter, very little is living (> 95% detritus).
10.3.8 An Oceanic Budget for Organic Carbon
A simple budget for the global carbon cycle is given in Fig. 10-16 (Siegenthaler and Sarmiento, 1993). In this version net primary production is 10 Gt C/yr (1 Gt = 1015 gC). This is in close agreement with the estimate of 7.2 Gt C/yr by Chavez and Toggweiler (1995). Falkowski et al. (1998) concluded that ocean primary production is about 45 Gt C/yr, which is about 43% of the global total (Field et al., 1998). Thus the global average ocean f-ratio is about 20%. On average ocean biota (3 Gt C) turns over about every 1/3 year. According to this version 60% of the exported C is as DOC. More recent estimates suggest that the fraction as DOC is more like 20% (Hansell et al., 1997; Murray et al., 1996; Archer et al., 1998).
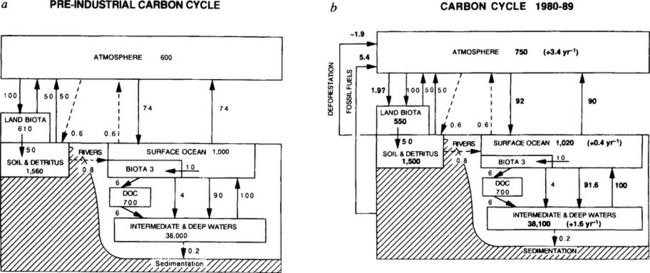
Fig. 10-16 A simple schematic of the carbon cycle. Part (a) is the pre-industrial case, and part (b) shows the contemporary reservoirs and fluxes, in Pg C and Pg C/yr, respectively (Pg C = 1015 g C). This diagram of the carbon cycle is similar to those presented in Chapters 4 and 11. (Reprinted by permission from Nature (1993). 365: 119–125, Macmillan.)
The main mechanism for removal of organic carbon from the ocean is burial in sediments. This flux is equal to the average global sedimentation rate for marine sediments times their weight percent organic carbon. The total sink by burial (2 × 10¹⁴ g C/yr) does not nearly approach the production terms. If the reservoir of total organic matter in seawater is to remain constant (i.e., steady state) then over 98% of the input must be remineralized by respiration and decomposition either in the water column or the surface sediments. The closest estimate that can be made for the mean residence time of organic matter in the ocean is 10000 years. This is obtained by dividing the reservoir mass by the sedimentary removal rate. This crude estimate is, however, slanted toward the refractory organic components and says little about organic carbon cycling rates in the ocean prior to sedimentation.
10.4 Chemistry of the Oceans
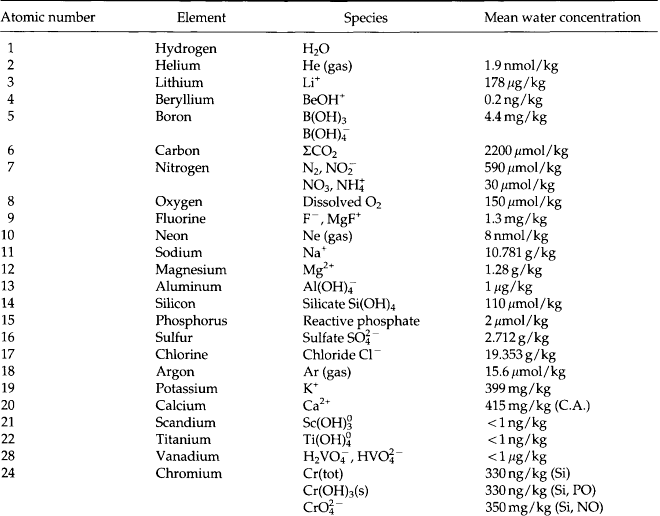
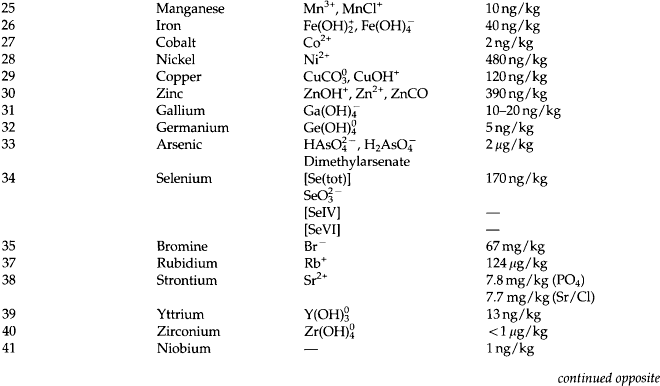
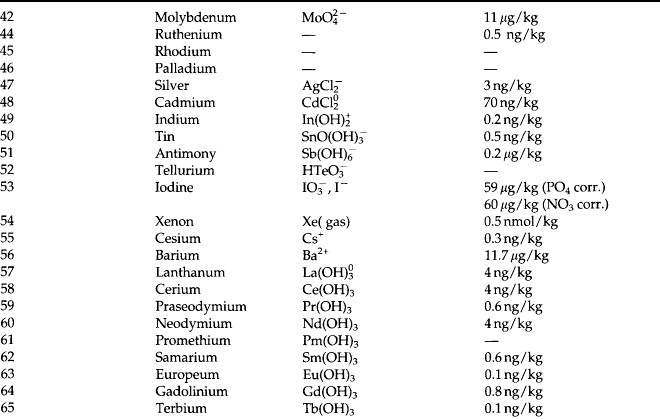
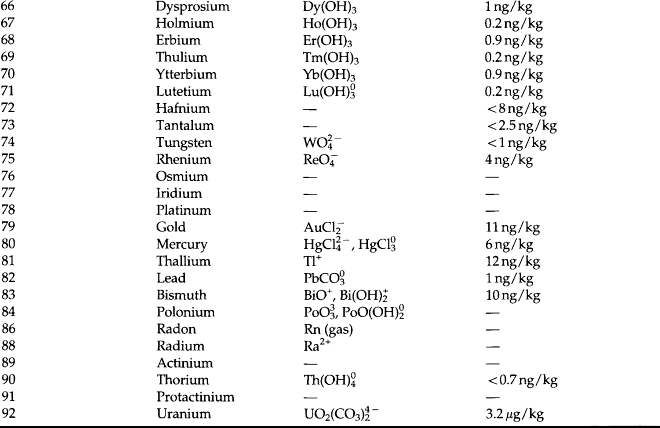
Chemical oceanography came to be identified as a discipline in its own right during the 1960s. The significance of chemical oceanography grew when it was realized that many of the stable and radioactive components of the ocean vary significantly in concentration and that knowledge of these variations could provide important information about natural processes. During the 1970s the distributions of most elements and isotopes became fairly well understood. In the process, the subdiscipline of marine chemistry emerged. This field focuses on the chemical reactions and mechanisms in the ocean and at its boundaries. A summary of the observed concentrations and are given in Table 10-7 (Quinby-Hunt and Turekian, 1983).
10.4.1 Residence Time
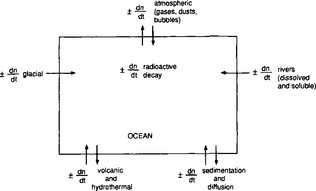
As a starting point we can view the ocean as one large reservoir to which materials are continuously added and removed (Fig. 10-17). The major sources of material include rivers and winds, which carry dissolved and particulate materials from the continents to the sea. The major removal process is the formation of marine sediments both by settling of particles through the water column as well as by precipitation of insoluble solid phases. For many elements hydrothermal circulation through the ocean crust may be important.
The concept of average residence time, or turnover time, provides a simple macroscopic approach for relating the concentrations in ocean reservoirs and the fluxes between them. For the single box ocean in Fig. 10-17 the rate of change of the concentration of component n can be expressed as
If (dn/dt) = 0 we have a steady state. This is also referred to as a state of dynamic equilibrium where the rate of input equals the rate of removal.
The concept of residence time was first introduced by Barth (1952) and given by the following expression (see also Chapter 4 and Li, 1977):
where Q and S represent the mean total input and removal rates, respectively, and M represents the total mass of an element dissolved in the sea. For most elements it appears that the removal rate is proportional to the total amount present or S=kM, where k is a first-order rate constant. At steady state, τ0 = 1/k. This relation predicts an inverse correlation between residence time and the removal rate constant, which must be a measure of the chemical reactivity. The approach to equilibrium for this problem is discussed in Chapter 4 and by Lasaga (1980, 1981).
Chemically reactive elements should have a short residence time in seawater and a low concentration. A positive correlation exists between the mean ocean residence time and the mean oceanic concentration; however, the scatter is too great for the plot to be used for predictive purposes. Whitfield and Turner (1979) and Whitfield (1979) have shown that a more important correlation exists between residence time and a measure of the partitioning of the elements between the ocean and crustal rocks. The rationale behind this approach is that the oceanic concentrations have been roughly constant, while the elements in crustal rocks have cycled through the oceans. This partitioning of the elements may reflect the long-term chemical controls. The relationship can be summarized by an equation of the form
where KD is the ratio of the mean concentration in seawater/mean concentration in the crust. Appropriate values for 40 elements have been tabulated by Whitfield (1979).
Li (1981) proposed that the distribution coefficients reflect adsorption–desorption reactions at the surface of mineral grains. To emphasize this point, Li plotted a slightly different distribution coefficient, log Cop/Csw, where Cop and Csw are the concentrations in oceanic pelagic clay sediments and seawater respectively) versus the first hydrolysis constants of the metals or the dissociation constant of the oxyanion acids. The argument is that those elements that hydrolyze the strongest will adsorb the strongest and thus have a larger preference for the solid phase as represented by pelagic clay. For oxyanions the larger the acidity constant the weaker the adsorption on solid phases.
Thus, the chemical reactivity of the elements in seawater is reflected by the residence time. It is important to note, however, that while residence times tell us something about the relative reactivities, they also tell us nothing about the nature of the reactions. The best source of clues for understanding these reactions is to study the shape of dissolved profiles of the different elements. When we do this we find that there are six main characteristic types of profiles as described in Table 10-8. Notice that most of these reactions occur at the phase discontinuities between the atmosphere, biosphere, hydrosphere, and lithosphere.
Table 10-8
Characteristic types of profiles of elements in the ocean with example elements and probable controlling mechanisms
| Type of profile | Example elements | Mechanisms |
| 1. Similar to salinity | Na, K, Mg, SO4, F, Br | Conservative elements of very low reactivity |
| 2. Sea-surface enrichment | Atmospheric input | |
| 210Pb, Mn | – natural | |
| 90Sr, Pb | – pollution, bomb tests | |
| NO | – photochemistry | |
| As(CH3)2, H2, NO2 | Biological production | |
| 3. Photic-zone depletion with deep-ocean enrichment | Ca, Si, ΣCO2, NO3, PO4, Cu, Ni | Biological uptake and regeneration |
| 4. Mid-water maxima | ||
| 3000 m | 3He, Mn, CH4, 222Rn | Hydrothermal input |
| 200 to 1000 m | 3H | Isopycnal transport |
| Mn, NO2 | Redox chemistry in oxygen minimum | |
| 5. Bottom-water enrichment | 222Rn, 228Ra, Mn, Si | Flux out of the sediments |
| 6. Deep-ocean depletion | 210Pb, 230Th,Cu | Scavenging by settling particles |
10.4.2 Composition of seawater
10.4.2.1 Major ions
The salinity of seawater is defined as the grams of dissolved salt per kg of seawater. Using good technique, salinity can be reported to 0.001‰ or 1 ppm(m). By tradition the major ions have been defined as those that make a significant contribution to the salinity. Thus, major ions are those with concentrations greater than 1 mg/kg or 1 ppm(m). By this definition there are 11 major ions in seawater (Table 10-9).
Table 10-9
The major ions of seawater: concentration at 35%o, ratio to chlorinity, and molar concentrationa
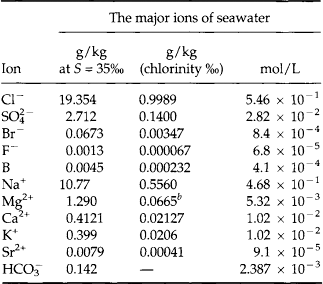
aFrom Wilson (1975).
bRecent reported values lie between 0.06612 and 0.06692.
The elements Na, K, Cl, SO, Br, B, and F are the most conservative major elements. No significant variations in the ratios of these elements to chlorine have been demonstrated. Strontium has a small (< 0.5%) depletion in the euphotic zone (Brass and Turekian, 1974) possibly due to the plankton Acantharia, which makes its shell from SrSO4 (celestite). Calcium has been known since the 19th century to be about 0.5% enriched in the deep sea relative to surface waters. Alkalinity ( ) also shows a deep enrichment. These elements are controlled by the formation and dissolution of CaCO3 and are linked by the following reaction:
Low-temperature circulation of seawater through mid-ocean ridge systems creates a deficiency in Mg and an excess in Ca at mid-depths (de Villiers and Nelson, 1999).
10.4.2.2 Minor elements
By definition a minor element in seawater is one has a concentration less than 1 ppm(m). It is experimentally challenging to determine the total concentrations, much less their major chemical forms. Development of new analytical techniques has greatly extended our knowledge (Johnson et al., 1992). Because early data (prior to about 1975) was so erratic, the principle of oceanographic consistency was proposed as a test for the data (Boyle and Edmond, 1975). According to this principle the analyses of minor elements should:
1. Form smooth vertical profiles.
2. Have correlations with other elements that share the same controlling mechanism.
The concentrations of the minor elements are given in Table 10-7. There is at least one oceanographically consistent profile for most of the elements. Refer to Quinby-Hunt and Turekian (1983) for references and representative profiles for individual elements. The main mechanisms that control the distribution of minor elements are given in Table 10-8.
The chemical reactivity of minor elements in seawater is strongly influenced by their speciation (see Stumm and Brauner, 1975). For example, the Cu2+ ion is toxic to phytoplankton (Sunda and Guillard, 1976). Uranium (VI) forms the soluble carbonate complex, , and as a result uranium behaves like an unreactive conservative element in seawater (Ku et al., 1977).
Although the speciation of some minor elements has been determined directly by experimental means (e.g., ion selective electrodes, polarography, electron spin resonance) most of our thinking about speciation is based on equilibrium calculations. Garrels and Thompson (1962) conducted speciation calculations for the major elements of seawater. They showed that the major cations (Na, K, Ca, Mg) and Cl are mostly (> 90%) uncomplexed in seawater. The amons are significantly complexed. When similar calculations are done for the minor elements in seawater we find a different story. Most of the minor elements exist as complex ions or ion pairs. In particular, the metals form complexes with anions (ligands) such as
 , cl−and especially OH−. The best estimates of the speciation of the elements in seawater are given in Table 10-7.
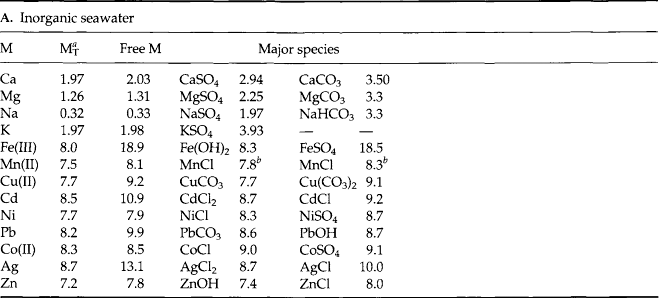
Stumm and Brauner (1975) conducted a Garrels and Thompson type calculation for some major and minor elements in seawater. These results are shown in Table 10-10. There are actually two calculations shown. Table 10a is for an inorganic seawater model. In Table 10b the calculations are repeated using organic compounds with functional groups similar to those found in nature. The metals tested are listed in the left column followed by a column of their concentration in seawater (as best known at that time). The inorganic and organic ligands tested are listed across the top row. Of the metals studied only the major ions (Ca, Mg, Na, K) and Ni and Co occur mostly as the free metal ion. Complex species predominate for all other metals. When organic ligands are added to the model, only the speciation of Cu is seriously affected. Direct measurements by differential pulse anodic stripping voltammetry have shown that more than 99.7% of the total dissolved copper in surface seawater is associated with organic complexes (Coale and Bruland, 1988). More than 99.97% of dissolved Fe(III) is chelated by organic ligands (Rue and Bruland, 1995).
10.4.2.3 Dissolved gases
All deep waters of the ocean were once in contact with the atmosphere. Since over 95% of the total of all gases (except radon) reside in the atmosphere, the atmosphere dictates the ocean’s gas contents. CO2 is also a special case because the ocean has high total CO2. As discussed in Chapter 7, the composition of the atmosphere is nearly constant horizontally.
The solubility of many gases depends mainly on molecular weight. The heavier the molecule the greater the solubility. Thus He is less soluble than Xe. The gases CO2 and N2O are exceptions to this general trend because they interact more strongly with water. Solubility also increases with decreasing temperature. Thus, high-latitude surface seawater has higher gas concentrations than seawater at mid- or low latitudes.
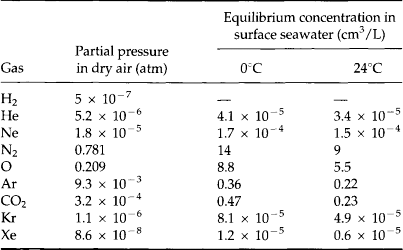
The equilibrium concentration in seawater is described by Henry’s Law, which relates the partial pressure of the gas to its concentration (see Chapter 5 and Waser, 1966). Using the appropriate values of Henry’s Law constant, KH, and the partial pressures of gases in the atmosphere, the equilibrium concentrations of several gases are given in Table 10-11 for 0°C and 24°C.
In the ocean, inert gas concentrations tend to follow the temperature solubility dependence closely. This suggests that water parcels obtain their gas signatures when they are at the seasurface close to equilibrium with the atmosphere at ambient temperature.
The process of equilibration of the atmosphere with the ocean is called gas exchange. Several models are available, however, the simplest model for most practical problems is the one-layer stagnant boundary-layer model (Fig. 10-18). This model assumes that a well-mixed atmosphere and a well-mixed surface ocean are separated by a film on the liquid side of the air-water interface through which gas transport is controlled by molecular diffusion. (A similar layer exists on the air side of the interface that can be neglected for most gases. SO2 is a notable exception (Liss and Slater, 1974)).
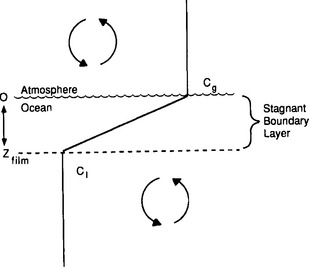
Fig. 10-18 A schematic of a stagnant boundary-layer gas exchange model. Cg = gas concentration at the liquid side of the interface; C1 = gas concentration at the base of the stagnant boundary layer; Zfilm = stagnant boundary layer thickness.
Table 10-10
B. Inorganic seawater plus soluble organic matter (2.3 mg C/L)c
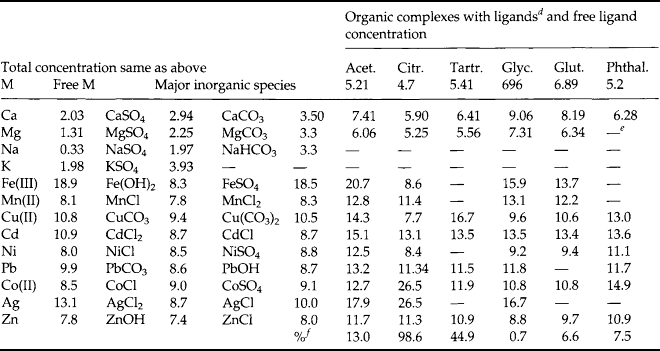
aTotal concentration of metal species: note that Fe(III) is slightly oversaturated with respect to Fe(OH3(s); Cu(II) is oversaturated with respect to malachite but because formation is slow, precipitation of the solid has not been allowed. All other metals are thermodynamically soluble at the concentrations specified.
bThere is some uncertainty regarding the validity of the stability constants of chloro complexes of mn2+; according to other computations mn2+ is a major inorganic species.
cOrganic matter of approximate composition C13H17O12N consists of a mixture of acetate, citrate, tartrate, glycine, glutamic acid, and phthalate, each present at 7 × 10⁻⁶M (11 mmol donor groups per liter).
dThe concentrations given refer to the sum of all complexes, e.g., CuCit, CuHCit, CuCit2.
eNo stability constants for such complexes are available.
fPercentage of total ligand bound to metal ions.
If transport across this film is controlled by diffusion then from Fick’s Second Law of Diffusion,
The boundary conditions are C = Cg at x = 0 and C = C1 at x=z. The steady-state concentration profile across the boundary layer is given by
The steady-state flux from the atmosphere to the ocean across the layer is given by Fick’s First Law:
This treatment may be compared with that given in Chapter 4. The top of the stagnant film is assumed to have a gas concentration in equilibrium with the overlying air (i.e., Cg = KHPg). The unknown values are the flux and the thickness of the diffusive layer z. The thickness z has been determined by analyses of isotopes (14C and 222Rn) that can be used to obtain the flux (Broecker and Peng, 1974; Peng et al., 1979). The thickness averaged over the entire ocean has been estimated from a 14C balance to be 17 µm.
Since the units of D/z are the same as velocity we can think of this ratio as the velocity of two imaginary pistons: one moving up through the water pushing ahead of it a column of gas with the concentration of the gas in surface water (C1) and one moving down into the sea carrying a column of gas with the concentration of the gas in the upper few molecular layers (Cg). For a hypothetical example with a film thickness of 17 µm and a diffusion coefficient of 1 × 10⁻⁵ cm2/s the piston velocity is 5m/day. Thus in each day a column of seawater 5 m thick will exchange its gas with the atmosphere.
The piston velocity, or gas transfer velocity, is a function of wind speed. There are large differences in the relationships between piston velocity and wind speed, especially at higher wind speeds (e.g., Liss and Merlivat, 1986; Wanninkhof, 1992). This is the limiting factor for these calculations.
Example:
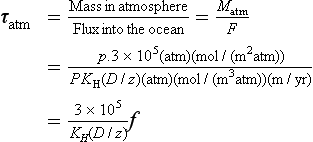
Obtain a relationship for the residence time of gases in the atmosphere with respect to gas exchange:
If we assume that Zfilm = 17 µm and D = 1 × 10⁻⁵ cm2/s, then the piston velocity is about 1800 m/yr. The solubility of N2, O2, CO, H2, NO, Ar, CH4 etc. is about 1 mol/(m3 atm), while it is about 30 mol/m3 atm) for CO2. Thus the residence time for most inert gases in the atmosphere is about 160 years. For CO2 it is about 5.4 years or a factor of 30 faster than for the other gases.
10.4.2.4 Nutrients
Oceanic surface waters are efficiently stripped of nutrients by phytoplankton. If phytoplankton biomass was not reconverted into simple dissolved nutrients, the entire marine water column would be depleted in nutrients and growth would stop. But as we saw from the carbon balance presented earlier, more than 90% of the primary productivity is released back to the water column as a reverse RKR equation. This reverse reaction is called remineralization and is due to respiration. An important point is that while production via photosynthesis can only occur in surface waters, the remineralization by heterotrophic organisms can occur over the entire water column and in the underlying sediments.
It follows that deep seawater contains nutrients from two sources. First, it may contain nutrients that were present with the water when it sank from the surface. These are called “preformed nutrients.” Second, it may contain nutrients derived by the in situ remineralization of organic particles. These are called oxidative nutrients.
The oxidative nutrients can be estimated from the RKR equation. From this model we might expect the four dissolved chemical species (O2, CO2, NO3, PO4) to vary in seawater according to the proportions predicted.
The key to understanding these remineralization reactions is the parameter Apparent Oxygen Utilization (AOU), defined as
Where O2 is the saturation value at the salinity and potential temperature of the sample. O2 is the measured O2 at the time of sampling. From the respiration form of the RKR equation it follows that for every 138 mol O2 consumed in situ one gets 106 mol CO2, 16 mol NH3 and 1 mol H3PO4 (or using 170:117:16:1 using the more recent analysis by Anderson and Sarmiento, 1994). As can be seen, the slopes of the regression lines of AOU versus phosphate and nitrate closely correspond to the complete remineralization of average plankton.
The preformed nutrients are obtained by subtracting the oxidized nutrient from total nutrient (for N and P).
For silica an additional component of silicic acid generated by inorganic dissolution also occurs. One can estimate “oxidized” Si as being 23/138 AOU, but discrimination between preformed Si and inorganic Si is not possible. Representative profiles of PO4, NO3, and Si are given in Fig. 10-19. Note that after subtracting the oxidative nutrients the preformed values are relatively constant.
10.4.2.5 Carbonate system
The carbonate system plays a pivotal role in most global cycles. For example, gas exchange of CO2 is the exchange mechanism between the ocean and atmosphere. In the deep sea, the concentration of ion determines the depth at which CaCO3 is preserved in marine sediments.
Dissolved inorganic carbon is present as three main species which are H2CO3, and
and . Analytically we have to approach the carbonate system through measurements of pH, total CO2 or DIC, alkalinity (Alk), and PCO2. In an open carbonate system there are six unknown species: H+, OH−, PCO2, H2CO3,
 , and
, and . The four equilibrium constants connecting these species are K1, K2, KH, and Kw. The values of these equilibrium constants vary with T, P, and S (Millero, 1995). To solve for the six unknowns we need to measure two of the four analytical parameters (Stumm and Morgan, 1996). Direct measurement of PCO2 is the best approach, but if that is not possible then the most accurate and precise pair (Dickson, 1993) is Total CO2 by the coulometric method (Johnson et al., 1993) and pH by the colorimetric method (Clayton et al., 1995).
The distributions of total CO2 or DIC and alkalinity in the Atlantic, Indian and Pacific Oceans are compared with PO4 and O2 in Fig. 10-20 (Baes et al., 1985). The main features are:
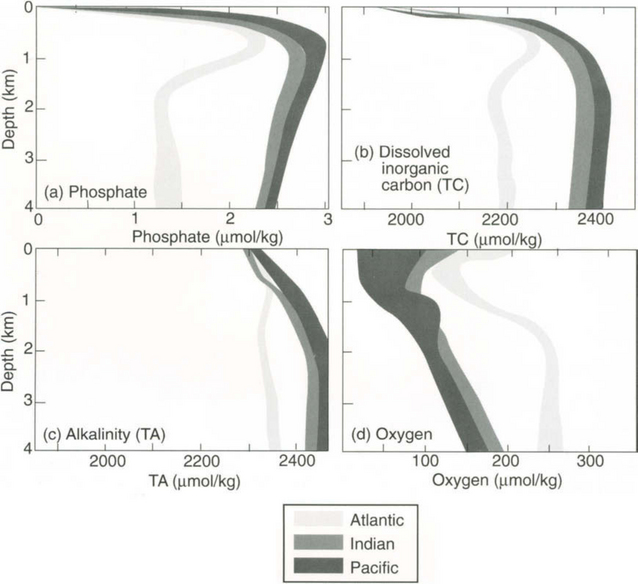
Fig. 10-20 Observed depth profiles of (a) phosphate, (b) dissolved inorganic carbon (TC), (c) alkalinity (TA), and (d) oxygen for the Atlantic, the Indian, and the Pacific Oceans as indicated. Data are from GEOSECS stations within 5° of the Equator in each ocean. (Modified from Baes et al. (1985).)
2. General increase with depth.
3. Deep ocean values increase from the Atlantic to the Pacific.
4. DIC < Alk and Δ(DIC) > Δ(Alk).
Respiration of organic matter and dissolution of CaCO3 are the main controls of the distribution of deep ocean Total CO2 and alkalinity. These reactions (and their predicted effects on DIC and alkalinity) can be represented schematically as
To a first approximation the deep ocean distributions shown in Fig. 10-20 can be reproduced if the particulate material dissolving in the deep sea has the ratio of 1 mol CaCO3 to 4 mol organic carbon (Broecker and Peng, 1982).
10.4.3 Equilibrium Models of Sea water
Now that we have reviewed some basic aspects of the chemical composition of the ocean we can turn to a more fundamental question. What processes determine the composition of the ocean? Current evidence suggests that rivers are the most important contributors of dissolved substances to the ocean. Since there is geologic evidence that the concentration and composition of the ocean has been relatively constant over the last ∼1.5 billion years, we must conclude that the river input must be balanced by removal.
10.4.3.1 Sillén’s model
Sillén was a Swedish inorganic chemist who specialized in solution chemistry. In 1959, Sillén was asked as “an outsider” to give a lecture on the physical chemistry of seawater to the International Oceanographic Congress in New York (Sillén, 1961). Sillén proposed that the ionic composition of seawater might be controlled by equilibrium reactions between the dissolved ions and various minerals occurring in marine sediments. Goldschmidt (1937) had earlier proposed a schematic reaction for the geochemical balance:
This is a weathering reaction. Sillén argued that Goldschmidt’s reaction could also go the other direction. The reverse reaction would be called reverse weathering.
The framework for constructing such multi-component equilibrium models is the Gibbs phase rule. This rule is valid for a system that has reached equilibrium and it states that
The number of degrees of freedom is represented by f. These are chosen from the list of all quantitatively related aspects of a system that can change. This includes T, P, and the concentrations of c components in each phase. c is the minimum number of components necessary to reproduce the system (ingredients), and p is the number of phases present at equilibrium. A phase is a domain with uniform composition and properties. Examples are a gas, a liquid solution, a solid solution, and solid phases.
In a mathematical sense f represents the difference between the number of independent variables (including T, P) and the number of constraints (equations). If the number of equations equals the number of unknown variables, we can solve for all the concentrations using equilibrium equations. (For more discussion of the phase rule see Stumm and Morgan, 1996). Sillén’s approach was to mix components, pick a reasonable set of phases that might be present, and then see how many degrees of freedom there are to be fixed.
Sillén constructed his models in a stepwise fashion starting with a simplified ocean model of five components (HCl, H2O, KOH, Al(OH)3,
and SiO2) and five phases (gas, liquid, quartz, kaolinite, and potassium mica) (Sillén, 1967). His complete (almost) seawater model was composed of nine components. HCl, H2O, and CO2 are acids that correspond to the volatiles from the Earth. KOH, CaO, SiO2, NaOH, MgO, and Al(OH)3 correspond to the bases of the rocks. If there was an equilibrium assemblage of nine phases the system would have only two independent variables. Sillén argued that a plausible set could include a gas phase and a solution phase and the following seven solid phases:
| • Calcite | CaCO3 |
| • Quartz | SiO2 |
| • Kaolinite | Al2Si2O5(OH)4 |
| • Illite | K0.59(Al1.38Fe0.73Mg0.38)(Si3.41Ai0.59)O10(OH)2 |
| • Chlorite | Mg3(OH)6Mg3Si4O10 (OH)10 |
| • Montmorillonite | Na0.33Al2(Si3.67Al0.33) O10(OH)2 |
| • Phillipsite (zeolite) | M3Al3Si4O16(H2O)6, where M = Na + K + Ca + Mg |
If these phases all exist at equilibrium then f = 2. Sillén argued that we should fix T and [Cl−] (Cl− does not enter any of the reactions and is thus conservative). If so, the composition of the aqueous and gas phases would be fixed. The implications are far reaching because these equilibria would fix PCO2 of the atmosphere, the alkalinity of the ocean and thus the pH of the ocean!
10.4.3.2 MacKenzie and Carrels’ chemical mass balance between rivers and oceans
Evaporation of river water will not make seawater. Instead, evaporation of the nearly neutral Na+–Ca2+– river water produces a highly alkaline Na–HCO−–
 water such as found in the evaporitic lake beds of eastern California (Garrels and MacKenzie, 1967). In addition, on comparing the amount of material supplied to the ocean with the amount in the ocean, it may be seen that most of the elements could have been replaced many times (Table 10-12). Thus some chemical reactions must be occurring in the ocean to consume the river flux.
Table 10-12
Number of times river constituents have passed through the ocean in 10 years assuming present annual worldwide river discharge, mean dissolved constituent concentration of rivers and ocean, and ocean volume of 1.37 × 10²¹ L (amounts in 1018 kg)

MacKenzie and Garrels (1966) approached this problem by constructing a model based on a river balance. They first calculated the mass of ions added to the ocean by rivers over 108 years. This time period was chosen because geologic evidence suggests that the chemical composition of seawater has remained constant over that period. They assumed that the river input is balanced only by sediment removal. The results of this balance are shown in Table 10-13.
Table 10-13
Mass balance calculation for removal of river-derived constituents from the ocean (all units in 1021 mmol)
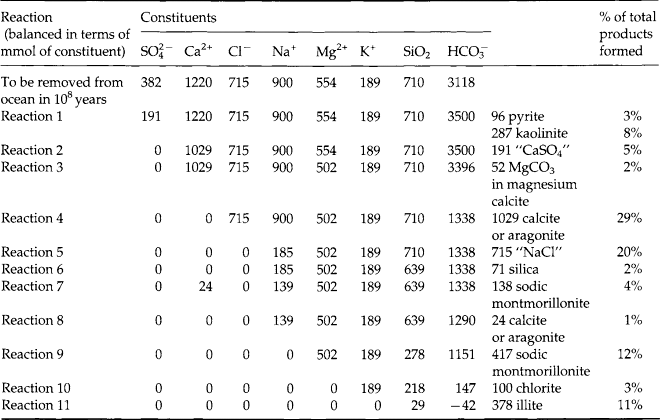
1:95.5FeAl6Si6O20(OH)4 + 191 + 47.8CO2 + 55.7C6H12O6 + 238.8H2O → 286.5Al2Si2O5(OH)4 + 95.5FeS2 + 382
 .
.
2:191Ca2+ + 191 → 191CaSO4.
3:52Mg2+ + 104 → 52MgCO3 + 52CO2 + 52H2O.
4:1029Ca2+ + 2058 → 1029CaCO3 + 1029CO2 + 1029H2O.
5:715Na+ + 715Cl− → 715NaCl.
6:71H4SiO4 → 71SiO2(s) + 142H2O.
7:138Ca0.17Al2.33Si3.67O10(OH)2 + 46Na+ → 138Na0.33Al2.33Si3.67O10(OH)2 + 23.5Ca2+.
8:24Ca2+ + 48 → 24CaCO3 + 24CO2 + 24H2O.
9:486.5Al2Si2.4O5.8(OH)4 + 139Na+ + 361.4SiO2 + 139 → 417Na0.33Al2.33Si3.67O10(OH)2 + 139CO2 + 625.5H2O.
10:100.4Al2Si2.4O5.8(OH)4 + 502Mg2+ + 60.2SiO2 + 1004 → 100.4Mg5Al2Si3O10(OH)8 + 1004CO2 + 301.2H2O.
11:472.5Al2Si2.4O5.8(OH)4 + 189K+ + 189SiO2 + 189 → 378K0.5Al2.5Si3.5O10(OH)2 + 189CO2 + 661.5H2O.
In this balance SO4 is removed by CaSO4 and FeS2 in proportion to their abundance in the sedimentary record (50/50). Ca is removed as CaCO3 with enough Mg to correspond to the natural proportions. Chloride is removed as NaCl, and enough H4SiO4 is removed to make opal sediments. Some Na+ is taken up and Ca2+ released during ion exchange reactions in estuaries. At this point they still had to account for 15% of the initial Na, 90% of the Mg, 100% of the K, 90% of the SiO2 and 43% of the . To remove these excess ions MacKenzie and Garrels proposed reverse weathering type reactions of the general type:
In their model they used a kaolinite-like clay for the degraded silicate and allowed Na, Mg, and K to react to form sodic montmorillonite, chlorite, and illite respectively. The balance is essentially complete with only small residuals for H4SiO4 and . The newly formed clays would constitute about 7% of the total mass of sediments.
This last requirement has been the greatest stumbling block for accepting Sillén’s and
MacKenzie and Garrels’ equilibrium models. Most marine clays appear to be detrital and derived from the continents by river or atmospheric transport. Authigenic phases (formed in place) are found in marine sediments (e.g. Michalopoulos and Aller, 1995), however, they are nowhere near abundant enough to satisfy the requirements of the river balance. For example, Kastner (1974) calculated that less than 1% of the Na and 2% of the K transported by rivers is taken up by authigenic feldspars.
So while the equilibrium approach is attractive and certainly tells us the directions reactions tend to go, the experimental and empirical verification is lacking.
10.4.4 Kinetic Models of Seawater
The failure to identify the necessary authigenic silicate phases in sufficient quantities in marine sediments has led oceanographers to consider different approaches. The current models for seawater composition emphasize the dominant role played by the balance between the various inputs and outputs from the ocean. Mass balance calculations have become more important than solubility relationships in explaining oceanic chemistry. The difference between the equilibrium and mass balance points of view is not just a matter of mathematical and chemical formalism. In the equilibrium case, one would expect a very constant composition of the ocean and its sediments over geological time. In the other case, historical variations in the rates of input and removal should be reflected by changes in ocean composition and may be preserved in the sedimentary record. Models that emphasize the role of kinetic and material balance considerations are called kinetic models of seawater. This reasoning was pulled together by Broecker (1971) in a paper called “A kinetic model for the chemical composition of sea water.”
10.4.4.1 Fast processes – internal cycling
The most obvious effects of nonequilibrium in the ocean are large variations in present-day composition. These arise mainly as the result of two processes.
1. Biological cycling. Organisms in surface seawater take up dissolved species during their growth. The remains of these organisms sink under the influence of gravity and gradually decompose by oxidation during respiration (release of C, N, P) and corrosion of hard parts (release of Ca, C, Si, trace elements like Ba, Cd, Zn, Cr, Ni, Se). This leads to a vertical segregation in the ocean of low concentrations in the surface and higher concentrations at depth.
2. Oceanic circulation. The process of ocean circulation described earlier yields an ocean circulation pattern that results in progressively older deep water as the water passes, in sequence from the Atlantic, Indian, to the Pacific Ocean. Surface water returns relatively quickly to the place of origin for the deep water.
The superposition of the vertical biological cycle on the horizontal ocean circulation pattern leads to three general features in the distribution of the elements involved in this cycle.
1. The warm surface ocean tends to have a constant composition.
2. The surface ocean is depleted relative to the deep ocean in those elements fixed by organisms.
3. Deep ocean concentrations increase progressively as the abyssal water flows (ages) from the North Atlantic, through the Indian Ocean to the North Pacific.
The characteristics are demonstrated in Fig. 10-21. As a result the elements influenced in this manner show various degrees of correlation. For element X, in terms of phosphorus:
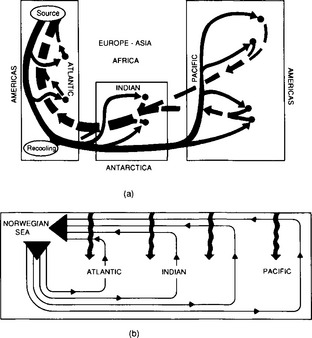
Fig. 10-21 (a) is an idealized map of the patterns of deep water flow (solid lines) and surface water flow (dashed lines). The large circles designate the sinking of NADW (North Atlantic Deep Water) in the Norwegian Sea and the recooling of water along the perimeter of the Antarctic Continent; the dark circles indicate the distributed upwelling which balances this deep water generation. (b) is an idealized vertical section running from the North Atlantic to the North Pacific showing the major advective flow pattern (thin lines) and the rain of particles (thick wavy lines). The combination of these two cycles leads to the observed distribution of nutrients. (Reproduced with permission from W. S. Broecker and T.-H. Peng (1982). “Tracers in the Sea,” p. 34, Eldigio Press, Palisades, NY.)
The moles X/moles P in average plankton is given by a, and b is the surface water concentration in phosphorus free water (water stripped of nutrients). In the case of P itself the surface ocean concentration is close to zero, while the deep Pacific has a concentration of 2.5 µM. For N, the N/P ratio of plankton is 16 and the surface water concentration is 0 µM. The predicted deep sea nitrate is 40 µM. The ratio of (deep)/(surface) is greater than 10. For calcium the Ca/P of plankton = 36 and the surface water content is 10 000 µM. The predicted deep ocean concentration is 10 090 resulting in a deep ocean enrichment ratio of 1.01. These features are summarized for several elements in Table 10-14. Three elements (P, N, Si) show nearly complete depletion in surface water, reflecting the fact that Si limits diatom growth, while P and N limit the remaining organisms. Si shows the largest enrichment in the deep Pacific relative to the deep Atlantic suggesting that biological filtering is more efficient for Si than P. Hard parts of organisms undergo destruction at greater average depths than do the soft parts. Three other elements (C, Ba, Ca) show a similar deep Pacific to surface distribution but of smaller magnitude (less than 10). Note that the present cycle requires less than 100% efficient surface removal, otherwise nutrients would be all in the Pacific after a one-way trip.
Table 10-14
Concentration distributions in the sea for elements used in significant amounts by marine organismsa

a[S], [DA], [DP], represent respectively the concentrations of the given element in warm surface water, deep Atlantic water, and deep Pacific water.
bAmounts in 10−5 mol/L.
cValues are in g/L.
There are two important consequences of this superposition of biological cycling on the ocean circulation pattern that show up in the sediments.
1. It leads to lower diatom productivity in the Atlantic relative to the Pacific.
2. It leads to a tilting of the depth of CaCO3 preservation in the sediments. The deep Pacific is more corrosive to CaCO3 than the deep Atlantic (more CO2 from respiration) and thus CaCO3 is found in sediments 1500 m deeper in the Atlantic than in the Pacific.
10.4.4.2 Long-term processes – control of composition
In the previous section we considered only internal cycling. The questions we want to turn to now are:
1. What controls surface water concentrations?
2. What controls the P content of deep water and thus the deep-water content of other elements?
Broecker’s (1971) approach was to form groups of elements that appear to be controlled by similar processes. We will follow that approach here while examining the important factors and time scales. The groups presented will differ from Broecker’s in that we will include new information on hydrothermal processes not available at the time Broecker wrote his paper (Edmond et al., 1979; McDuff and Morel, 1980). The groups used are kept as close as possible to Broecker’s original list.
10.4.4.2.1 Group la (e.g., Cl).
Elements in this group have long oceanic residence times. These elements are soluble and not reactive. The original source was degassing of the Earth’s interior, which is either very slow now or complete. The main property of this group is geologic removal by formation of soluble salts in evaporite deposits.
The present sources to the ocean are the weathering of old evaporites (75% of river flux) and Cl− carried by atmospherically cycled seasalts (25% of river flux). Loss from the ocean occurs via aerosols (about 25%) and formation of new evaporites. This last process is sporadic and tectonically controlled by the closing of marginal seas where evaporation is greater than precipitation. The oceanic residence time is so long for Cl− (∼100 Myr) that an imbalance between input and removal rates will have little influence on oceanic concentrations over periods of less than tens of millions of years.
10.4.4.2.2 Group Ib (Mg, SO4, probably K).
The key property of this group is removal during seafloor hydrothermal circulation. This fits in with Broecker’s original group I, tectonically controlled elements, but enlarged by two (Mg, K).
A simple model can be used to describe this control of the concentration. In this model the input is from rivers and the output is uptake by reactions in the ocean crust under hydrothermal systems. (An application of this model is given in Section 13.5). Thus
where Vriv is the river volume per unit time and Vhydro the hydrothermal circulation rate; Criv is the river concentration and Csw is the normal seawater concentration.
Hydrothermal vents have near-zero concentrations of Mg. Therefore
The present-day best estimates are that Vriv/Vhydro is about 300. As Vhydro increases, e.g. faster spreading of ocean crust at ridges, Csw responds. The dominant control is tectonics.
10.4.4.2.3 Group II (Ca, Na).
This group includes the remaining cations with relatively long residence times. One important constraint is the charge balance of seawater, re-arranged in the following format:
Tectonic processes control the terms on the right-hand side, as already discussed. This also defines the sum of terms on the left-hand side. The control of the relative proportions of elements on the left-hand side is uncertain. The most plausible controls based on present data are:
10.4.4.2.4 Group III (Si, P, C, N, trace elements).
The common property of these elements is that they are biologically reactive and are deposited as thermodynamically unstable debris. For each of these elements kinetic controls can be hypothesized. A first step is to describe the present-day situation.
Let us define a two-box model for a steady-state ocean as shown in Fig. 10-22. The two well mixed reservoirs correspond to the surface ocean and deep oceans. We assume that rivers are the only source and sediments are the only sink. Elements are also removed from the surface box by biogenic particles (B). We also assume there is mixing between the two boxes that can be expressed as a velocity Vmix = 2 m/yr and that rivers input water to the surface box at a rate of Vriv = 0.1 m/yr. The resulting ratio of Vmix/Vriv is 20.
Water conservation can be expressed as
The mass balance for biogenic elements in the surface box is
where f is the fraction of the biogenic flux (B) buried and (1 – f) is the fraction of B regenerated in the deep box. For the entire ocean the balance for biogenic elements is
Now that we have defined the biogenic model we can define two important properties. The first is the ratio of falling particles to the input to the surface. This property (g) is equivalent to the efficiency of bioremoval from surface waters:
As stated earlier, Vmix/Vriv = 20. The resulting values of g for several biogenic elements are given in Table 10-15. For Si, N, and P at least 95% of the elements brought to the surface are
Table 10-15
Parameters for element cycles within the sea

aRiver value poorly known
bCorrected for atmospheric recycling.
removed in particulate biogenic form. Only 20% of the C is removed in this form.
The second property is the fraction of particles sinking that are preserved in the sediments:
The values of f(Table 10-15) for N, P, C, and Si are 2% or less and are about 12% for Ba and Ca.
The product fg gives us the fraction of the elements that are permanently removed for each visit to the surface ocean. Conversely 1/f (fg) gives the number of times an element is recycled before it is permanently removed. For example, for a total ocean residence time of 1600 years, P goes through 105 cycles of 15 years each before being permanently removed.
We can finish this discussion of the biogenic elements by considering the implications of this kind of cycle on the long-term stability of the concentration. Phosphorus will be used as an example. For elements like P, that have a high value of g, the particulate flux responds directly to changes in the input. For P, the main input to the surface layer is upwelling and thus the biogenic particle flux B=VmixPdeep. The system is now operating at close to 100% efficiency. P removal to the sediments depends on the O2 level in the deep ocean. When there is less O2 there is less efficient regeneration of P and thus f increases. The O2 content of the deep sea depends on the balance between the input from above (VmixO2 surf) and O2 consumption during regeneration (e.g., respiration) of the flux B. Suppose the rate of ocean circulation increased. In this simple model we would parametrize this as saying Vmix increases. Because upwelling increases, productivity increases and B increases. Now we have a situation where both fluxes, B and (VmixO2 surf), to the deep ocean increase. The net effect is to stabilize the concentration of P in the deep sea. Suppose there was an increase in river input (VrivCriv) with no change in mixing. Productivity and B increase without a coincident change in the O2 flux (VmixO2 surf = constant). The increased B will result in more O2 consumption (and PO4 release) and thus lower O2 levels in the deep sea. As a result, there will be more efficient P removal to the sediments. Thus f and fB increase, matching the increased river input. Again the net effect is to stabilize the deep P concentration. As f for P increases, the P content of the deep sea will tend to decrease, balancing the tendency to increase that was initially caused by the increased B. The general result is that the P (or N, Si, C) content of the deep sea seeks that level where upwelling of deep water brings PO4 to the surface at a rate such that P in organisms resistant to decomposition just balances the amount of new PO4 entering the sea. This negative feedback model tends to drive the PO4 content of the ocean towards a regulated value where PO4 loss equals PO4 input.
10.4.5 Controls over Long Time Scales
Over multi-million year time scales, the concentration of CO2 in the Earth’s atmosphere is largely controlled by the geochemical carbon cycle, which consists of the exchange of carbon between the rock reservoir and the surficial reservoir (atmosphere, oceans, biosphere and soils) (Berner et al., 1983). This exchange occurs via the weathering of continental silicate rocks and organic matter, transport of and burial of weathering-derived carbonates and organic matter, geothermal breakdown (metamorphosis) of the weathering products at depth and subsequent degassing of CO2 back to the surficial reservoir (Berner, 1990; 1991). The simplified representative equations for these processes are as follows, with the left-to-right reaction representing the surficial-to-rock transfer (Urey, 1952; Berner, 1991):
The first two reactions, which constitute the major controls on atmospheric CO2 on geologic time scales, are sometimes referred to as the Urey reactions. The third reaction denotes net photosynthesis and georespiration. The results of these models suggest that there has been significant variation in atmospheric CO2 over the past 570 Myr with high levels during the Mesozoic and early Paleozoic and low levels during the Permo-Carboniferous and late Cenozoic.
Questions
10-1. There is some debate about what controls the magnesium concentration in seawater. The main input is rivers. The main removal is by hydrothermal processes (the concentration of Mg in hot vent solutions is essentially zero). First, calculate the residence time of water in the ocean due to (1) river input and (2) hydrothermal circulation. Second, calculate the residence time of magnesium in seawater with respect to these two processes. Third, draw a sketch to show this box model calculation schematically. You can assume that uncertainties in river input and hydrothermal circulation are 5% and 10%, respectively. What does this tell you about controls on the magnesium concentration? Do these calculations support the input/removal balance proposed above? Do any questions come to mind? Volume of ocean = 1.4 × 10²¹ L; River input = 3.2 × 10¹⁶ L/yr; Hydrothermal circulation = 1.0 × 10¹⁴ L/yr; Mg concentration in river water = 1.7 × 10⁻⁴ M; Mg concentration in seawater = 0.053 M.
10-2. The flux of oxygen can be in or out of the ocean. The oxygen partial pressure in the atmosphere is 0.20 atm and the Henry’s Law constant is 1.26 × 10⁻³ M/atm. (a) As a result of photosynthesis, the nitrate concentration in seawater originally in equilibrium with the atmosphere has decreased by 20 µM. What is the new (non-equilibrium) oxygen concentration? (b) What is the flux of oxygen due to gas exchange? Use a diffusion coefficient of 2.0 × 10⁻⁵ cm2/s and a film thickness of 50 µm.
10-3. Hydrothermal vents have been sampled at 21° along the East Pacific Rise. The pure end member hydrothermal solutions have a temperature of 350°C and the following major ion composition (von Damm et al. (1985). Geochim. Cosmochim. Acta 49, 2197–2220). All concentrations are in mM and the pH is 3.4. Discuss the ways in which the vent solution composition and speciation differ from average seawater.
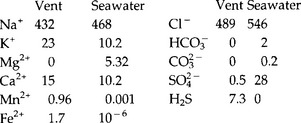
VentSeawater Vent SeawaterNa+432468Cl−489546K+2310.2 02Mg2+05.32
 00.2Ca2+1510.2SO 2 4−0.528Mn2+0.960.001H2S7.30Fe2+1.710−6
10-4. A proponent of “reverse weathering” suggested that gibbsite, kaolinite, and quartz exist in equilibrium according to the following equation. In equilibrium expressions for these reactions, water will appear as the activity, rather than concentration. The activity can be approximated by the mole fraction of water. What is the activity of water if this equilibrium is maintained? Could this equilibrium exist in seawater, where the mole fraction of water is about 0.98? ΔG0 values (kJ/mol): gibbsite –2320.4; kaolinite –3700.7; quartz –805.0; water –228.4.
Alley, R. B., Mayewski, P. A., Sowers, T., et al. Holocene climatic instability; a prominent, widespread event 8200 years ago. Geology. 1997; 25(6):483–486.
Alley, R. B., Meese, D. A., Shuman, C. A., et al. Abrupt increase in Greenland snow accumulation at the end of the Younger Dryas event. Nature. 1993; 362:527–529.
Anderson, L. A., Sarmiento, J. L. Redfield ratios of remineralization by nutrient data analysis. Glob. Biogeochem. Cycles. 1994; 8:65–80.
Archer, D., Peltzer, E. T., Kirchman, D. A timescale for dissolved organic carbon production in equatorial Pacific surface waters. Glob. Biogeochem. Cycles. 1997; 11:435–452.
Report DOE/ER-0239 Baes, C. F., Björkström, A., Mulholland, P. J. Uptake of carbon dioxide by the occeans. In: Trabalka J. R., ed. Atmospheric Carbon Dioxide and the Global Carbon Cycle. Washington, DC: US Department of Energy, Office of Energy Research, 1985.
Barth, T. W. Theoretical Petrology. Washington, DC: Wiley; 1952.
Behl, R. J., Kennett, J. P. Brief interstadial event in the Santa Barbara Basin, NE Pacific, during the last 60 kyr. Nature. 1996; 379:243–246.
Berner, R. A. Atmospheric carbon dioxide levels over Phanerozoic time. Science. 1990; 249:1382–1386.
Berner, R. A. A model for atmospheric CO2 over Phanerozoic time. Am. J. Sci. 1991; 291:339–376.
Berner, E. K., Berner, R. A. The Global Water Cycle. New York: Prentice-Hall, Englewood Cliffs; 1987.
Berner, R. A., Lasaga, A. C., Garrels, R. A. The carbonate-silicate geochemical cycle and its effect on atmospheric carbon dioxide over the past 100 million years. Am. J. Sci. 1983; 283:641–683.
Bond, G., et al. A pervasive millennial-scale cycle in North Atlantic Holocene and glacial climates. Science. 1997; 278:1257–1266.
Bond, G. C., Heinrich, H., Broecker, W. S., et al. Evidence for massive discharges of icebergs into the North Atlantic Ocean during the last glacial period. Nature. 1992; 360:245–249.
Boyle, E., Edmond, J. M. Copper in surface waters south of New Zealand. Nature. 1975; 253:107–109.
Brass, G. W., Turekian, K. K. Strontium distribution in GEOSECS oceanic profiles. Earth Planet. Sci. Lett. 1974; 23:141–148.
Brewer, P. G. Direct observation of the oceanic CO2 increase. Geophys. Res. Lett. 1978; 5:997–1000.
Broecker, W. S. A kinetic model for the chemical composition of seawater. Quatern. Res. 1971; 1:188–207.
Broecker, W. S. The great ocean conveyor. Oceanography. 1991; 4:79–89.
Broecker, W. S. Massive iceberg discharges as triggers for global climate change. Nature. 1994; 372:421–424.
Broecker, W. S. Thermohaline circulation, the Achilles Heel of our climate system: Will man-made CO2 upset the current balance? Science. 1997; 278:1582–1588.
Broecker, W. S., Peng, T. -H. Gas exchange rates between air and sea. Tellus. 1974; 26:21–35.
Broecker, W. S., Peng, T. -H. Tracers in the Sea. New Jersey: Eldigio Press; 1982.
Buesseler, K. O. The decoupling of production and particulate export in the surface ocean. Glob. Biogeochem. Cycles. 1998; 12:297–310.
Burton, K. W., Ling, H. -F., O’Nions, R. K. Closure of the Central American Isthmus and its effect on deep-water formation in the North Atlantic. Nature. 1997; 386:382–385.
Chavez, F. P., Toggweiler, J. R. Physical estimates of global new production: The upwelling contribution. In: Summerhayes C. P., Emeis K. -C., Angel M. V., Smith R. L., Zeitzschel B., eds. Upwelling in the Ocean: Modern Processes and Ancient Records. New York: John Wiley; 1995:313–320.
Chisholm S. W., Morel F. M. M., eds. What controls phytoplankton production in nutrient-rich areas of the open sea? Limnol. Oceanogr.; 36. 1991:1507–1965.
Christensen, J. P., Murray, J. W., Devol, A. H., Codispoti, L. A. Denitrification in continental shelf sediments has major impact on oceanic nitrogen cycle. Glob. Biogeochem. Cycles. 1987; 1:97–116.
Clayton, T. D., Byrne, R. H., Breland, J. A., et al. The role of pH measurements in modern oceanic CO2-system characteristics: precision and thermodynamic consistency. Deep-Sea Res. II. 1995; 42:411–430.
Coale, K. H., Bruland, K. W. Copper complexation in the Northeast Pacific. Limnol. Oceanogr. 1988; 33:1084–1101.
Coale, K. H., Johnson, K. S., Fitzwater, S. E., et al. A massive phytoplankton bloom induced by an ecosystem-scale iron fertilization experiment in the equatorial Pacific Ocean. Nature. 1996; 383:495–501.
Cullen, J. J., Lewis, M. R., Davis, C. O., Barber, R. T. Photosynthetic characteristics and estimated growth rates indicate grazing is the proximate control of primary production in the equatorial Pacific. J. Geophys. Res. 1992; 97:639–654.
Denton, G. H., Hendy, C. H. Documentation of a Younger Dryas glacial advance in the New Zealand Alps. Science. 1994; 264:1434–1437.
de Villiers, S., Nelson, B. K. Detection of low-temperature hydrothermal fluxes by seawater Mg and Ca anomalies. Science. 1999; 285:721–723.
Dickson, A. G. The measurement of seawater pH. Mar. Chem. 1993; 44:131–142.
Dortch, Q. The interactions between ammonium and nitrate uptake in phytoplankton. Mar. Ecol. Prog. Ser. 1990; 61:183–201.
Duce, R. A., Tindale, N. W. Atmospheric transport of iron and its deposition in the ocean. Limnol. Oceanogr. 1991; 36:1715–1726.
Ducklow, H. W., Harris, R. P. JGOFS: The North Atlantic Bloom Experiment. Deep-Sea Res. II. 1993; 40:1–641.
Dugdale, R. C., Goering, J. J. Uptake of new and regenerated forms of nitrogen in primary productivity. Limnol. Oceanogr. 1967; 12:196–206.
Dugdale, R. C., Wilkerson, F. P. Silicate regulation of new production in the equatorial Pacific upwelling. Nature. 1998; 391:270–273.
Dunne, J. P., Murray, J. W., Aufdenkampe, A., Blain, S., Rodier, M. Silicon-nitrogen coupling in the equatorial Pacific upwelling zone. Glob. Biogeochem. Cycles. 1999; 131:715–726.
Edmond, J. M., Measures, C., McDuff, R. E., et al. Ridge crest hydrothermal activity and the balance of the major and minor elements in the ocean: the Galapagos data. Earth Planet. Sci. Lett. 1979; 46:1–18.
Emerson, S., Quay, P., Karl, D., et al. Experimental determination of the organic carbon flux from open-ocean surface waters. Nature. 1997; 389:951–954.
Emerson, S., Quay, P. D., Stump, C., et al. O2, Ar, N2 and 222Rn in surface waters of the subarctic Pacific Ocean. Glob. Biogeochem. Cycles. 1991; 5:49–69.
Emerson, S., Quay, P. D., Stump, C., et al. Chemical tracers of productivity and respiration in the subtropical pacific. J. Geophys. Res. 1995; 100:15873–15887.
Eppley, R. W., Peterson, B. J. Particulate organic matter flux and planktonic new production in the deep ocean. Nature. 1979; 282:677–680.
Fairbanks, R. G. A 17,000-year glacio-eustatic sea level record: influence of glacial melting rates on younger dryas event and deep-ocean circulation. Nature. 1989; 342:637–642.
Falkowski, P. G., Barber, R. T., Smetacek, V. Biogeochemical controls and feedbacks on ocean primary production. Science. 1998; 281:200–206.
Falkowski, P. G., Greene, R., Geider, R. Physiological limitations on phytoplankton productivity in the ocean. Oceanography. 1992; 5:84–91.
Fanning, K. A. Nutrient provinces in the sea: Concentration ratios, reaction rate ratios and ideal covariation. J. Geophys. Res. 1992; 97:5693–5712.
Fasham, M. J. R., Ducklow, H. W., McKelvie, S. M. A nitrogen-based model of plankton dynamics in the ocean mixed layer. J. Mar. Res. 1990; 48:591–639.
Feely, R. A., Wanninkhof, R., Goyet, C., et al. Variability of CO2 distributions and sea-air fluxes in the central and eastern equatorial Pacific during the 1991–94 El Niño. Deep-Sea Res. II. 1997; 44:1851–1868.
Field, C. B., Behrenfeld, M. J., Randerson, J. T., Falkowski, P. Primary production of the biosphere: Integrating terrestrial and oceanic components. Science. 1998; 281:237–240.
Fine, R. A., Peterson, H., Rooth, C. G. H., Ostlund, H. G. Cross-equatorial tracer transport in the upper waters of the Pacific Ocean. J. Geophys. Res. 1983; 88:763–769.
Fitzwater, S. E., Coale, K. H., Gordon, R. M., et al. Iron deficiency and phytoplankton growth in the equatorial Pacific. Deep-Sea Res II. 1996; 43:995–1015.
Frausto da Silva, J. J. R., Williams, R. J. P. The Biological Chemistry of the Elements. Clarendon Press; 1991.
Frost, R. W., Franzen, N. C. Grazing and iron limitation in the control of phytoplankton stock and nutrient concentration: A chemostat analogue of the Pacific equatorial upwelling zone. Mar. Ecol. Prog. Ser. 1992; 83:291–303.
Frost, R. W. Grazing control of phytoplankton stock in the open subarctic Pacific ocean: a model assessing the role of mesozooplankton, particularly the large calanoid copepods Neocalanus spp. Mar. Ecol. Prog. Ser. 1987; 39:49–68.
Gaillard, J. -F., Treguer, P. Antares I: France JGOFS in the Indian Sector of the Southern Ocean: Benthic and water column processes. Deep-Sea Res. II. 1997; 44:951–1176.
Gammon, R. H., Cline, J., Wisegarver, D. Chlorofluoromethanes in the Northeast Pacific Ocean: measured vertical distributions and application as transient tracers of upper ocean mixing. J. Geophys. Res. 1982; 87:9441–9454.
Garrels, R. M., Mackenzie, F. T., Origin of the chemical compositions of some springs and lakesStumm W., ed. Equilibrium Concepts in Natural Water Systems. Advances in Chemistry Series 67. American Chemical Society, Oxford, 1967. 222–274.
Garrels, R. M., Thompson, M. E. A chemical model for seawater at 25°C and one atmosphere total pressure. Am. J. Sci. 1962; 260:57–66.
Goldschmidt, V. M. The principles of distribution of chemical elements in minerals and rocks. J. Chem. Soc. 1937; 1937:655–674.
Gordon, A. L. Indian-Atlantic transfer of thermocline water at the Agulhas retroflection. Science. 1985; 227:1030–1033.
Gruber, N., Sarmiento, J. L. Global patterns of marine nitrogen fixation and denitrification. Glob. Biogeochem. Cycles. 1997; 11:235–266.
Hansell, D., Carlson, C. A. Deep-ocean gradients in the concentration of dissolved organic carbon. Nature. 1998; 395:263–266.
(in press) Hansell, D. A., Peltzer, E. T. Spatial and temporal variations of total organic carbon in the Arabian Sea. Deep-Sea Res. II. 1998.
Hansell, D. A., Bates, N. R., Carlson, C. A. Predominance of vertical loss of carbon from surface waters of the equatorial Pacific Ocean. Nature. 1997; 386:59–61.
Hartmann, D. L. Global Physical Climatology. Washington: Academic Press; 1994.
Haug, G. H., Tiedemann, R. Effect of the formation of the Isthmus of Panama on Atlantic Ocean thermohaline circulation. Nature. 1998; 393:673–676.
Hedges, J. I., Lee, C. Measurement of dissolved organic carbon and nitrogen in natural waters. Mar. Chem. 1993; 41:290.
Jenkins, W. J. Tritium and 3He in the Sargasso Sea. J. Mar. Res. 1980; 38:533–569.
Jenkins, W. J., Goldman, J. C. Seasonal oxygen cycling and primary production in the Sargasso Sea. J. Mar. Res. 1985; 43:465–491.
Johnson, K. S., Coale, K. H., Jannasch, H. W. Analytical chemistry in oceanography. Anal. Chem. 1992; 64:1065A–1075A.
Johnson, K. S., Gordon, R. M., Coale, K. H. What controls dissolved iron concentration in the world ocean? Mar. Chem. 1997; 57:137–161.
Johnson, K. M., Wills, K. D., Butler, D. B., et al. Coulometric total carbon dioxide analysis for marine studies: maximizing the performance of an automated gas extraction system and coulometric detector. Mar. Chem. 1993; 44:167–187.
Joyce, T. M., Warren, B. A., Talley, L. D. The geothermal heating of the abyssal subarctic Pacific Ocean. Deep-Sea Res. 1986; 33:1003–1015.
Karl D. M., Michaels A. F., eds. Ocean Time-Series: Results from the Hawaii and Bermuda Research Programs. Deep-Sea Res. II; 43. 1996:127–685.
Karl, D. M., Letelier, R., Hebel, D., et al. Ecosystem changes in the North Pacific subtropical gyre attributed to the 1991–92 El Niño. Nature. 1995; 373:230–234.
Karl, D., Letelier, R., Tupas, L., et al. The role of nitrogen fixation in biogeochemical cycling in the subtropical North Pacific Ocean. Nature. 1997; 388:533–538.
Kastner, M. The contribution of authigenic feldspars to the geochemical balance of alkalic metals. Geochim. Cosmochim. Acta. 1974; 38:650–653.
Keigwin, L. D. Isotope paleoceanography of the Caribbean and east Pacific: role of Panama uplift in late Neogene time. Science. 1982; 217:350–353.
Kessler, W. S., McPhaden, M. J. The 1991–1993 El Niño in the central Pacific. Deep-Sea Res. II. 1995; 42:295–334.
Ku, T. L., Knauss, K. G., Mathieu, G. G. Uranium in open ocean: concentration and isotopic concentration. Deep-Sea Res. 1977; 24:1005–1017.
Landry, M. R., Barber, R. T., Bidigare, R. R., et al. Iron and grazing constraints on primary production in the central equatorial Pacific: and EqPac synthesis. Limnol. Oceanogr. 1997; 42:405–418.
Lasaga, A. C. The kinetic treatment of geochemical cycles. Geochim. Cosmochim. Acta. 1980; 44:815–828.
Lasaga, A. C. Dynamic treatment of geochemical cycles: global kinetics. In: Lasaga A. C., Kirkpatrick R. J., eds. Kinetics of Geochemical Processes. San Diego: Mineral. Soc. Amer. ; 1981:69–110.
Li, Y. -H. Confusion of the mathematical notation for defining the residence time. Geochim. Cosmochim. Acta. 1977; 44:555–556.
Li, Y. -H. Ultimate removal mechanisms of elements from the ocean. Geochim. Cosmochim. Acta. 1981; 45:1659–1664.
Li, T. -H., Takahasi, T., Broecker, W. S. The degree of saturation of CaCO3 in the oceans. J. Geophys. Res. 1969; 74:5507–5525.
Liss, P. S., Merlivat, L. Air-sea gas exchange rates: introduction and synthesis. In: Buat-Menard P., ed. The Role of Air-Sea Exchange on Geochemical Cycling. Washington, DC: Reidel; 1986:113–127.
Liss, P. S., Slater, P. G. Flux of gases across the air-sea interface. Nature. 1974; 247:181–184.
Loukos, H., Frost, B., Harrison, D. E., Murray, J. W. An ecosystem model with iron limitation of primary production in the equatorial Pacific at 140°W. Deep-Sea Res. II. 1997; 44:2221–2249.
Mackenzie, F. T., Garrels, R. M. Chemical mass balance between rivers and oceans. Am. J. Sci. 1966; 264:507–525.
Maier-Reimer, E., Mikolajewicz, U., Crowley, T. J. Ocean general circulation model sensitivity experiment with an open American Isthmus. Paleoceanography. 1990; 5:349–366.
Manabe, S., Stouffer, R. J. Simulation of abrupt climate change induced by freshwater input to the North Atlantic Ocean. Nature. 1995; 378:165–167.
Mantyla, A. W. On the potential temperature in the abyssal Pacific Ocean. J. Mar. Res. 1975; 33:341–354.
Mantyla, A. W., Reid, J. L. Abyssal characteristics of the world ocean waters. Deep Sea Res. 1983; 30:805–833.
Martin, J. H. Glacial-interglacial CO2 change: The iron hypothesis. Paleoceanography. 1990; 5:1–13.
Martin, J. H., Fitzwater, S. E. Iron deficiency limits phytoplankton growth in the northeast Pacific subarctic. Nature. 1988; 331:341–343.
Martin, J. H., Gordon, R. M., Fitzwater, S., Broerkow, W. W. VERTEX: phytoplankton/iron studies in the Gulf of Alaska. Deep-Sea Res. 1989; 36:649–680.
Martin, J. H., Gordon, R. M., Fitzwater, S. E. Iron in Antarctic waters. Nature. 1990; 345:156–158.
Martin, J. H., et al. Testing the iron hypothesis in ecosystems of the equatorial Pacific Ocean. Nature. 1994; 371:123–129.
McCarthy, M., Pratum, T., Hedges, J., Benner, R. Chemical composition of dissolved organic nitrogen in the ocean. Nature. 1997; 390:150–154.
McCarthy, J. J., Garside, C., Nevins, J. L., Barber, R. T. New production along 140°W in the equatorial Pacific during and following the 1992 El Niño event. Deep-Sea Res. II. 1996; 43:1065–1094.
McDuff, R. E., Morel, F. M. M. The geochemical control of seawater (Sillen revisited). Environ. Sci. Tech. 1980; 14:1182–1186.
McPhaden, M. J. TOGA-TAO and the 1991–93 El Niño-Southern Oscillation event. Oceanography. 1993; 6:36–44.
McPhaden, M. J., Busalacchi, A. J., Cheney, R., et al. The tropical ocean-global atmosphere observing system: A decade of progress. J. Geophys. Res. 1998; 103:14169–14240.
Menzel, D. W. Primary productivity, dissolved and particulate organic matter and the sites of oxidation of organic matter. In: Goldberg E. D., ed. The Sea. Norwell, MA: Wiley, 1974.
Michaels, A. F., Bates, N. R., Buesseler, K. O., et al. Carbon-cycle imbalances in the Sargasso Sea. Nature. 1994; 372:537–540.
Michalopoulos, P., Aller, R. C. Rapid clay mineral formation in Amazon Delta sediments: reverse weathering and oceanic elemental cycles. Science. 1995; 270:614–617.
Miller, C. B., Frost, B. W., Wheeler, P. A., et al. Ecological dynamics in the subarctic Pacific, a possible iron-limited ecosystem. Limnol. Oceanogr. 1991; 36:1600–1615.
Millero, F. J. What is PSU? Oceanography. 1993; 6:67.
Millero, F. J. Thermodynamics of the carbon dioxide system in the ocean. Geochim. Cosmochim. Acta. 1995; 59:661–677.
Morel, F. M. M., Reinfelder, J. R., Roberts, S. B., et al. Zinc and carbon co-limitation of marine phytoplankton. Nature. 1994; 369:740–742.
Murray J. W., ed. A U. S. JGOFS Process Study in the equatorial Pacific. Deep-Sea Res. II; 42. 1995:275–903.
Murray J. W., ed. A U. S. JGOFS Process Study in the equatorial Pacific. Part 2. Deep-Sea Res. II; 43. 1996:687–1435.
Murray, J. W., Barber, R. T., Roman, M. R., et al. Physical and biological controls on carbon cycling in the equatorial Pacific. Science. 1994; 266:58–65.
Murray J. W., LeBorgne R., Dandonneau Y., eds. A JGOFS Process Study in the Equatorial Pacific. Deep-Sea Res. II; 44. 1997:1759–2317.
Murray, J. W., Ozsoy, E., Top, Z. Temperature and salinity distributions in the Black Sea. Deep-Sea Res. 1991; 38:S663–S689.
Murray, J. W., Young, J., Newton, J., et al. Export flux of particulate organic carbon from the central equatorial Pacific determined using a combined drifting trap-234Th approach. Deep-Sea Res. II. 1996; 45:1095–1132.
Ostlund, G. G., Fine, R. A. Oceanic distribution and transport of tritium. In: IAEA-SM-232162. New York: Intl. Atom. Energy Agency; 1979:303–314.
Ostlund, H. G., Dorsey, H. G., Rooth, C. G. GEOSECS North Atlantic radiocarbon and tritium results. Earth Planet. Sci. Lett. 1974; 23:69–86.
Parsons, T. R., Takahashi, M., Hargrave, B. Biological Oceanographic Processes, 2nd edn. Vienna: Pergamon; 1977.
Peltzer, E. T., Hayward, N. A. Spatial and temporal variability of total organic carbon along 140 W in the equatorial Pacific Ocean in 1992. Deep-Sea Res. II. 1996; 43:1155–1180.
Peng, T. -H., Broecker, W. S., Mathieu, G. G., Li, Y. -H. Radon evasion rates in the Atlantic and Pacific oceans as determined during the GEOSECS program. J. Geophys. Res. 1979; 84:2471–2486.
Perry, M. J. Phosphate utilization by an oceanic diatom in phosphorus-limited chemostat culture and in the oligotrophic waters of the central North Pacific. Limnol. Oceanogr. 1976; 21:88–107.
Philander, S. G. El Niño, La Niña and the Southern Oscillation. New York: Academic Press; 1990.
Pickard, G. L., Emery, W. J. Descriptive Physical Oceanography, 4th edn. San Diego: Pergamon Press; 1982.
Platt, T., Harrison, W. G. Biogenic fluxes of carbon and oxygen in the ocean. Nature. 1985; 318:55–58.
Platt, T., Sathyendranth, S. Oceanic primary production: Estimation by remote sensing at local and regional scales. Science. 1988; 241:1613–1620.
Price, N. M., Morel, F. M. M. Cadmium and cobalt substitution for zinc in a marine diatom. Nature. 1990; 344:658–660.
Price, N. M., Morel, F. M. M. Colimitation of phytoplankton growth by nickel and nitrogen. Limnol. Oceanogr. 1991; 36:1071–1077.
Quinby-Hunt, M. S., Turekian, K. K. Distribution of elements in sea water. EOS. 1983; 64:130–131.
Raven, J. A., Johnston, A. M. Mechanisms of inorganic-carbon acquisition in marine phytoplankton and their implications for the use of other resources. Limnol. Oceanogr. 1991; 36:1701–1714.
Redfield, A. C., Ketchum, B. H., Richards, F. A. The influence of organisms on the composition of seawater. In: Hill M. N., ed. The Sea. Oxford: Wiley-Interscience; 1963:26–77.
Rooth, C. G., Ostlund, H. G. Penetration of tritium into the Atlantic thermocline. Deep Sea Res. 1972; 19:481–492.
Rue, E. L., Bruland, K. W. Complexation of iron (III) by natural organic ligands in the Central North Pacific as determined by a new competitive ligand equilibration/adsorptive cathodic stripping voltammetric method. Mar. Chem. 1995; 50:117–138.
Ryther, J. H. Photosynthesis and fish production in the sea. Science. 1969; 166:72–76.
Sarmiento, J. L., Rooth, C. G. H., Roether, W. The North Atlantic tritium distribution in 1972. J. Geophys. Res. 1982; 87:8047–8056.
Siegenthaler, U., Sarmiento, J. L. Atmospheric carbon dioxide and the ocean. Nature. 1993; 365:119–125.
Publication 67. Sillén, L. G., The physical chemistry of seawaterSears M., ed. Oceanography, International Oceanographic Congress. New York, 1959. American Association for the Advancement of Science, New York, 1961. 549–581.
Sillén, L. G. The ocean as a chemical system. Science. 1967; 156:1189–1196.
Smetacek V., de Baar H. J. W., Bathmann U. V., et al, eds. Ecology and biogeochemistry of the Antarctic Circumpolar current during austral spring: Southern Ocean JGOFS Cruise ANT Ö /6 of R. V. Polarstern. Deep-Sea Res. II; 44. 1997:1–519.
Smith S., ed. U. S. JGOFS Arabian Sea Process Study. Deep-Sea Res. II; 45. 1998.
Smith, W. H. F., Sandwell, D. T. Global seafloor topography from satellite altimetry and ship depth soundings. Science. 1997; 277:1956–1962.
Stommel, H. The abyssal circulation. Deep-Sea Res. 1958; 5:80–82.
Stommel, H., Arons, A. On the circulation of the world ocean, 1 and 2. Deep-Sea Res 1960; 6:140–154. Stommel, H., Arons, A., On the circulation of the world ocean, 1 and 2. Deep-Sea Res. 1960; 6:217–233.
Stuiver, M., Quay, P. D., Ostlund, H. G. Abyssal water carbon-14 distribution and the age of the world oceans. Science. 1983; 219:849–851.
Stumm, W., Brauner, P. A., Chemical speciationRiley, J. P., Skirrow, G., eds. Chemical Oceanography, 2nd edn., Vol. 1. Washington DC: Academic Press, 1975; 173–240.
Stumm, W., Morgan, J. J. Aquatic Chemistry, 3rd edn. London: Wiley; 1996.
Suess, E. Particulate organic carbon flux in the oceans-surface productivity and oxygen utilization. Nature. 1980; 288:260–263.
Sunda, W., Guillard, R. R. L. The relationship between cupric ion activity and the toxicity of copper to phytoplankton. J. Mar. Res. 1976; 34:511–529.
Sunda, W. G., Swift, D. G., Huntsman, S. A. Low iron requirements for growth in oceanic phytoplankton. Nature. 1991; 351:55–57.
Tai, C. -K., Wunsch, C. Absolute measurement by satellite altimetry of dynamic topography of the Pacific Ocean. Nature. 1983; 301:408–410.
Takahashi, T., Broecker, W. S., Langer, S. Redfield ratio based on chemical data from isopycnal surfaces. J. Geophys. Res. 1985; 90:6907–6924.
Turner D., Owens N., Priddle J., eds. Southern Ocean JGOFS: The UK “Sterna”Study in the Bellingshausen Sea. Deep-Sea Res. II; 42. 1995:907–1335.
UNESCO, Background papers and supporting data on the Practical Salinity Scale 1978. UNESCO Technical Papers in Marine Science No. 37. UNESCO, New York, 1981.
Urey, H. C. The Planets, Their Origin and Development. New Haven: Yale Univ. Press; 1952.
Van Weering T. C. E., Helder W., Schalk P., eds. Netherlands Indian ocean Program 1992–1993: First Results. Deep-Sea Res. II; 44. 1997:1177–1480.
Wallace, J. M., Rasmusson, E. M., Mitchell, T. P., et al. On the structure and evolution of ENSO-related climate variability in the tropical Pacific: Lessons from TOGA. J. Geophys. Res. 1998; 102:14,241–14,259.
Wanninkhof, R. Relationship between gas exchange and wind speed over the ocean. J. Geophys Res. 1992; 97:7373–7381.
Warren, B. A. Why is no deepwater found in the North Pacific? J. Mar. Res. 1983; 41:327–347.
Waser, J. Basic Chemical Thermodynamics. W. A. Benjamin; 1966.
Whitfield, M. The mean oceanic residence time (MORT) concept — a rationalization. Mar. Chem. 1979; 8:101–123.
Whitfield, M., Turner, D. R. Water-rock partition coefficients and the composition of sea-water and river water. Nature. 1979; 278:132–137.
Williams, P. M. The distribution and cycling of organic matter in the ocean. In: Faust S. D., Hunter J. W., eds. Organic Compounds in Aquatic Environments. New York: Dekker, 1971.
Williams, P. J. LeB., Biological and chemical aspects of dissolved organic matter in seawaterRiley, J. P., Skirrow, G., eds. Chemical Oceanography, Vol. 2. New York: Academic Press, 1975.
Wilson, T. R. S., Salinity and the major elements of seawaterRiley, J. P., Skirrow, G., eds. Chemical Oceanography, 2nd edn, Vol. I. London: Academic Press, 1975.
Wolgemuth, K., Broecker, W. S. Barium in seawater. Earth Planet. Sci. Lett. 1970; 8:372–388.
Worthington, L. V. The Norwegian Sea as a Mediterranean basin. Deep Sea Res. 1970; 17:77–84.
Worthington, L. V. The water masses of the world ocean: Some results of fine-scale census. In: Warren B. A., Wunsch C., eds. Evolution of Physical Oceanography. London: MIT Press, 1981.
Zauker, F., Broecker, W. S. Influence of interocean fresh water transports on ocean thermohaline circulation. J. Geophys. Res. 1992; 97:2765–2773.
