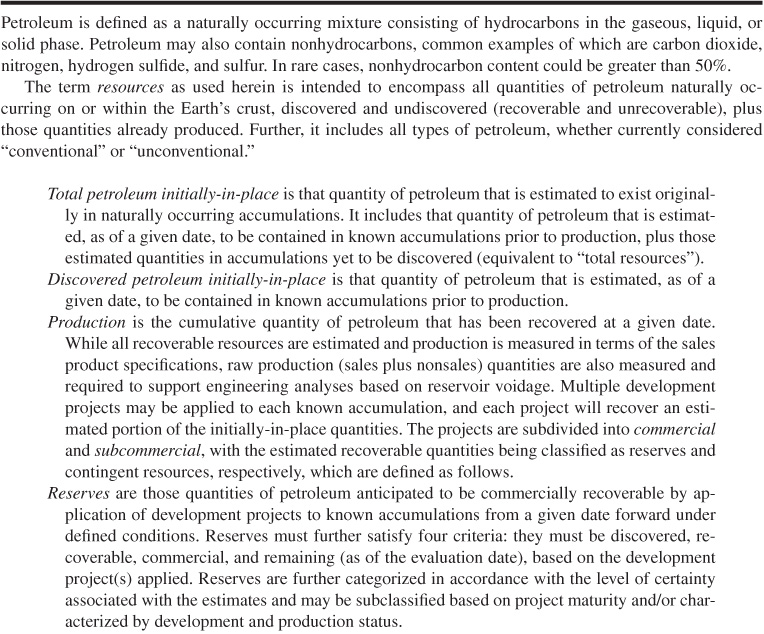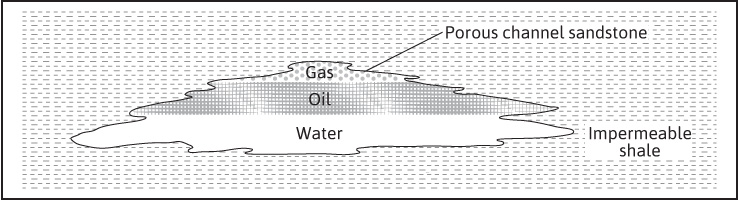
Figure 1.1 Schematic representation of a hydrocarbon deposit in a stratigraphic trap.
While the modern petroleum industry is commonly said to have started in 1859 with Col. Edwin A. Drake’s find in Titusville, Pennsylvania, recorded history indicates that the oil industry began at least 6000 years ago. The first oil products were used medicinally, as sealants, as mortar, as lubricants, and for illumination. Drake’s find represented the beginning of the modern era; it was the first recorded commercial agreement to drill for the exclusive purpose of finding petroleum. While the well he drilled was not commercially successful, it did begin the petroleum era by leading to an intense interest in the commercial production of petroleum. The petroleum era had begun, and with it came the rise of petroleum geology and reservoir engineering.
Oil and gas accumulations occur in underground traps formed by structural and/or stratigraphic features.1* Figure 1.1 is a schematic representation of a stratigraphic trap. Fortunately, the hydrocarbon accumulations usually occur in the more porous and permeable portion of beds, which are mainly sands, sandstones, limestones, and dolomites; in the intergranular openings; or in pore spaces caused by joints, fractures, and solution activity. A reservoir is that portion of the trapped formation that contains oil and/or gas as a single hydraulically connected system. In some cases the entire trap is filled with oil or gas, and in these instances the trap and the reservoir are the same. Often the hydrocarbon reservoir is hydraulically connected to a volume of water-bearing rock called an aquifer. Many reservoirs are located in large sedimentary basins and share a common aquifer. When this occurs, the production of fluid from one reservoir will cause the pressure to decline in other reservoirs by fluid communication through the aquifer.
* References throughout the text are given at the end of each chapter.
Hydrocarbon fluids are mixtures of molecules containing carbon and hydrogen. Under initial reservoir conditions, the hydrocarbon fluids are in either a single-phase or a two-phase state. A single-phase reservoir fluid may be in a liquid phase (oil) or a gas phase (natural gas). In either case, when produced to the surface, most hydrocarbon fluids will separate into gas and liquid phases. Gas produced at the surface from a fluid that is liquid in the reservoir is called dissolved gas. Therefore, a volume of reservoir oil will produce both oil and the associated dissolved gas at the surface, and both dissolved natural gas and crude oil volumes must be estimated. On the other hand, liquid produced at the surface from a fluid that is gas in the reservoir is called gas condensate because the liquid condenses from the gas phase. An older name for gas condensate is gas distillate. In this case, a volume of reservoir gas will produce both natural gas and condensate at the surface, and both gas and condensate volumes must be estimated. Where the hydrocarbon accumulation is in a two-phase state, the overlying vapor phase is called the gas cap and the underlying liquid phase is called the oil zone. There will be four types of hydrocarbon volumes to be estimated when this occurs: the free gas or associated gas, the dissolved gas, the oil in the oil zone, and the recoverable natural gas liquid (condensate) from the gas cap.
Although the hydrocarbons in place are fixed quantities, which are referred to as the resource, the reserves depend on the mechanisms by which the reservoir is produced. In the mid-1930s, the American Petroleum Institute (API) created a definition for reserves. Over the next several decades, other institutions, including the American Gas Association (AGA), the Securities and Exchange Commissions (SEC), the Society of Petroleum Engineers (SPE), the World Petroleum Congress (now Council; WPC), and the Society of Petroleum Evaluation Engineers (SPEE), have all been part of creating formal definitions of reserves and other related terms. Recently, the SPE collaborated with the WPC, the American Association of Petroleum Geologists (AAPG), and the SPEE to publish the Petroleum Resources Management System (PRMS).2 Some of the definitions used in the PRMS publication are presented in Table 1.1. The amounts of oil and gas in these definitions are calculated from available engineering and geologic data. The estimates are updated over the producing life of the reservoir as more data become available. The PRMS definitions are obviously fairly complicated and include many other factors that are not discussed in this text. For more detailed information regarding these definitions, the reader is encouraged to obtain a copy of the reference.
Crude oil, natural gas, and water are the substances that are of chief concern to petroleum engineers. Although these substances can occur as solids or semisolids such as paraffin, asphaltine, or gas-hydrate, usually at lower temperatures and pressures, in the reservoir and in the wells, they occur mainly as fluids, either in the vapor (gaseous) or in the liquid phase or, quite commonly, both. Even where solid materials are used, as in drilling, cementing, and fracturing, they are handled as fluids or slurries. The separation of well or reservoir fluid into liquid and gas (vapor) phases depends mainly on temperature, pressure, and the fluid composition. The state or phase of a fluid in the reservoir usually changes with decreasing pressure as the reservoir fluid is being produced. The temperature in the reservoir stays relatively constant during the production. In many cases, the state or phase in the reservoir is quite unrelated to the state of the fluid when it is produced at the surface, due to changes in both pressure and temperature as the fluid rises to the surface. The precise knowledge of the behavior of crude oil, natural gas, and water, singly or in combination, under static conditions or in motion in the reservoir rock and in pipes and under changing temperature and pressure, is the main concern of reservoir engineers.
As early as 1928, reservoir engineers were giving serious consideration to gas-energy relationships and recognized the need for more precise information concerning physical conditions in wells and underground reservoirs. Early progress in oil recovery methods made it obvious that computations made from wellhead or surface data were generally misleading. Sclater and Stephenson described the first recording bottom-hole pressure gauge and a mechanism for sampling fluids under pressure in wells.3 It is interesting that this reference defines bottom-hole data as measurements of pressure, temperature, gas-oil ratio, and the physical and chemical natures of the fluids. The need for accurate bottom-hole pressures was further emphasized when Millikan and Sidwell described the first precision pressure gauge and pointed out the fundamental importance of bottom-hole pressures to reservoir engineers in determining the most efficient oil recovery methods and lifting procedures.4 With this contribution, the engineer was able to measure the most important basic data for reservoir performance calculations: reservoir pressure.
The study of the properties of rocks and their relationship to the fluids they contain in both the static and flowing states is called petrophysics. Porosity, permeability, fluid saturations and distributions, electrical conductivity of both the rock and the fluids, pore structure, and radioactivity are some of the more important petrophysical properties of rocks. Fancher, Lewis, and Barnes made one of the earliest petrophysical studies of reservoir rocks in 1933, and in 1934, Wycoff, Botset, Muskat, and Reed developed a method for measuring the permeability of reservoir rock samples based on the fluid flow equation discovered by Darcy in 1856.5,6 Wycoff and Botset made a significant advance in their studies of the simultaneous flow of oil and water and of gas and water in unconsolidated sands.7 This work was later extended to consolidated sands and other rocks, and in 1940 Leverett and Lewis reported research on the three-phase flow of oil, gas, and water.8
It was recognized by the pioneers in reservoir engineering that before reservoir volumes of oil and gas in place could be calculated, the change in the physical properties of bottom-hole samples of the reservoir fluids with pressure would be required. Accordingly, in 1935, Schilthuis described a bottom-hole sampler and a method of measuring the physical properties of the samples obtained.9 These measurements included the pressure-volume-temperature relations, the saturation or bubble-point pressure, the total quantity of gas dissolved in the oil, the quantities of gas liberated under various conditions of temperature and pressure, and the shrinkage of the oil resulting from the release of its dissolved gas from solution. These data enabled the development of certain useful equations, and they also provided an essential correction to the volumetric equation for calculating oil in place.
The next significant development was the recognition and measurement of connate water saturation, which was considered indigenous to the formation and remained to occupy a part of the pore space after oil or gas accumulation.10,11 This development further explained the poor oil and gas recoveries in low permeability sands with high connate water saturation and introduced the concept of water, oil, and gas saturations as percentages of the total pore space. The measurement of water saturation provided another important correction to the volumetric equation by considering the hydrocarbon pore space as a fraction of the total pore volume.
Although temperature and geothermal gradients had been of interest to geologists for many years, engineers could not make use of these important data until a precision subsurface recording thermometer was developed. Millikan pointed out the significance of temperature data in applications to reservoir and well studies.12 From these basic data, Schilthuis was able to derive a useful equation, commonly called the Schilthuis material balance equation.13 A modification of an earlier equation presented by Coleman, Wilde, and Moore, the Schilthuis equation is one of the most important tools of reservoir engineers.14 It is a statement of the conservation of matter and is a method of accounting for the volumes and quantities of fluids initially present in, produced from, injected into, and remaining in a reservoir at any stage of depletion. Odeh and Havlena have shown how the material balance equation can be arranged into a form of a straight line and solved.15
When production of oil or gas underlain by a much larger aquifer volume causes the water in the aquifer to rise or encroach into the hydrocarbon reservoir, the reservoir is said to be under water drive. In reservoirs under water drive, the volume of water encroaching into the reservoir is also included mathematically in the material balance on the fluids. Although Schilthuis proposed a method of calculating water encroachment using the material-balance equation, it remained for Hurst and, later, van Everdingen and Hurst to develop methods for calculating water encroachment independent of the material balance equation, which apply to aquifers of either limited or infinite extent, in either steady-state or unsteady-state flow.13,16,17 The calculations of van Everdingen and Hurst have been simplified by Fetkovich.18 Following these developments for calculating the quantities of oil and gas initially in place or at any stage of depletion, Tarner and Buckley and Leverett laid the basis for calculating the oil recovery to be expected for particular rock and fluid characteristics.19,20 Tarner and, later, Muskat21 presented methods for calculating recovery by the internal or solution gas drive mechanism, and Buckley and Leverett20 presented methods for calculating the displacement of oil by external gas cap drive and water drive. These methods not only provided means for estimating recoveries for economic studies; they also explained the cause for disappointingly low recoveries in many fields. This discovery in turn pointed the way to improved recoveries by taking advantage of the natural forces and energies, by supplying supplemental energy by gas and water injection, and by unitizing reservoirs to offset the losses that may be caused by competitive operations.
During the 1960s, the terms reservoir simulation and reservoir mathematical modeling became popular.22–24 These terms are synonymous and refer to the ability to use mathematical formulas to predict the performance of an oil or gas reservoir. Reservoir simulation was aided by the development of large-scale, high-speed digital computers. Sophisticated numerical methods were also developed to allow the solution of a large number of equations by finite-difference or finite-element techniques.
With the development of these techniques, concepts, and equations, reservoir engineering became a powerful and well-defined branch of petroleum engineering. Reservoir engineering may be defined as the application of scientific principles to the drainage problems arising during the development and production of oil and gas reservoirs. It has also been defined as “the art of developing and producing oil and gas fluids in such a manner as to obtain a high economic recovery.”25 The working tools of the reservoir engineer are subsurface geology, applied mathematics, and the basic laws of physics and chemistry governing the behavior of liquid and vapor phases of crude oil, natural gas, and water in reservoir rocks. Because reservoir engineering is the science of producing oil and gas, it includes a study of all the factors affecting their recovery. Clark and Wessely urged a joint application of geological and engineering data to arrive at sound field development programs.26 Ultimately, reservoir engineering concerns all petroleum engineers, from the drilling engineer who is planning the mud program, to the corrosion engineer who must design the tubing string for the producing life of the well.
The purpose of this section is to provide an explanation to the reader of the terminology that will be used throughout the book by providing context for the terms and explaining the interaction of the terms. Before defining these terms, note Fig. 1.2, which illustrates a cross section of a producing petroleum reservoir.
A reservoir is not an open underground cavern full of oil and gas. Rather, it is section of porous rock (beneath an impervious layer of rock) that has collected high concentrations of oil and gas in the minute void spaces that weave through the rock. That oil and gas, along with some water, are trapped beneath the impervious rock. The term porosity (φ) is a measure, expressed in percent, of the void space in the rock that is filled with the reservoir fluid.
Reservoir fluids are segregated into phases according to the density of the fluid. Oil specific gravity (γo) is the ratio of the density of oil to the density of water, and gas specific gravity (γg) is the ratio of the density of natural gas to the density of air. As the density of gas is less than that of oil and both are less than water, gas rests at the top of the reservoir, followed by oil and finally water. Usually the interface between two reservoir fluid phases is horizontal and is called a contact. Between gas and oil is a gas-oil contact, between oil and water is an oil-water contact, and between gas and water is a gas-water contact if no oil phase is present. A small volume of water called connate (or interstitial) water remains in the oil and gas zones of the reservoir.
The initial amount of fluid in a reservoir is extremely important. In practice, the symbol N (coming from the Greek word naptha) represents the initial volume of oil in the reservoir expressed as a standard surface volume, such as the stock-tank barrel (STB). G and W are initial reservoir gas and water, respectively. As these fluids are produced, the subscript p is added to indicate the cumulative oil (Np), gas (Gp), or water (Wp) produced.
The total reservoir volume is fixed and dependent on the rock formations of the area. As reservoir fluid is produced and the reservoir pressure drops, both the rock and the fluid remaining in the reservoir expand. If 10% of the fluid is produced, the remaining 90% in the reservoir must expand to fill the entire reservoir void space. When the hydrocarbon reservoir is in contact with an aquifer, both the hydrocarbon fluids and the water in the aquifer expand as hydrocarbons are produced, and water entering the hydrocarbon space can replace the volume of produced hydrocarbons.
To account for all the reservoir fluid as pressure changes, a volume factor (B) is used. The volume factor is a ratio of the volume of the fluid at reservoir conditions to its volume at atmospheric conditions (usually 60°F and 14.7 psi). Oil volume at these atmospheric conditions is measured in STBs (one barrel is equal to 42 gallons). Produced gases are measured in standard cubic feet (SCF). An M (1000) or MM (1 million) or MMM (1 billion) is frequently placed before the units SCF. As long as only liquid phases are in the reservoir, the oil and water volume factors (Bo and Bw) will begin at the initial oil volume factors (Boi and Bwi) and then steadily increase very slightly (by 1%–5%). Once the saturation pressure is reached and gas starts evolving from solution, the oil volume factor will decrease. Gas (Bg) volume factors will increase considerably (10-fold or more) as the reservoir pressure drops. The change in volume factor for a measured change in the reservoir pressure allows for simple estimation of the initial gas or oil volume.
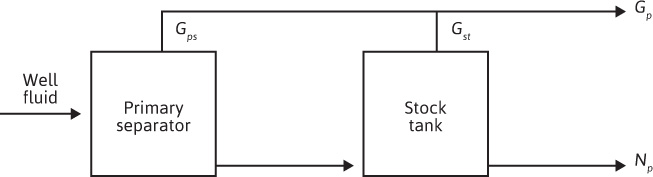
When the well fluid reaches the surface, it is separated into gas and oil. Figure 1.3 shows a two-stage separation system with a primary separator and a stock tank. The well fluid is introduced into the primary separator where most of the produced gas is obtained. The liquid from the primary separator is then flashed into the stock tank. The liquid accumulated in the stock tank is Np, and any gas from the stock tank is added to the primary gas to arrive at the total produced surface gas, Gp. At this point, the produced amounts of oil and gas are measured, samples are taken, and these data are used to evaluate and forecast the performance of the well.
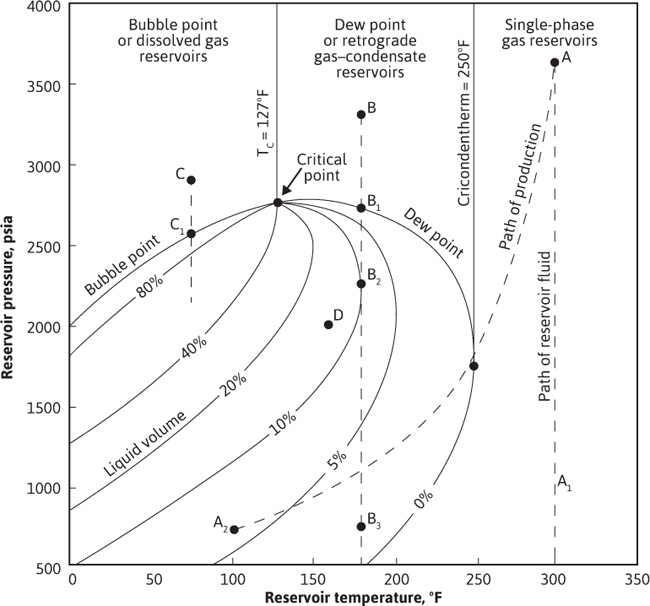
From a technical point of view, the various types of reservoirs can be defined by the location of the initial reservoir temperature and pressure with respect to the two-phase (gas and liquid) envelope as commonly shown on pressure-temperature (PT) phase diagrams. Figure 1.4 is the PT phase diagram for a particular reservoir fluid. The area enclosed by the bubble-point and dew-point curves represents pressure and temperature combinations for which both gas and liquid phases exist. The curves within the two-phase envelope show the percentage of the total hydrocarbon volume that is liquid for any temperature and pressure. At pressure and temperature points located above the bubble-point curve, the hydrocarbon mixture will be a liquid phase. At pressure and temperature points located above or to the right of the dew-point curve, the hydrocarbon mixture will be a gas phase. The critical point, where bubble-point, dew-point, and constant quality curves meet, represents a mathematical discontinuity, and phase behavior near this point is difficult to define. Initially, each hydrocarbon accumulation will have its own phase diagram, which depends only on the composition of the accumulation.
Consider a reservoir containing the fluid of Fig. 1.4 initially at 300°F and 3700 psia, point A. Since this point lies outside the two-phase region and to the right of the critical point, the fluid is originally in a one-phase gas state. Since the fluid remaining in the reservoir during production remains at 300°F, it is evident that it will remain in the single-phase or gaseous state as the pressure declines along path  . Furthermore, the composition of the produced well fluids will not change as the reservoir is depleted. This is true for any accumulation with this hydrocarbon composition where the reservoir temperature exceeds the cricondentherm, or maximum two-phase temperature (250°F for the present example). Although the fluid left in the reservoir remains in one phase, the fluid produced through the wellbore and into surface separators, although the same composition, may enter the two-phase region owing to the temperature decline, as along line
  . This accounts for the production of condensate liquid at the surface from a single-phase gas phase in the reservoir. Of course, if the cricondentherm of a fluid is below approximately 50°F, then only gas will exist on the surface at usual ambient temperatures, and the production will be called dry gas. Nevertheless, even dry gas may contain valuable liquid fractions that can be removed by low-temperature separation.
Next, consider a reservoir containing the same fluid of Fig. 1.4 but at a temperature of 180°F and an initial pressure of 3300 psia, point B. Here the fluid is also initially in the one-phase gas state, because the reservoir temperature exceeds the critical-point temperature. As pressure declines due to production, the composition of the produced fluid will be the same as reservoir A and will remain constant until the dew-point pressure is reached at 2700 psia, point B1. Below this pressure, a liquid condenses out of the reservoir fluid as a fog or dew. This type of reservoir is commonly called a dew-point or a gas-condensate reservoir. This condensation leaves the gas phase with a lower liquid content. The condensed liquid remains immobile at low concentrations. Thus the gas produced at the surface will have a lower liquid content, and the producing gas-oil ratio therefore rises. This process of retrograde condensation continues until a point of maximum liquid volume is reached, 10% at 2250 psia, point B2. The term retrograde is used because generally vaporization, rather than condensation, occurs during isothermal expansion. After the dew point is reached, because the composition of the produced fluid changes, the composition of the remaining reservoir fluid also changes, and the phase envelope begins to shift. The phase diagram of Fig. 1.4 represents one and only one hydrocarbon mixture. Unfortunately, this shift is toward the right and further aggravates the retrograde liquid loss within the pores of the reservoir rock.
Neglecting for the moment this shift in the phase diagram, for qualitative purposes, vaporization of the retrograde liquid occurs from B2 to the abandonment pressure B3. This revaporization aids liquid recovery and may be evidenced by decreasing gas-oil ratios on the surface. The overall retrograde loss will evidently be greater (1) for lower reservoir temperatures, (2) for higher abandonment pressures, and (3) for greater shift of the phase diagram to the right—the latter being a property of the hydrocarbon system. The retrograde liquid in the reservoir at any time is composed of mostly methane and ethane by volume, and so it is much larger than the volume of stable liquid that could be obtained from it at atmospheric temperature and pressure. The composition of this retrograde liquid is changing as pressure declines so that 4% retrograde liquid volume at, for example, 750 psia might contain as much surface condensate as 6% retrograde liquid volume at 2250 psia.
If the initial reservoir fluid composition is found at 2900 psia and 75°F, point C, the reservoir would be in a one-phase state, now called liquid, because the temperature is below the critical-point temperature. This is called a bubble-point (or black-oil or solution-gas) reservoir. As pressure declines during production, the bubble-point pressure will be reached, in this case at 2550 psia, point C1. Below this pressure, bubbles, or a free-gas phase, will appear. When the free gas saturation is sufficiently large, gas flows to the wellbore in ever increasing quantities. Because surface facilities limit the gas production rate, the oil flow rate declines, and when the oil rate is no longer economic, much unrecovered oil remains in the reservoir.
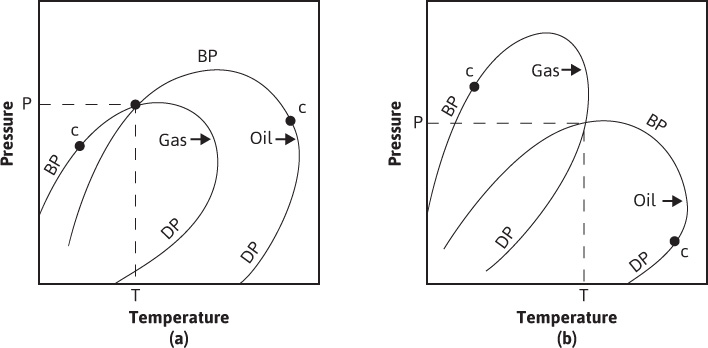
Finally, if the initial hydrocarbon mixture occurred at 2000 psia and 150°F, point D, it would be a two-phase reservoir, consisting of a liquid or oil zone overlain by a gas zone or cap. Because the composition of the gas and oil zones are entirely different from each other, they may be represented separately by individual phase diagrams that bear little relation to each other or to the composite. The liquid or oil zone will be at its bubble point and will be produced as a bubble-point reservoir modified by the presence of the gas cap. The gas cap will be at the dew point and may be either retrograde, as shown in Fig. 1.5(a), or nonretrograde, as shown in Fig. 1.5(b).
Figure 1.5 Phase diagrams of a cap gas and oil zone fluid showing (a) retrograde cap gas and (b) nonretrograde cap gas.
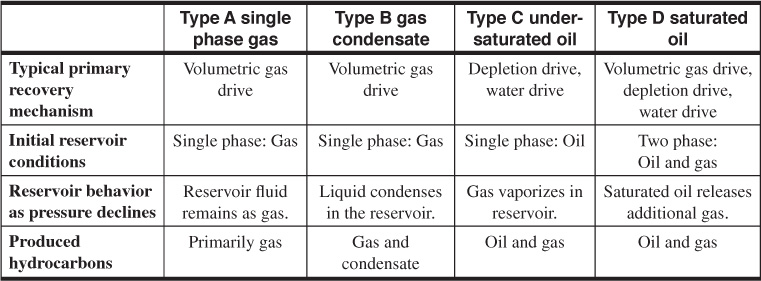
From this technical point of view, hydrocarbon reservoirs are initially either in a single-phase state (A, B, or C) or in a two-phase state (D), depending on their temperatures and pressures relative to their phase envelopes. Table 1.2 depicts a summary of these four types. These reservoir types are discussed in detail in Chapters 4, 5, 6, and 7, respectively.
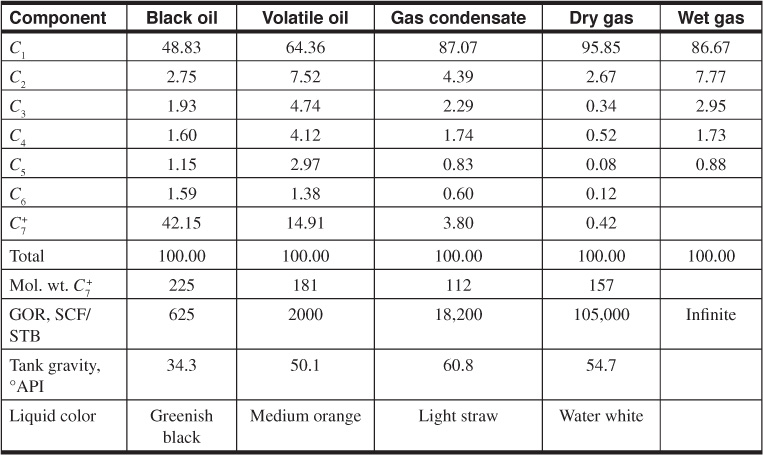
Table 1.3 presents the mole compositions and some additional properties of five single-phase reservoir fluids. The volatile oil is intermediate between the gas condensate and the black, or heavy, oil types. Production with gas-oil ratios greater than 100,000 SCF/STB is commonly called lean or dry gas, although there is no generally recognized dividing line between the two categories. In some legal work, statutory gas wells are those with gas-oil ratios in excess of 100,000 SCF/STB. The term wet gas is sometimes used interchangeably with gas condensate. In the gas-oil ratios, general trends are noticeable in the methane and heptanes-plus content of the fluids and the color of the tank liquids. Although there is good correlation between the molecular weight of the heptanes plus and the gravity of the stock-tank liquid, there is virtually no correlation between the gas-oil ratios and the gravities of the stock-tank liquids, except that most black oil reservoirs have gas-oil ratios below 1000 SCF/STB and stock-tank liquid gravities below 45 °API. The gas-oil ratios are a good indication of the overall composition of the fluid, high gas-oil ratios being associated with low concentrations of pentanes and heavier and vice versa.
The gas-oil ratios given in Table 1.3 are for the initial production of the one-phase reservoir fluids producing through one or more surface separators operating at various temperatures and pressures, which may vary considerably among the several types of production. The gas-oil ratios and consequently the API gravity of the produced liquid vary with the number, pressures, and temperatures of the separators so that one operator may report a somewhat different gas-oil ratio from another, although both produce the same reservoir fluid. Also, as pressure declines in the black oil, volatile oil, and some gas-condensate reservoirs, there is generally a considerable increase in the gas-oil ratio owing to the reservoir mechanisms that control the relative flow of oil and gas to the wellbores. The separator efficiencies also generally decline as flowing wellhead pressures decline, which also contributes to increased gas-oil ratios.
What has been said previously applies to reservoirs initially in a single phase. The initial gas-oil ratio of production from wells completed either in the gas cap or in the oil zone of two-phase reservoirs depends, as discussed previously, on the compositions of the gas cap hydrocarbons and the oil zone hydrocarbons, as well as the reservoir temperature and pressure. The gas cap may contain gas condensate or dry gas, whereas the oil zone may contain black oil or volatile oil. Naturally, if a well is completed in both the gas and oil zones, the production will be a mixture of the two. Sometimes this is unavoidable, as when the gas and oil zones (columns) are only a few feet in thickness. Even when a well is completed in the oil zone only, the downward coning of gas from the overlying gas cap may occur to increase the gas-oil ratio of the production.
Production from petroleum reservoirs is a replacement process. This means that when hydrocarbon is produced from a reservoir, the space that it occupied must be replaced with something. That something could be the swelling of the remaining hydrocarbon due to a drop in reservoir pressure, the encroachment of water from a neighboring aquifer, or the expansion of formation.
The initial production of hydrocarbons from an underground reservoir is accomplished by the use of natural reservoir energy.27 This type of production is termed primary production. Sources of natural reservoir energy that lead to primary production include the swelling of reservoir fluids, the release of solution gas as the reservoir pressure declines, nearby communicating aquifers, gravity drainage, and formation expansion. When there is no communicating aquifer, the hydrocarbon recovery is brought about mainly by the swelling or expansion of reservoir fluids as the pressure in the formation drops. However, in the case of oil, it may be materially aided by gravitational drainage. When there is water influx from the aquifer and the reservoir pressure remains near the initial reservoir pressure, recovery is accomplished by a displacement mechanism, which again may be aided by gravitational drainage.
When the natural reservoir energy has been depleted, it becomes necessary to augment the natural energy with an external source. This is usually accomplished by the injection of gas (reinjected solution gas, carbon dioxide, or nitrogen) and/or water. The use of an injection scheme is called a secondary recovery operation. When water injection is the secondary recovery process, the process is referred to as waterflooding. The main purpose of either a natural gas or water injection process is to repressurize the reservoir and then maintain the reservoir at a high pressure. Hence the term pressure maintenance is sometimes used to describe a secondary recovery process. Often injected fluids also displace oil toward production wells, thus providing an additional recovery mechanism.
When gas is used as the pressure maintenance agent, it is usually injected into a zone of free gas (i.e., a gas cap) to maximize recovery by gravity drainage. The injected gas is usually produced natural gas from the reservoir in question. This, of course, defers the sale of that gas until the secondary operation is completed and the gas can be recovered by depletion. Other gases, such as nitrogen, can be injected to maintain reservoir pressure. This allows the natural gas to be sold as it is produced.
Waterflooding recovers oil by the water moving through the reservoir as a bank of fluid and “pushing” oil ahead of it. The recovery efficiency of a waterflood is largely a function of the macroscopic sweep efficiency of the flood and the microscopic pore scale displacement behavior that is largely governed by the ratio of the oil and water viscosities. These concepts will be discussed in detail in Chapters 9, 10, and 11.
In many reservoirs, several recovery mechanisms may be operating simultaneously, but generally one or two predominate. During the producing life of a reservoir, the predominance may shift from one mechanism to another either naturally or because of operations planned by engineers. For example, initial production in a volumetric reservoir may occur through the mechanism of fluid expansion. When its pressure is largely depleted, the dominant mechanism may change to gravitational drainage, the fluid being lifted to the surface by pumps. Still later, water may be injected in some wells to drive additional oil to other wells. In this case, the cycle of the mechanisms is expansion, gravitational drainage, displacement. There are many alternatives in these cycles, and it is the object of the reservoir engineer to plan these cycles for maximum recovery, usually in minimum time.
Other displacement processes called tertiary recovery processes have been developed for application in situations in which secondary processes have become ineffective. However, the same processes have also been considered for reservoir applications when secondary recovery techniques are not used because of low recovery potential. In this latter case, the word tertiary is a misnomer. For most reservoirs, it is advantageous to begin a secondary or a tertiary process before primary production is completed. For these reservoirs, the term enhanced oil recovery was introduced and has become popular in reference to any recovery process that, in general, improves the recovery over what the natural reservoir energy would be expected to yield. Enhanced oil recovery processes are presented in detail in Chapter 11.
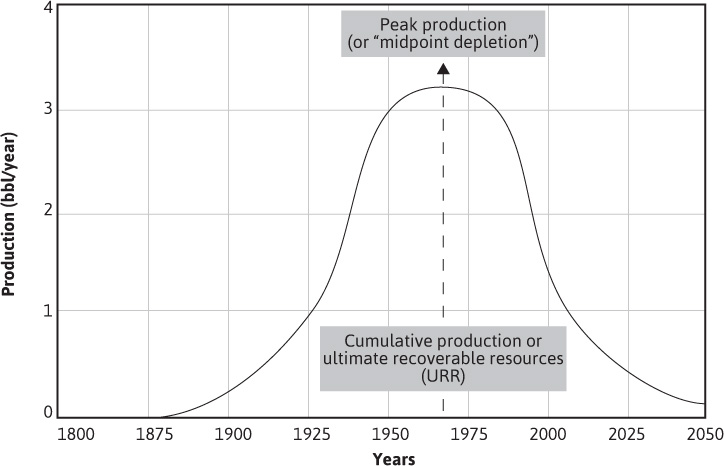
Since oil is a finite resource in any given reservoir, it would make sense that, as soon as oil production from the first well begins in a particular reservoir, the resource of that reservoir is declining. As a reservoir is developed (i.e., more and more wells are brought into production), the total production from the reservoir will increase. Once all the wells that are going to be drilled for a given reservoir have been brought into production, the total production will begin to decline. M. King Hubbert took this concept and developed the term peak oil to describe not the decline of oil production but the point at which a reservoir reaches a maximum oil production rate. Hubbert said this would occur at the midpoint of reservoir depletion or when one-half of the initial hydrocarbon in place had been produced.28 Hubbert developed a mathematical model and from the model predicted that the United States would reach peak oil production sometime around the year 1965.28 A schematic of Hubbert’s prediction is shown in Fig. 1.6.
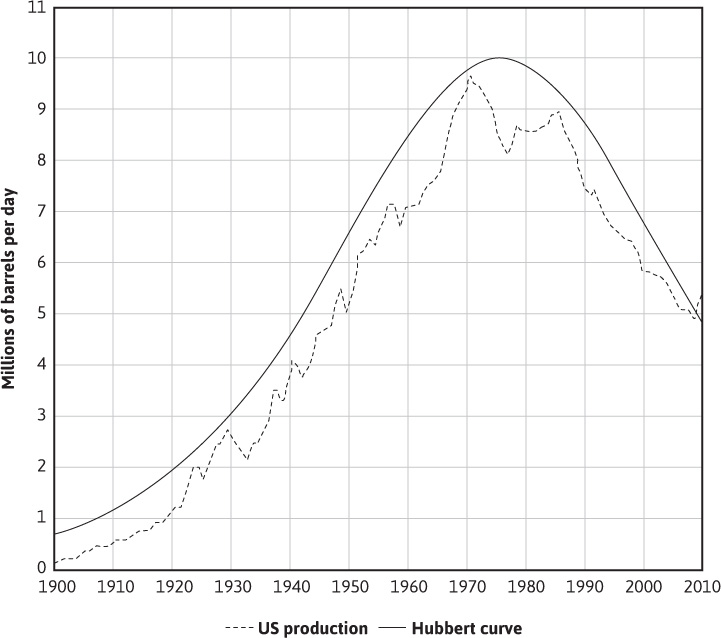
Figure 1.7 contains a plot of the Hubbert curve and the cumulative oil production from all US reservoirs. It would appear that Hubbert was fairly accurate with his model but a little off on the timing. However, the Hubbert timing looks more accurate when production from the Alaskan North Slope is omitted.
Figure 1.7 US crude oil production with the Hubbert curve (courtesy US Energy Information Administration).
There are many factors that go into building such a model. These factors include proven reserves, oil price, continuing exploration, continuing demand on oil resources, and so on. Many of these factors carry with them debates concerning future predictions. As a result, an argument over the concept of peak oil has developed over the years. It is not the purpose of this text to discuss this argument in detail but simply to point out some of the projections and suggest that the reader go to the literature for further information.
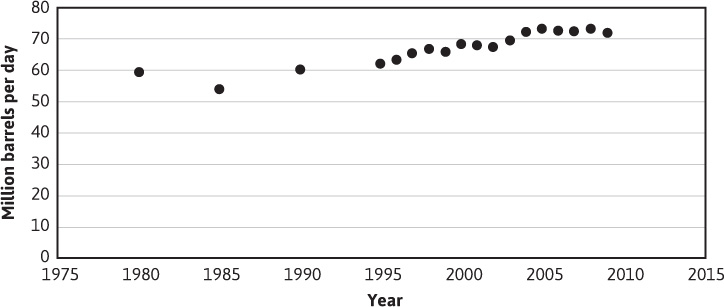
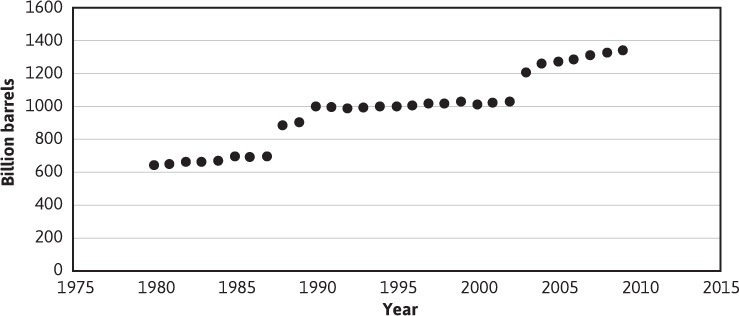
Hubbert predicted the total world crude oil production would reach the peak around the year 2000. Figure 1.8 is a plot of the daily world crude oil production as a function of year. As one can see, the peak has not been reached—in fact, the production is continuing to increase. Part of the discrepancy with Hubbert’s prediction has to do with the increasing amount of world reserves, as shown in Fig. 1.9. Obviously, as the world’s reserves increase, the time to reach Hubbert’s peak will shift. Just as there are several factors that affect the time of peak oil, the definition of reserves has several contributing factors, as discussed earlier in this chapter. This point was illustrated in a recent prediction by the International Energy Agency (IEA) regarding the oil and gas production of the United States.29
In a recent report put out by the IEA, personnel predicted that the United States will become the world’s top oil producer in a few years.29 This is in stark contrast to what they had been predicting for years. The report states the following: “The recent rebound in US oil and gas production, driven by upstream technologies that are unlocking light tight oil and shale gas resources, is spurring economic activity... and steadily changing the role of North America in global energy trade.”29
The upstream technologies that are referenced in the quote are the increased use of hydraulic fracturing and horizontal drilling techniques. These technologies are a large reason for the increase in US reserves from 22.3 billion barrels at the end of 2009 to 25.2 at the end of 2010, while producing nearly 2 billion barrels in 2010.
Hydraulic fracturing or fracking refers to the process of injecting a high-pressure fluid into a well in order to fracture the reservoir formation to release oil and natural gas. This method makes it possible to recover fuels from geologic formations that have poor flow rates. Fracking helps reinvigorate wells that otherwise would have been very costly to produce. Fracking has raised major environmental concerns, and the reservoir engineer should research this process before recommending its use.
The use of horizontal drilling has been in existence since the 1920s but only relatively recently (1980s) reached a point where it could be used on a widespread scale. Horizontal drilling is extremely effective for recovering oil and natural gas that occupy horizontal strata, because this method offers more contact area with the oil and gas than a normal vertical well. There are endless possibilities to the uses of this method in hydrocarbon recovery, making it possible to drill in places that are either literally impossible or much too expensive to do with traditional vertical drilling. These include hard-to-reach places like difficult mountain terrain or offshore areas.
Hubbert’s theory of peak oil is reasonable; however, his predictions have not been accurate due to increases in known reserves and in the development of technologies to extract the petroleum hydrocarbons economically. Reservoir engineering is the formulation of a plan to develop a particular reservoir to balance the ultimate recovery with production economics. The remainder of this text will provide the engineer with information to assist in the development of that plan.
1.1 Conduct a search on the web and identify the world’s resources and reserves of oil and gas. Which countries possess the largest amount of reserves?
1.2 What are the issues involved in a country’s definition of reserves? Write a short report that discusses the issues and how a country might be affected by the issues.
1.3 What are the issues behind the peak oil argument? Write a short report that contains a description of both sides of the argument.
1.4 The use of hydraulic fracturing has increased the production of oil and gas from tight sands, but it also has become a debatable topic. What are the issues that are involved in the debate? Write a short report that contains a description of both sides of the argument.
1.5 The continued development of horizontal drilling techniques has increased the production of oil and gas from certain reservoirs. Conduct a search on the web for applications of horizontal drilling. Identify three reservoirs in which this technique has increased the production of hydrocarbons and discuss the increase in both costs and production.
1. Principles of Petroleum Conservation, Engineering Committee, Interstate Oil Compact Commission, 1955, 2.
2. Society of Petroleum Engineers, “Petroleum Reserves and Resources Definitions,” http://www.spe.org/industry/reserves.php
3. K. C. Sclater and B. R. Stephenson, “Measurements of Original Pressure, Temperature and Gas-Oil Ratio in Oil Sands,” Trans. AlME (1928–29), 82, 119.
4. C. V. Millikan and Carrol V. Sidwell, “Bottom-Hole Pressures in Oil Wells,” Trans. AlME (1931), 92, 194.
5. G. H. Fancher, J. A. Lewis, and K. B. Barnes, “Some Physical Characteristics of Oil Sands,” The Pennsylvania State College Bull. (1933), 12, 65.
6. R. D. Wyckoff, H. G. Botset, M. Muskat, and D. W. Reed, “Measurement of Permeability of Porous Media,” AAPG Bull. (1934), 18, No. 2, p. 161.
7. R. D. Wyckoff and H. G. Botset, “The Flow of Gas-Liquid Mixtures through Unconsolidated Sands,” Physics (1936), 7, 325.
8. M. C. Leverett and W. B. Lewis, “Steady Flow of Oil-Gas-Water Mixtures through Unconsolidated Sands,” Trans. AlME (1941), 142, 107.
9. Ralph J. Schilthuis, “Technique of Securing and Examining Sub-surface Samples of Oil and Gas,” Drilling and Production Practice, API (1935), 120–26.
10. Howard C. Pyle and P. H. Jones, “Quantitative Determination of the Connate Water Content of Oil Sands,” Drilling and Production Practice, API (1936), 171–80.
11. Ralph J. Schilthuis, “Connate Water in Oil and Gas Sands,” Trans. AlME (1938), 127, 199–214.
12. C. V. Millikan, “Temperature Surveys in Oil Wells,” Trans. AlME (1941), 142, 15.
13. Ralph J. Schilthuis, “Active Oil and Reservoir Energy,” Trans. AlME (1936), 118, 33.
14. Stewart Coleman, H. D. Wilde Jr., and Thomas W. Moore, “Quantitative Effects of Gas-Oil Ratios on Decline of Average Rock Pressure,” Trans. AlME (1930), 86, 174.
15. A. S. Odeh and D. Havlena, “The Material Balance as an Equation of a Straight Line,” Jour. of Petroleum Technology (July 1963), 896–900.
16. W. Hurst, “Water Influx into a Reservoir and Its Application to the Equation of Volumetric Balance,” Trans. AlME (1943), 151, 57.
17. A. F. van Everdingen and W. Hurst, “Application of the LaPlace Transformation to Flow Problems in Reservoirs,” Trans. AlME (1949), 186, 305.
18. M. J. Fetkovich, “A Simplified Approach to Water Influx Calculations—Finite Aquifer Systems,” Jour. of Petroleum Technology (July 1971), 814–28.
19. J. Tarner, “How Different Size Gas Caps and Pressure Maintenance Programs Affect Amount of Recoverable Oil,” Oil Weekly (June 12, 1944), 144, No. 2, 32–44.
20. S. E. Buckley and M. C. Leverett, “Mechanism of Fluid Displacement in Sands,” Trans. AlME (1942), 146, 107–17.
21. M. Muskat, “The Petroleum Histories of Oil Producing Gas-Drive Reservoirs,” Jour. of Applied Physics (1945), 16, 147.
22. A. Odeh, “Reservoir Simulation—What Is It?,” Jour. of Petroleum Technology (Nov. 1969), 1383–88.
23. K. H. Coats, “Use and Misuse of Reservoir Simulation Models,” Jour. of Petroleum Technology (Nov. 1969), 1391–98.
24. K. H. Coats, “Reservoir Simulation: State of the Art,” Jour. of Petroleum Technology (Aug. 1982), 1633–42.
25. T. V. Moore, “Reservoir Engineering Begins Second 25 Years,” Oil and Gas Jour. (1955), 54, No. 29, 148.
26. Norman J. Clark and Arthur J. Wessely, “Coordination of Geology and Reservoir Engineering—A Growing Need for Management Decisions,” presented before API, Division of Production, Mar. 1957.
27. R. E. Terry, “Enhanced Oil Recovery,” Encyclopedia of Physical Science and Technology, Vol. 5, 3rd ed., Academic Press, 2002.
28. M. K. Hubbert, “Nuclear Energy and the Fossil Fuels,” Proc. American Petroleum Institute Drilling and Production Practice, Spring Meeting, San Antonio (1956), 7–25; see also Shell Development Company Publication 95, June 1956.
29. International Energy Agency, “World Energy Outlook 2012 Executive Summary,” http://www.iea.org/publications/freepublications/publication/English.pdf