INTRODUCTION
We wrap up this review of neuroscience by looking closer at the pathophysiology of four common psychiatric disorders. The first will be the depressive disorders. Although we often use the term depression, the reader should keep in mind that there are probably a multitude of discrete diseases that all end up with the syndrome we now call depression. For example, psychotic depression, atypical depression, bipolar depression, and pathologic grief may be variants of the same phenomena or they could be different conditions with different mechanisms of action. We have no objective measures to distinguish between the depressive disorders at this time. In the 1920s, we would have talked about pneumonia as one disease, as they all produced coughs and fever, although we now know that there are many different causes of pneumonia (e.g., tuberculosis, pneumococcus, and H. flu).
Depression is a common condition recognized by Hippocrates (melancholia). Yet, in spite of all our technologic advances since the time of the ancient Greeks, we know surprisingly little about the pathophysiology of the disorder. We know even less about bipolar disorder.
Monoamine Hypothesis
The accidental discovery in the 1950s that the tricyclic and monoamine oxidase inhibitor medications could relieve depression symptoms transformed the treatment of the disorder. Numerous spin-off medications have been developed since the 1950s. Most are safer and better tolerated than the earlier medications, but none are more effective. In addition, they all work through the same mechanism: the monoamines. This has driven the common conceptualization of depression as a disorder of serotonin or norepinephrine (NE) or both.
Again, we see that treatment response generates pathophysiology theories. Clinicians call this the monoamine hypothesis, and the lay public calls it a chemical imbalance. Unfortunately, neither is an accurate description of the biologic mechanisms of depression. At least two factors argue against the monoamine hypothesis as being the only cause of depression:
1. Medications take 6 to 10 weeks to reach full effectiveness, although the neurotransmitter activity at the synapse is altered within a few doses.
2. Studies of neurotransmitter levels in the plasma, cerebrospinal fluid, and brain tissue have failed to find deficiencies in patients who are depressed compared with healthy controls.
Clearly, the depressions are more complex than the simple replacement of an insufficient neurotransmitter.
The Depressed Brain
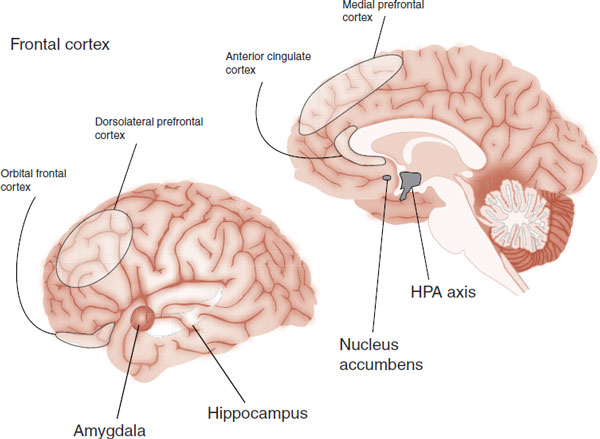
If you were going to do biopsy on a patient with depression, where would you stick the needle—what would you look for? Structural imaging, functional imaging, and postmortem studies have established five regions that are consistently dysfunctional in most patients with depression. The five regions are shown in Figure 21.1. Note the extensive prefrontal involvement.
It is tempting to match depressive symptoms from the Diagnostic and Statistical Manual of Mental Disorders criteria with specific regions in the brain. For example, anhedonia can be attributed to dysfunction of the nucleus accumbens or cognitive deficits to the anterior cingulate cortex. However, while a few symptoms seem to match up with a brain region, most do not. Most symptoms are likely the product of simultaneous dysfunction in several regions.
FIGURE 21.1  The five major regions of dysfunction in depressed brains. HPA, hypothalamic-pituitary-adrenal.
Alternatively, it is possible to envision depression as the result of overactivity in some regions and underactivity in others. For example, the hippocampus and nucleus accumbens are considered underactive in depressed patients, whereas the hypothalamic-pituitary-adrenal (HPA) axis and amygdala are overactive. This is appealing because some of the symptoms of depression appear to be caused by loss of function (low motivation, lack of hope, and low appetite), whereas others appear to be caused by hyperactivity (insomnia, anxiety, and suicidal thoughts).
Still, there is no consensus regarding the CNS alterations in the depressed brain. Part of the problem is the manner in which functional imaging studies analyze the brain. Studies that measure regional blood flow such as positron emission tomography (PET) and single photon emission computed tomography (SPECT; see Table 1.2) image the resting or idling brain. Blood oxygen level–dependent functional magnetic resonance imaging (fMRI) compares the brain’s activity in response to different stimuli. If the brain is compared with a car, resting PET studies assess the idling car, while fMRI measures the car’s performance on the open road—during a task.
A meta-analysis in 2012 of functional neuroimaging studies conducted in patients with major depression may give us the most up-to-date understanding of the dysfunction in the depressed brain. The researchers looked for changes in activity at rest (compared with healthy controls) and the response of the brain to negative stimuli (e.g., viewing pictures of sad faces). They found three differences in the depressed patients relative to the controls:
1. Activation of the pulvinar nucleus of the thalamus.
2. Greater response in the amygdala, insula, and anterior cingulate to negative stimuli.
3. Lower response in the dorsal striatum and dorsal lateral prefrontal cortex (PFC) to negative stimuli.
With these findings, the researchers formulated the following model of depression—heightened activity in the thalamus enhances the response to negative stimuli, which in turn activates the amygdala, insula, and anterior cingulate. Furthermore, there is a failure of the dopamine pathways in the dorsal striatum and dorsal lateral PFC (think pleasure and reason, respectively) to mitigate the impact of the negative stimuli. In essence, patients with depression are excessively responsive to negative information and fail to experience/consider alternative positive explanations.
FIGURE 21.2  Sagittal views of PET scans on an average group of patients after a successful course of ECT. (Adapted from Nobler MS, Oquendo MA, Kegeles LS, et al. Decreased regional brain metabolism after ECT. Am J Psychiatry. 2001;158(2):305-308.)
Frontal Cortex
It all sounds good, but the studies of the prefrontal response to treatment suggest a more confusing model for depression. Looking at just the resting brain—using PET or SPECT scans—we find remarkably differing responses in the PFC to successful treatment. For example, Figure 21.2 shows the effect electroconvulsive therapy (ECT) has on the brain. Note how a successful course of ECT turns down the frontal cortex. A study using cognitive-behavioral therapy showed a similar response. However, paradoxically antidepressants, vagus nerve stimulation (VNS), and transcranial magnetic stimulation (TMS) have been shown to increase the activity of the PFC.
How can these successful treatments have such disparate effects on the frontal cortex? We think one explanation is that depression results from dysfunction of the frontal cortex and subcortical regions. Successful treatment restores harmony between the regions. A frontal cortex that is organized and more appropriately responsive (whether more active or less active compared with pretreatment) may be less depressed. It may not be the idling rate of activity in the region that is pathological in depression, but rather the relationship between the PFC and the associated other regions in the depression or mood regulating network.
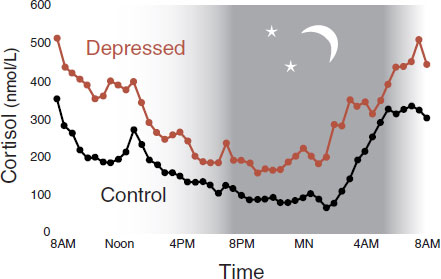
FIGURE 21.3  Diurnal mean plasma cortisol in depressed patients and healthy controls. (Adapted from Deuschle M, Schweiger U, Weber B, et al. Diurnal activity and pulsatility of the hypothalamic-pituitary-adrenal system in male depressed patients and healthy controls. J Clin Endocrinol Metab. 1997;82(1):234-238.)
THE HYPOTHALAMIC-PITUITARY-ADRENAL AXIS
Since the 1950s, it has been recognized that depressed patients have excessive activity of the HPA axis. Figure 21.3 shows the increased plasma cortisol levels over 24-hours in patients with depression compared with controls. The hypercortisolemia is stimulated by increased expression of corticotropin-releasing hormone (CRH) and reduced feedback inhibition of the HPA axis (see Figure 7.9). As discussed in Chapter 7, one theory of depression postulates that chronic, unremitting stress leads to the inability of the brain to turn down the HPA axis.
Postmortem studies of depressed patients have shown increased neurons in the paraventricular nucleus of the hypothalamus. The increased neurons are believed to be driving the increased activity in the HPA axis. It is unclear why these patients have more neurons in the hypothalamus. It could be genetic or a reaction to chronic stress.
Some patients with excess cortisol—either taken orally or generated internally—have reduced hippocampal volume. A meta-analysis of MRI studies has confirmed that hippocampal volume is reduced in patients with depression. It is believed that the excess cortisol produced by depressed patients is toxic to the hippocampus and causes the volume loss.
Effective treatments for depression (antidepressants, ECT, and lithium) are known to restore normal HPA function in most patients. It is postulated that this effect is due to increased glucocorticoid receptor production stimulated by the treatments, which has the effect of making the hypothalamus more receptive to negative feedback from cortisol. Finally, effective treatment of depression is believed to preserve and possibly restore hippocampal function (more on this later). A healthy hippocampus provides more inhibitory feedback on the HPA axis, as shown in Figure 7.9.
The overactivation of the HPA axis is so consistent in depression that there were early efforts to use it as a laboratory test to diagnose depression. Unfortunately, the sensitivity and specificity of increased adrenocorticotropic hormone (ACTH) for depression are not to the level where it is clinically useful. Other medical conditions also result in elevations of ACTH and there is even a subset of depressed patients who have low ACTH!
The dexamethasone suppression test was piloted in the early 1980s in an alternative attempt to develop a laboratory test for depression. Patients are given dexamethasone at 11 PM and cortisol levels are drawn the next morning. Dexamethasone binds to the glucocorticoid receptors, which in turn inhibits the secretion of ACTH and subsequently cortisol. Healthy subjects will suppress the release of cortisol. Depressed patients will fail to suppress the cortisol and show a bump in their cortisol level the next morning. Unfortunately, the test has not been sensitive or specific enough—only 25% to 40%. It fails to detect many patients who are truly depressed, and some general medical conditions (such as Cushing’s disease or even general stress of a chronic medical illness) also cause the HPA axis to fail to suppress cortisol.
Subsequently, with the availability of CRH, a new test has been developed using both dexamethasone and CRH (dex/CRH). Although the dex/CRH test is more accurate (the sensitivity increases to 80%), the clinical utility of this cumbersome test as a diagnostic tool remains doubtful.
Consequently, depression appears to result in the breakdown of the normal relationship between the hippocampus and the HPA axis. Increased cortisol from the adrenal gland causes hippocampal damage, which results in decreased inhibitory feedback on the HPA axis—which in turn causes increased cortisol release, and so forth.
Restoring normal functioning of the HPA axis as a treatment focus has generated considerable interest. Several groups have tested CRH receptor blockers as novel treatments for depression. Although the early small studies were favorable, the results were not consistent and were associated with a risk of hepatotoxicity. Research in this area has stalled.
NEUROGENESIS AND BRAIN-DERIVED NEUROTROPHIC FACTOR
As discussed in Chapter 8, the brain is more dynamic than previously thought. The brain contains undeveloped stem cells that can migrate and mature into neurons or glial cells (see Neurogenesis section in Chapter 8). There is compelling evidence that this process is disrupted in depression and corrected with successful treatment.
Volume Loss
Structural imaging studies and postmortem analysis of depressed patients have documented subtle volumetric loss. The findings of a smaller hippocampus (mentioned above) are the best known, but other findings include smaller PFC, cingulate gyrus, and cerebellum. Additionally, microscopic examinations have shown decreased cortical thickness as well as diminished neural size. One possible explanation is that HPA axis activation is neurotoxic to the brain. Another possibility involves a disruption of normal nerve growth.
The prospect that depression is related to problems with nerve growth factors opens a new way to conceptualize the pathophysiology of the disorder. A failure of neurogenesis and growth factor proteins, such as brain-derived neurotrophic factor (BDNF), may cause subtle shrinkage of the brain in depression.
BDNF is one of a family of neurotrophins that regulate the differentiation and survival of neurons (see Figure 8.9). Most likely, there are a multitude of growth factor proteins maintaining and stimulating nerve growth, but BDNF is the most widely studied at this point. Figure 21.4 shows a dramatic example of the effects of BDNF on serotonergic neurons in the rat cortex. Saline or BDNF was infused directly into the rat frontal cortex for 21 days. Then the animals were sacrificed and the cortex at the site of the infusion was stained for 5-hydroxytryptamine (5-HT) neurons. Note the remarkable arborization of the 5-HT axons in the cortex of the rat exposed to BDNF.
Growth factor proteins such as BDNF provide ongoing maintenance of neurons in the brain. Disruption of these nerve growth factors results in the reduction in the size of neurons, as well as some cell loss. Such reductions and loss may produce psychiatric symptoms.
FIGURE 21.4  Brain-derived neurotrophic factor (BDNF) infused directly into the rat frontal cortex results in a supranormal branching of 5-hydroxytryptamine axons. (Adapted from Mamounas LA, Blue ME, Siuciak JA, et al. Brain-derived neurotrophic factor promotes the survival and sprouting of serotonergic axons in rat brain. J Neurosci. 1995;15(12):7929-7939.)
It is difficult to assess the quantity and quality of BDNF in living humans, so the evidence connecting BDNF and depression is indirect. A postmortem analysis of suicide subjects found a marked decrease in BDNF in their PFC and hippocampus compared with controls (see Figure 21.5).
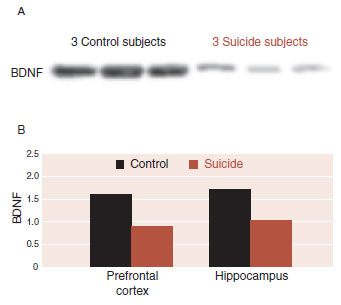
FIGURE 21.5  A. Western blots showing the immunolabeling of brain-derived neurotrophic factor (BDNF) in the prefrontal cortex in three control subjects and three suicide subjects. B. Averaged BDNF in the prefrontal cortex and hippocampus for both groups. (Adapted from Dwivedi Y, Rizavi HS, Conley RR, et al. Altered gene expression of brain-derived neurotrophic factor and receptor tyrosine kinase B in postmortem brain of suicide subjects. Arch Gen Psychiatry. 2003;60(8):804-815.)
Psychiatric Treatment and Brain-Derived Neurotrophic Factor
Of great interest to psychiatrists are the increases in BDNF and neurogenesis seen with treatments that relieve depression. In rats, the following interventions have been shown to increase BDNF:
1. Antidepressants
2. Lithium
3. Stimulation treatments: ECT, TMS, and VNS
4. Estrogen
5. Exercise
This is a remarkable discovery. It is the first time that one mechanism of action has been found that could explain how all these disparate modes of treatments relieve depression. Presumably, psychotherapy would also increase BDNF, but no one has yet developed a credible animal model that could be tested.
With humans, there are less data on studies following depression treatment and BDNF levels. A recent study from the University of California, San Francisco examined serum BDNF levels in depressed patients before and after the initiation of antidepressant treatment. The results were compared with healthy control subjects. Although serum BDNF levels are not as accurate as direct central measurements, the results are still impressive (see Figure 21.6). The BDNF levels in the depressed patients before treatment were significantly less than the levels in the healthy subjects. After 8 weeks of antidepressant treatment, the serum BDNF levels increased significantly and no longer differed from those of the controls.
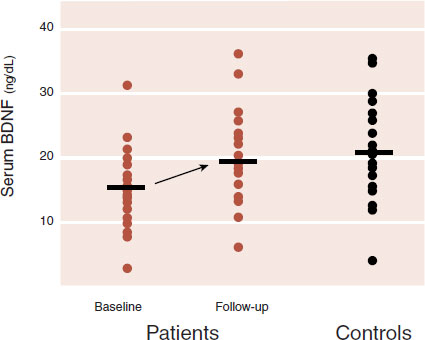
FIGURE 21.6  Serum brain-derived neurotrophic factor (BDNF) levels in depressed patients before and 8 weeks after escitalopram or sertraline treatment compared with healthy controls. (Adapted from Wolkowitz OM, Wolf J, Shelly W, et al. Serum BDNF levels before treatment predict SSRI response in depression. Prog Neuropsychopharmacol Biol Psychiatry. 2011;35:1623-1630.)
Numerous studies have shown that increased BDNF leads to increased neurogenesis. Therefore, interventions that increase BDNF should also increase the development of new nerve cells. A unique study with rats has demonstrated that fluoxetine stimulates neurogenesis in about the same amount of time it takes humans to respond to the treatment. The rats given fluoxetine did not generate new neurons at a rate any different from placebo after 5 days, but did separate from placebo by 28 days (see Figure 21.7). Of particular interest, it also took 28 days for the rats to change their behavior—demonstrate a greater willingness to move into open, lighted areas to eat.
Scarring the DNA
Nestler et al. at the University of Texas Southwestern Medical Center (he has moved back to New York and is at Mt. Sinai) have taken these ideas one step further. They have looked at the effect of animal models of depression on the DNA that codes for BDNF. First, they stressed mice by placing them in the presence of a different aggressor mouse for 10 consecutive days. The exposed mice—called defeated mice—were later socially avoidant with unfamiliar mice. Such a reaction is similar to that of humans with depression and posttraumatic stress disorder. The messenger RNA (mRNA) that encodes for BDNF was analyzed in the defeated mice and comparable controls. As expected, it was greatly reduced in the defeated mice.
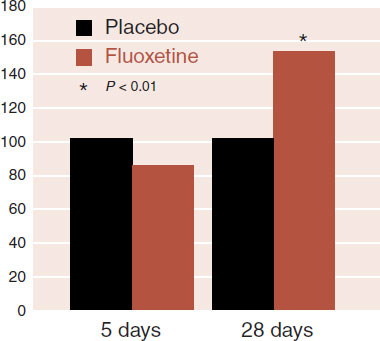
FIGURE 21.7  New neurons (neurogenesis) at 5 days and 28 days on rats given placebo and fluoxetine. (Adapted from Santarelli L, Saxe M, Gross C, et al. Requirement of hippocampal neurogenesis for the behavioral effects of antidepressants. Science. 2003;301(5634):805-809.)
The defeated mice were given imipramine, fluoxetine, or placebo for 30 days. The antidepressants not only reversed the avoidant behavior, but also returned the BDNF mRNA to almost normal levels. On the basis of these results, the researchers speculated that depression (or in this case, social defeat) must affect the DNA. What they have found may change the way we view depression.
We discussed in Chapter 6 how DNA must unravel in order for the mRNA to be transcribed (see Figure 6.7). Likewise, we discussed in Chapter 17 the profound effect that a mother rat’s behavior has on gene expression (see Figure 17.7). The results from Nestler’s laboratory suggest that depression too may be a disorder of gene expression—or what they call gene silencing.
The DNA in the region that codes for BDNF was examined in the defeated mice as well as healthy controls. Figure 21.8 shows the results. In the healthy controls, there were a few methyl groups attached to the histones that package the DNA. In the defeated mice, the methyl groups were greatly increased, which had the effect of limiting access to the DNA. The antidepressant-treated group had the addition of many acetyl groups to the histones, although there was no change in the number of methyl groups. The acetyl groups have the effect of opening up the DNA and allowing BDNF mRNA to be transcribed.
Human studies examining methylation of the DNA in depressed patients have not been conducted. Although we would never biopsy the brain of a living depressed person, it would be interesting to compare methylation of the DNA in postmortem studies of depressed patients and nondepressed controls.
In summary, these studies suggest a mechanism for depression. Stress in conjunction with a genetic vulnerability decreases growth factor proteins (such as BDNF) due to “clogging” of the DNA (see Figure 21.9). This leads to thinning of the neuronal structures, which results in depressive symptoms. These structural changes make the prefrontal limbic governing system vulnerable to disruption and dysregulation. Stress, loss, or other processes cause the system to lose self-regulation. Furthermore, it appears that effective treatments such as antidepressants, lithium, ECT, and exercise (and presumably psychotherapy and good social support) will reverse the process. Presumably, the treatment increases the production of growth factor proteins, such as BDNF, that result in renewed neuronal growth, more resilient self-regulating circuits, and a return to healthy mood.
Clearly, this is a simplistic description of what is a very complex and heterogenous process. Much more remains to be discovered.
FIGURE 21.8  A. DNA must unravel to transcribe messenger RNA (mRNA) needed for protein translation such as brain-derived neurotrophic factor (BDNF). B. Chronic defeat (and possibly depression) caused excessive methylation of the histones, which blocks access to the DNA. C. Antidepressant treatment renews access to the DNA by adding acetyl groups to the histones. (Adapted from Tsankova NM, Berton O, Renthal W, et al. Sustained hippocampal chromatin regulation in a mouse model of depression and antidepressant action. Nat Neurosci. 2006;9(4):519-525.)
GLIAL CELLS
An unexpected finding in postmortem studies of depressed patients has been the reduced number and density of glial cells in the PFC. Subsequent studies have shown that electroconvulsive seizures in rats will increase proliferation of new glial cells but not new neurons in the PFC. Glial cells may play a larger role in depression and its treatment than traditionally believed.
Ketamine
One of the most interesting recent developments in psychiatry has been the use of an old anesthetic drug ketamine—an N-methyl-D-aspartate (NMDA) blocker (see Figure 5.2)—as a rapid treatment for depression. Not only is this a unique approach to the treatment of depression—attacking the glutamate neurons—but also a single IV administration can have a robust response in less than 2-hours in upward of 75% of the subjects—lasting several days to weeks in some patients. There are only a few interventions with such a hearty response—sleep deprivation, intrathecal thyrotropin-releasing hormone, or winning the lottery.
FIGURE 21.9  Stress and genetics cause decreased growth factor protein production, which reduces neural substrate. Effective treatment reverses this process. BDNF, brain-derived neurotrophic factor; ECT, electroconvulsive therapy; TMS, transcranial magnetic stimulation. (Adapted from Berton O, Nestler EJ. New approaches to antidepressant drug discovery: beyond monoamines. Nat Rev Neurosci. 2006;7(2):137-151.)
Searching for the mechanism of this effect has been a hot topic. Recently, an old friend has emerged: BDNF. Using a mouse model of depression, a group at The University of Texas Southwestern Medical Center found that IV ketamine (as well as another NMDA blocker) induced a behavioral change in the mice within 30 minutes and increased the production of BDNF in their hippocampi. Furthermore, BDNF-knockout mice failed to respond to ketamine. Finally, mice pretreated with protein synthesis inhibitors failed to display antidepressant-like behavioral responses to ketamine—indicating that protein synthesis is required for the antidepressant effect.
The reason this response is so rapid appears to be due to a unique mechanism of action, that is, protein synthesis without gene expression. The ketamine does not turn on the DNA, but rather turns off the suppression of BDNF synthesis from existing mRNA. In other words, ketamine takes the brakes off the mRNA that translates BDNF. All roads lead to Rome—at least for now.
Whether ketamine, or derivatives of it, will turn out to be a treatment for depression is unclear. It is hard to double-blind the studies as the dose needed produces a mild euphoria and dissociated state, and the effects do not appear to last longer than several days. Finally, ketamine can be and is abused (vitamin K), making it potentially problematic for a widespread treatment. Further research is ongoing and needed in this area.
Some people encounter a stressful life event and bounce back with astounding resilience. Others, faced with the same life experience, lapse into depression. The general consensus is that depression (and most mental illness for that matter) results from the interaction of dubious genes and difficult environmental events. In 2003 Avshalom Caspi published a remarkable paper in Science that purported to identify a gene that could explain why people respond differently to life’s challenges.
There are two versions for the gene that produces the serotonin transporter (the reuptake pump in the synapse): a short one that is less effective and a long one. Caspi and his colleagues collected information from 26-year-old subjects—stressful life events in the past 5 years and presence of major depression in the past year—and correlated these data with the genes for the serotonin transporter. The results are graphed in Figure 21.10A. Individuals with copies of the short allele and stressful events were predisposed to develop major depression.
This was one of the most famous studies in psychiatry in the previous decade. A copy seemed to appear in every PowerPoint presentation on depression. Unfortunately, a meta-analysis 6 years later (Figure 21.10B) demonstrated that combining the results from 14 studies “yielded no evidence that the serotonin transporter genotype alone or in interaction with stressful life events is associated with elevated risk of depression.” These disappointing results are probably a product of focusing on one gene (when depression is more likely the result of numerous genes) and another example that the serotonin hypothesis of depression is too narrow. Most of us believe depression results from the interaction of genes and environment, but our research remains hampered by our inability to identify the culprit genes.
BIPOLAR DISORDER
Bipolar disorder is a prevalent illness with strong genetic links and unique clinical features. Unfortunately, there is little to report about the neuroscience of bipolar disorder. This may be due to the difficultly in distinguishing the subtle differences in bipolar patients’ brains from those with unipolar depression as well as healthy controls. The essential feature of bipolar disorder—episodes of mania—is clinically very distinctive, but no obvious structural, functional, or molecular markers have yet been identified in the brain.
Global Activation
One would think that manic episodes would be easy to differentiate in functional imaging studies—if the subjects could remain still enough in the scanner. In a manic episode, the patient’s brain appears to be revved up—going way too fast. One would imagine that the manic brain would “light up” in a functional imaging study, but that has not been the case.
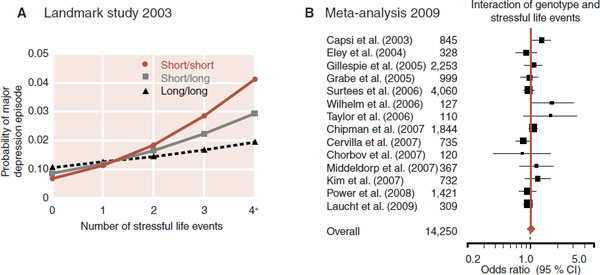
FIGURE 21.10  A. Individuals with the long allele for the serotonin transporter are less likely to develop depression when dealing with life’s stresses. B. A meta-analysis (brown triangle and line) failed to replicate the results. (A adapted from Caspi A, Sugden K, Moffitt TE, et al. Influence of life stress on depression: moderation by a polymorphism in the 5-HTT gene. Science. 2003;301:386-389. B adapted from Risch N, Herrell R, Lehner T, et al. Interaction between the serotonin transporter gene (5-HTTLPR), stressful life events, and risk of depression. JAMA. 2009;301(23):2462-2471.)
The Medical University of South Carolina Functional Neuroimaging Team conducted a prospective fMRI study of six rapid cycling bipolar patients in an effort to identify changes in the brain with different moods. The patients were matched with appropriate controls and asked to call the imaging center whenever in an altered mood. Numerous scans were performed at many unusual hours of the day on each patient and control. The absolute blood flow measures did change over time and were softly, but not significantly, associated with depression and mood. The results from one subject are shown in Figure 21.11. Note how the total brain activity (shown in black) roughly follows the mood changes (shown in brown). Unfortunately, larger studies attempting to show this same phenomenon have been disappointing.
Lithium and Gray Matter
Some imaging studies have found decreased size and activity in the PFC of patients with bipolar disorder—similar to that found in patients with unipolar depression. We mentioned earlier that lithium has been shown to stimulate BDNF synthesis. A group at Wayne State University conducted a clever study matching these two concepts. They examined the gray matter volume changes in bipolar patients after initiating lithium treatment. MRI scans were conducted at baseline and after 4 weeks of lithium. A computer outlined and measured the gray matter volume in each scan (see Figure 21.12). Eight of the ten patients showed significant increases in total gray matter volume—averaging 3%.
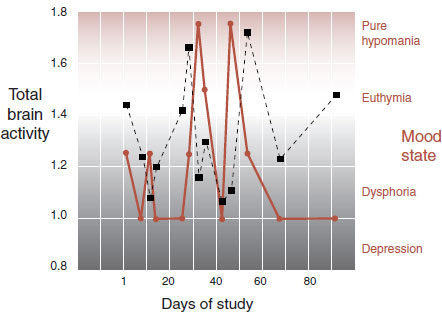
FIGURE 21.11  Serial functional magnetic resonance imaging of a rapidly cycling bipolar patient. Total brain activity in black squares. Mood states in brown circles. (Adapted from Kosi S, George MS. Functional magnetic resonance imaging investigations in mood disorders. In: Soares JC, ed. Brain Imaging in Affective Disorders. New York, NY: Marcel Dekker; 2003.)
Subsequent studies by other groups have replicated these data. Of interest, valproic acid has not been shown to have the same effect.

FIGURE 21.12  Gray matter in magnetic resonance imaging (MRI) (A) is outlined and quantified in the computer (B). The change in gray matter volume for each subject is shown after 4 weeks of lithium (C) (Adapted from Moore GJ, Bebchuk JM, Wilds IB, et al. Lithium-induced increase in human brain grey matter. Lancet. 2000;356(9237):1241-1242.)
Bipolar Summary
Although these studies are interesting, they fail to provide the neuroscientific basis for bipolar disorder that we would like to see. Haldane and Frangou reviewed the literature on imaging studies in patients with bipolar disorder. They suggest that bipolar patients share some features with unipolar depression (reduced activity in the PFC). Yet, other areas such as the amygdala are larger and more active in the bipolar patients. The authors suggest that bipolar disorder may be the result of abnormal interactions between the PFC and subcortical regions such as the amygdala—an abnormality they claim is not seen with unipolar depression. Clearly, more research is needed on this interesting topic.
BDNF UTOPIA?
One can get the impression that nerve growth factors such as BDNF are the solution to all problems. Although future psychiatric treatments may provide better ways to restore nerve growth factor deficiencies in mentally ill patients, it will not be as simple as just finding ways to get more BDNF into the brain. Too much BDNF in some regions of the brain may be detrimental. For example, Nestler et al. using the same “defeated mouse” protocol found that the defeated mice had increased BDNF in the nucleus accumbens. The researchers speculate that the development of the social phobia seen with the defeated mice may be related to too much BDNF in the brain’s reward system. Additionally, “too much growth, in an uncontrolled manner” is another way to describe cancer.
QUESTIONS
1. All the following are true about the monoamine hypothesis, except
a. It is often called a chemical imbalance.
b. Explains the delay in response seen with depression treatments.
c. Proposes deficiencies in 5-HT and NE in depressed patients.
d. Suffers from a lack of supporting findings.
2. Postmortem studies in depressed patients have found all of the following, except
a. Reduced neurons in the hypothalamus.
b. Thinning of the gray matter in certain regions.
c. Diminished neuronal size.
d. Reduced glial cells.
3. Antidepressants may decrease depressive symptoms and improve neural survival through which of the following effects?
a. Increased glucocorticoids and increased BDNF.
b. Increased glucocorticoids and decreased BDNF.
c. Decreased glucocorticoids and increased BDNF.
d. Decreased glucocorticoids and decreased BDNF.
4. Goals for effective treatment of depression include all of the following, except
a. Decrease HPA activity.
b. Protect the hippocampus.
c. Restore normal sleep architecture.
d. Awaken the PFC.
5. Which intervention has not been shown to increase BDNF in animal models?
a. Cognitive-behavioral therapy.
b. Exercise.
c. TMS.
d. Estrogen.
6. Possible culprits in the etiology of depression include all of the following, except
a. Cytotoxic effects of cortisol.
b. Insufficient limbic activity.
c. Genetic predisposition for sufficient nerve growth factors.
d. Disorganized prefrontal activity.
7. One plausible explanation for an antidepressant’s effectiveness is
a. Removing methyl groups from scarred DNA.
b. Restoring 5-HT and NE to their normal levels.
c. Restoring access to the DNA.
d. Neuroprotective effects on mRNA.
8. The pathologic mechanism of bipolar disorder is best described as
a. Excessive prefrontal activity in manic episodes and decreased activity during depression.
b. Too much BDNF in subcortical structures.
c. Cortisol activation of excessive electrical activity.
d. None of the above.
See Answers section at the end of the book.