Grids can be seen as a development of the idea of guidelines. A grid is just a regular pattern of guidelines that covers the entire canvas. Grids are often used for snapping, for equispaced distribution of objects, for modeling of the pixel grid (see Figure 3-3), for axonometric drawing (Chapter 23), and for many other purposes.
Inkscape supports two types of grids: rectangular and axonometric. One document can display more than one grid, different in type and/or spacing. To create a new grid in your document, go to the Grids tab of the Document Properties dialog and under Creation, select the desired grid type and click New. A new grid will light up in the document:
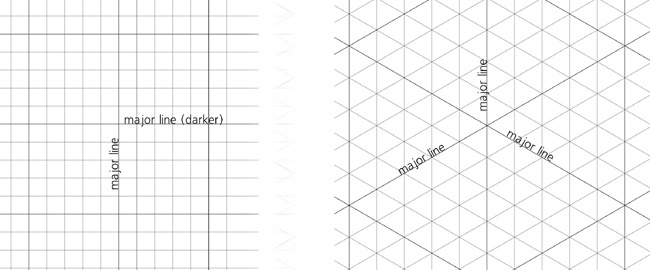
As you can see in Figure 7-6, the rectangular grid consists of two perpendicular sets of guides, whereas the axonometric grid has three sets, one vertical and two others at an angle (by default both at 30 degrees). The rectangular grid is the most common type, whereas the axonometric grid is used mostly for drawing axonometric scenes (i.e., pseudo-3D drawings without vanishing points).
If you zoom in and out in a document with a grid, you will notice that Inkscape tries to maintain the visual density of the grid lines within certain limits. As you zoom out, the lines of course get closer to each other, but at some point Inkscape decides that the clutter is too much to bear and weeds the grid, switching to showing only every tenth grid line. Keep zooming out and this decimation of grid lines will happen again and again, so as to keep the grid manageable. As the default rectangular grid spacing is 1 px, at most zoom levels—if not for this adaptive hiding—the grid would cover the page so densely that you wouldn’t be able to work.
Inversely, if you zoom in, Inkscape will gradually reveal more and more grid lines so as to evenly fill your screen. New lines only stop appearing when you reach a zoom level where all of the lines are visible: You now see the entire grid without any abridgement.
At close zooms, you will notice that every fifth line (called a major line) is a little darker than the rest (minor lines). This is another thing Inkscape does to make navigating in the grid easier, similar to a ruler that has some of its marks larger than others.
To hide all grids in the document, press the  key. This does not delete anything; if you press again, all hidden grids will be displayed again. This key controls both grid visibility and snapping to grid (i.e., you won’t snap to invisible grids); if you want to disable only snapping without hiding the guides, use the
  key (global snapping toggle, 7.3 Snapping).
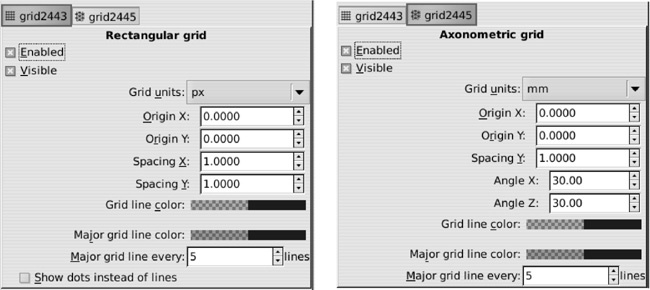
Many aspects of grids can be changed in the Document Properties dialog. Once you create a grid, you will see a grid properties panel at the bottom of the dialog:
Note that you can create more than one grid in the same document, and by default they will all be visible at once (although you can enable or disable any of them separately). In the dialog, each grid will have its own tab.
Let’s look at what you can change for a grid:
You can toggle between showing and hiding the grid as well as enable or disable snapping to it. If a grid is hidden, you cannot snap to it, so unchecking the Visible checkbox disables the rest of the properties.
Origin and Spacing values define the position and the density of the lines in the grid. (Note, however, that if you make the grid too dense, Inkscape won’t show all lines anyway until you zoom in close enough.) For a rectangular grid, there are two spacing values: X (horizontal) and Y (vertical). For an axonometric grid, there’s only one spacing value—the distance along the Y axis between the slanted lines; the intervals between the vertical guidelines are completely determined by this distance and the axonometric angles. All these values are, as usual, coupled with a unit selector (a drop-down list).
Angles are only available for axonometric grids. These two values set the angles of the two sets of diagonal lines; by default both are 30 degrees, but they can be anything from 1 to 89 degrees and don’t have to be equal to each other.
Note
If you have added an axonometric grid to your document, new diagonal guides (7.1 Guidelines) will be created with the same angles as those used by the grid.
Colors can be set separately for the major and minor grid lines. By default they are both blue, but the minor lines are less opaque and therefore less visible.
Frequency of the major lines can also be adjusted; by default, every fifth gridline is major.
For a rectangular grid, you can select the checkbox to show a grid of dots instead of the grid of lines; dots are placed where the grid of lines would have intersections. Major line intersections display little circles instead of dots.
If what you need is not a snappable grid of helper lines but a grid of real objects (i.e., a grid that other SVG software will display just as Inkscape does), you can use the clone tiler (16.6 Tiling Clones) or the Grid extension (13.3 Path Extensions).