{ THIRTEEN }
Hypercapitalism: Between Modernity and Archaism
In Chapter 12 we looked at the role of communist and postcommunist societies in the history of inequality regimes, especially in relation to the resurgence of inequality since the 1980s. Today’s world is a direct consequence of the great political-ideological transformations that inequality regimes experienced over the course of the twentieth century. The fall of communism led to a certain disillusionment concerning the very possibility of a just society. Disillusionment led to retreat and to the defense of national, ethnic, and religious identities; this must be overcome. The end of colonialism gave rise to new, ostensibly less inegalitarian economic relations and migration flows between different regions of the world, but the global system remains hierarchical and not sufficiently social or democratic, and new tensions have arisen both within and between countries. Finally, proprietarian ideology has returned in a new form, which I call neo-proprietarian despite the many differences between the old version and the new. But the neo-proprietarian regime is less unified and more fragile than it might appear.
In this chapter we will study several of the major inegalitarian and ideological challenges that all societies face today, with an emphasis on the potential for change and evolution. We will begin by looking at the various types of extreme inequality that exist in the world today, as old and new logics come together. We will then ask why our economic and financial system has become increasingly opaque, particularly with respect to recording and measuring income and wealth. In a world that regularly celebrates the era of “big data,” this may come as a surprise. It reflects a dereliction of duty on the part of government authorities and statistical agencies. Worse, it greatly complicates the task of organizing an informed global debate about inequality and other major issues, beginning with climate change, which could serve as a catalyst for a new politics. After that, we will review other fundamental global challenges related to inequality: the persistence of strong patriarchal inequalities between men and women, which only vigorous proactive measures can overcome; the paradoxical pauperization of the state in developing countries as a consequence of trade liberalization imposed without sufficient preparation or political coordination; and finally, the new role of monetary creation since 2008, which has deeply altered perceptions of the respective roles of governments and central banks, taxes and monetary creation, and, more generally, of the idea of a just economy. All of this will help us to understand today’s neo-proprietarianism and what needs to be done to overcome it.
Forms of Inequality in the Twenty-First Century
The most obvious characteristic of today’s global inequality regime is that societies around the world are more intensely interdependent than ever before. Globalization is of course a very long-term process. Relations among the different regions of the world have been gradually expanding since 1500. Violence was often involved, as in the era of slavery and colonialism. But at other times trade and cultural exchange took more peaceful forms. In terms of commerce, immigration, and finance, the world achieved a remarkable level of integration during the Belle Époque (1880–1914). But since then, globalization has attained another level altogether in the era of hypercapitalism and digital technology (1990–2020). International travel has become routine, and images, texts, and sounds can now be transmitted instantaneously to the four corners of the earth. New information technologies have given rise to previously unknown forms of cultural, sociopolitical, and political-ideological exchange and interdependence. These changes have taken place, moreover, against a background of rapid demographic growth and broad rebalancing. The United Nations predicts that the global population will reach 9 billion in 2050: 5 billion in Asia, 2 billion in Africa, 1 billion in the Americas, and less than 1 billion in Europe (Fig. 13.1).
Such interconnectedness is not incompatible with a great social and political diversity, however. According to available sources, the top decile’s share of total income is less than 35 percent in Europe but close to 70 percent in the Middle East, South Africa, and Qatar (Fig. 13.2). If we look at the share of national income going to the bottom 50 percent, the next 40 percent, and the top 10 percent (or 1 percent), we find large variations between countries. In the least inegalitarian countries, the top decile share is “only” 1.5 times as large as that of the bottom 50 percent, compared with seven times as large in the most inegalitarian countries (Fig. 13.3). The top centile share is half that of the bottom 50 percent in the most egalitarian countries (which is quite a lot, considering that the top centile is one-fiftieth the size) but more than triple the bottom 50 percent’s share in the most inegalitarian countries (Fig. 13.4). These figures show why it is a mistake to compare countries only in terms of macroeconomic averages (such as gross domestic product [GDP] per capita). Equivalent averages can conceal totally different realities in terms of income distribution among different social groups.

FIG. 13.1. Population by continents, 1700–2050
Interpretation: In 1700, the global population was about 600 million, of whom 400 million lived in Asia and the Pacific, 120 million in Europe and Russia, 60 million in Africa, and 15 million in America. In 2050, according to UN projections, it will be about 9.3 billion, with 5.2 billion in Asia/Pacific, 2.2 in Africa, 1.2 in the Americas, and 0.7 in Europe/Russia. Sources and series: piketty.pse.ens.fr/ideology.

FIG. 13.2. Global inequality regimes, 2018
Interpretation: In 2018, the top decile share of national income was 34 percent in Europe, 41 percent in China, 46 percent in Russia, 48 percent in the United States, 55 percent in India, 56 percent in Brazil, 64 percent in the Middle East, 65 percent in South Africa, and 68 percent in Qatar. Sources and series: piketty.pse.ens.fr/ideology.

FIG. 13.3. Inequality in Europe, the United States, and the Middle East, 2018
Interpretation: The top decile’s share of total income is 64 percent in the Middle East (population 420 million) compared with 9 percent for the bottom 50 percent. In Europe (enlarged EU, pop. 540 million), these shares are 34 and 21 percent, and in the United States (pop. 320 million), 47 and 13 percent. Sources and series: piketty.pse.ens.fr/ideology.

FIG. 13.4. Global inequality regimes, 2018: The bottom 50 percent versus the top 1 percent
Interpretation: The top centile’s share of total income is 30 percent in the Middle East compared with 9 percent for the bottom 50 percent. In Europe, these two shares are 21 and 11 percent; in China, 15 and 14 percent; and in the United States, 20 and 13 percent. Sources and series: piketty.pse.ens.fr/ideology.
These regional differences are important and instructive, and they may be helpful for understanding what kinds of social and fiscal institutions are useful for keeping inequality down (as Europe has done). Bear in mind, however, that inequality levels are high and rising nearly everywhere (including in Europe).1 Hence it is not a very good idea to use such data to explain to Europe’s lower and middle classes that, because their lot is so enviable compared to the rest of the world, they must make sacrifices. Unfortunately, people at the top of the global income and wealth distribution (and the politicians they support) often invoke such arguments to justify sacrifices in their favor. Rhetoric of this kind may be politically effective, but it is also dangerous. Most Europeans are perfectly well aware that the level of inequality in Europe is lower than in South Africa, the Middle East, Brazil, and the United States. To argue that immutable laws of economics require them to accept the kinds of inequality that exist elsewhere (a totally fantastic and baseless assertion, which in no way helps to clarify the issues) is surely the best way to persuade them to turn against globalization.
A more relevant comparison for European citizens is to note that while income inequality in Europe decreased considerably over the course of the twentieth century, it has increased sharply since the 1980s.2 To be sure, the increase has been smaller than that observed elsewhere, but it still represents a clear and well-documented reversal of the previous trend, for which there is no obvious justification. Indeed, the increase of inequality has coincided with a decrease in the growth rate.3 Furthermore, inequality remains extremely high in absolute terms. In fact, the concentration of wealth in Europe has always been stunning, and it has been increasing since the 1980s: the bottom 50 percent owns barely 5 percent of the wealth, while the top 10 percent owns 50–60 percent.4
Turning now to the regions of the world where inequality is highest, it is interesting to note that they contain several distinct types of political-ideological regime (Fig. 13.2).5 First, one finds countries with a legacy of status inequality and discrimination based on race, colonialism, or slavery. This is the case in South Africa, which ended apartheid in the early 1990s, and in Brazil, which was the last country to abolish slavery at the end of the nineteenth century.6 The racial dimension and history of slavery may also help to explain why the United States is more unequal than Europe and has had greater difficulty building social-democratic institutions.7
The Middle East: Pinnacle of Global Inequality
Sharing the pinnacle of the global inequality hierarchy is the Middle East, whose inequality has more “modern” roots in the sense that it is linked not to past racial divisions or a history of slavery but to the concentration of petroleum resources in small countries with modest populations compared to the region as a whole.8 This oil, exported around the world, is being transformed into permanent financial wealth via financial markets and the international legal system. This sophisticated system is the key to understanding the exceptional level of inequality in the region. For instance, Egypt, a country of 100 million people, annually spends on its schools 1 percent of the combined petroleum revenues of Saudi Arabia, the United Arab Emirates, and Qatar, whose populations are tiny.9
Inequality in the Middle East is also closely connected to the borders laid down by the French and British at the end of World War I as well as to the military protection that Western powers subsequently provided to the oil monarchies. Without that protection, the political map would probably have been redrawn several times, notably after the invasion of Kuwait by Iraq in 1990.10 The 1991 military intervention, whose purpose was to restore Kuwait’s oil to its emirs and to promote Western interests, coincided with the collapse of the Soviet Union, which facilitated Western intervention (now that there was no longer a rival superpower to contend with). These events marked the beginning of the new political-ideological era of hypercapitalism. They also illustrate the fragility of the compromise that was struck at the time. A few decades later, the Middle Eastern inequality regime epitomizes the explosive mixture of archaism, hyper-financialized modernity, and collective irrationality typical of recent times. It bears traces of the logic of colonialism and militarism; it contains reserves of petroleum that would be better kept in the ground to prevent global warming; and its wealth is protected by the extremely sophisticated services of international lawyers and financers, who find ways to put it beyond the reach of covetous have-nots. Finally, note that the oil monarchies of the Persian Gulf are, together with postcommunist Russia, the countries that make most extensive use of the world’s tax havens.11
The estimates of Middle Eastern inequality shown in Fig. 13.2 should be seen as lower limits owing to the limitations of the available sources and the hypotheses needed to interpret them. The measurement of inequality in the Middle East is complicated by the extreme difficulty of obtaining data about income and wealth, particular in the oil monarchies. The evidence suggests, however, that wealth in these states is very highly concentrated, both within the native population and between natives and foreign workers (who make up 90 percent of the population of Qatar, the Emirates, and Kuwait and 40 percent of the population of Saudi Arabia, Oman, and Bahrain). For want of sufficient data, the estimates given here are based on very conservative hypotheses about within-country inequalities; it is primarily the very wide gaps between countries that give rise to the differences depicted here. By adopting alternative (and very likely more realistic) hypotheses, one would arrive at estimates of top decile shares on the order of 80–90 percent (rather than 65–70), especially for Qatar and the Emirates—a level of inequality close to that of the most inegalitarian slave societies ever observed.12
There is little doubt that the extreme inequality observed in the Middle East has heightened tensions and contributed to the region’s persistent instability. In particular, the wide gap between the reality of the situation and officially proclaimed religious values (based on principles of sharing and social harmony within the community of believers) is quite likely to provoke allegations of illegitimacy and lead to violence. In the abstract, a democratic federal regional organization such as the Arab League or some other political organization could allow wealth to be shared while coordinating vast investments in a better future for the region’s youth. For the time being, however, little has been done in this direction.13 Why not? Not only because of the limitations of the strategies of regional actors but also because the wider world lacks the requisite political and ideological vision. In particular, the Western powers as well as private interests in Europe and the United States see advantages in maintaining the status quo, especially when the oil monarchies buy their weapons and offer financial support to their sports teams and universities. Yet in this as in other cases, strict respect for existing power relations and property rights has failed to yield a viable model of development. Indeed, Western actors have every reason to look beyond their short-term financial interests in order to promote a democratic, social, federalist agenda that would allow these contradictions to be overcome. Ultimately, it was the refusal to contemplate new egalitarian postnational solutions that gave rise to reactionary and authoritarian political projects in Europe in the first half of the twentieth century; the same is true of the Middle East in the late twentieth and early twenty-first centuries.14
Measuring Inequality and the Question of Democratic Transparency
Along with global warming, the rise of inequality is one of the principal challenges confronting the world today. Whereas the twentieth century witnessed a historic decline in inequality, its revival since the 1980s has posed a profound challenge to the very idea of progress. What is more, the challenge of inequality is closely related to the climate challenge. Indeed, it is clear that global warming cannot be stopped or at least attenuated without substantial changes in the way people live. For such changes to be acceptable to the majority, the effort demanded must be apportioned as equitably as possible. The need for fair apportionment of the effort is all the more obvious because the rich are responsible for a disproportionate share of greenhouse gas emissions while the poor will suffer the worst consequences of climate change.
For these reasons, the issue of democratic transparency regarding inequalities of income and wealth is of paramount importance. Without intelligible indices based on reliable and systematic sources, it is impossible to have a reasoned public debate at the national level, much less at the regional or global level. The data presented in this book are drawn in large part from the World Inequality Database (WID.world), an independent consortium supported by a number of research centers and international organizations whose main objective is precisely to facilitate public debate about inequality on the basis of the most complete available data.15 The information in the database is the result of systematic comparison of available sources (including national accounts, household surveys, tax and estate records, and so on). With this information we have been able to provide the first comprehensive map of global inequality regimes and their evolution. Note, however, that despite the best efforts of everyone involved, the currently available sources remain fragmentary and insufficient. The main reason for this is that the data made public by governments and statistical agencies suffer from considerable limitations. Indeed, economic and financial opacity have increased in recent years, especially with respect to accounting for capital income and financial assets. This may seem paradoxical at a time when modern information technology should in theory facilitate greater transparency. The failure in some cases reflects a veritable surrender by governments, fiscal authorities, and statistical agencies; more than that, it reflects a political-ideological refusal to take the issue of inequality seriously, particularly when it comes to wealth inequality.
Let us begin with the question of the indices used to describe and analyze the distribution of income and wealth. These should be as intuitive as possible so that everybody can understand them. That is why it is preferable to use indices such as the share of total income (or wealth) accruing to the bottom 50 percent, the middle 40 percent, and the top 10 percent. Every citizen can take from these figures a fairly concrete idea of what each distribution means (Figs. 13.2–13.4).
To compare inequality between countries, an especially simple and expressive index is the ratio between the share of the top 10 percent (or top 1 percent) and that of the bottom 50 percent. This reveals quite significant differences between countries. For instance, we find that the ratio of the top decile’s share of income to that of the bottom 50 percent is roughly eight in Europe, nineteen in the United States, and thirty-five in South Africa and the Middle East (Fig. 13.5). The ratio between the top centile’s share and that of the bottom 50 percent is currently about twenty-five in Europe, eighty in the United States, and 160 in the Middle East (Fig. 13.6). The advantage of this type of index is twofold: it is very easy to understand, and it can be directly related to fiscal and social policy. In particular, citizens can form their own opinions about how different tax rates might modify the distribution of income.16 The same is true if one looks at the concentration of wealth and the potential for wealth redistribution: the share of wealth claimed by different groups shows immediately how a redistribution of property rights would affect each group’s holdings.
By contrast, indices such as the Gini coefficient, often used in official inequality statistics, are much more difficult to interpret. The Gini coefficient is a number between zero and one, with zero representing total equality and one representing total inequality. It tells us nothing about which social groups are responsible for differences in the index over time or between countries. Broadly speaking, the Gini coefficient masks flesh-and-blood social conflict between different groups in the income or wealth hierarchy and often obscures ongoing changes.17 For instance, inequality strongly increased between the middle and the top of the distribution at the global level since 1980 while it declined between the bottom and the middle, so that a synthetic indicator like the Gini coefficient could wrongly give the impression that we live in an era of complete distributional stability and balanced growth.18 Furthermore, the Gini coefficient is generally calculated on the basis of data that inherently tend to underestimate the degree of inequality—most notably, household surveys in which income and wealth are self-declared; such surveys often absurdly understate the income and wealth of people at the top of the distribution. For these reasons, indices like the Gini coefficient frequently conceal flaws (or outright aberrations) in the underlying data or at the very least cast a discreet veil over the difficulties involved.19

FIG. 13.5. Inequality between the top 10 percent and the bottom 50 percent, 2018
Interpretation: In 2018, the ratio of the average income of the top decile and that of the bottom 50 percent was 8 in Europe, 14 in China and Russia, 19 in the United States and India, 20 in Brazil, 34 in the Middle East, 35 in South Africa, and 36 in Qatar. Sources and series: piketty.pse.ens.fr/ideology.

FIG. 13.6. Inequality between the top 1 percent and the bottom 50 percent, 2018
Interpretation: In 2018, the ratio between the average income of the top centile and that of the bottom 50 percent was around 25 in Europe, 46 in China, 61 in Russia, 80 in the United States, 72 in India, 85 in Brazil, 161 in the Middle East, 103 in South Africa, and 154 in Qatar. Sources and series: piketty.pse.ens.fr/ideology.
Another frequently used approach is simply to ignore the part of the distribution that lies above a certain threshold, such as the ninetieth percentile (above which lies the top decile). One then divides the ninetieth percentile level by the median level (which corresponds to the fiftieth percentile) or the tenth percentile level (below which lies the bottom decile).20 The problem with this approach is that it amounts to neglecting a significant part of the distribution: the top decile’s share of total income is generally 30–70 percent, but its share of total wealth is generally 50–90 percent. If such a large share of income or wealth is simply swept under the rug, the transparency of democratic debate suffers, and the credibility of government statisticians and agencies is impaired.
On the Absence of Fiscal Transparency
Apart from the choice of indices, the most important question for the measurement of inequality is obviously the availability of sources. The only way to obtain a comprehensive view of inequality is to compare different sources (including national accounts, household surveys, and fiscal data), which shed complementary light on different segments of the distribution. Experience has shown that fiscal data, though highly imperfect, generally improve the quality of measurement substantially by correcting the data at the top end of the distribution (which surveys always seriously underestimate). This is true even in countries where the fiscal authorities lack the means to control fraud and where income tax data are rudimentary. For instance, as we saw in Chapter 12, although tax data from Russia and China are seriously incomplete and unsatisfactory, we were able to use this information to make substantial upward revisions to official inequality measures (based exclusively on surveys), yielding more plausible (though still probably low) estimates. In India and Brazil, thanks to the help of many researchers, citizens, and journalists, governments and agencies recently agreed to open up previously inaccessible records, and this has added to our knowledge of income inequality in those countries.21 Similarly, recent work on Lebanon, Ivory Coast, and Tunisia has shown that the use of tax data resulted in considerable improvement over previously available measures of inequality.22 In all these countries, data from current income tax reports—though flawed and disregarding the fact that much income probably goes untaxed—led to substantial upward revisions of official measures of inequality. It should therefore be clear that widely used official measures, based as they often are on self-declared household surveys, understate inequality to a significant degree, and this systematic distortion can substantially bias public debate.23
The use of tax sources, however imperfect, can also reveal poor enforcement of tax laws and inefficiency in their application. Research can thus equip society with the tools to mobilize and demand better fiscal enforcement. Take China, for example. If the authorities were to publish data on the number of taxpayers in each income bracket, in city after city and year after year, with details about the sources of income for those in the highest brackets, it would no doubt be possible to fight corruption more effectively than with the methods currently being used. Fiscal transparency links the measurement of inequality to the challenge of mobilizing people politically to transform the government.
Unfortunately, pressuring governments and tax authorities to open up their tax records is not enough to resolve all the problems. There is another issue: the evolution of the international fiscal and legal system has also reduced the quality of the available data. The free circulation of capital in conjunction with the absence of adequate international coordination on tax-related matters (and especially the lack of any requirement to share information about cross-border wealth holdings) has led some countries, especially in Europe, to adopt special preferential rules for taxing capital income (such as flat tax systems). In practice, this has resulted in a deterioration in the quality of sources that allow us to link an individual’s labor income to his or her capital income. This impoverishment of the European sources does not augur well for what is likely to happen in less wealthy countries. The difficulty of measuring income inequality is only compounded when it comes to measuring wealth inequality, about which even less is known, as we will see shortly.
Social Justice, Climate Justice
Let us take a closer look at the notion of income, whose inequality we are trying to measure, and in particular at the difficulties we encounter when we try to account fully for the degradation of the environment. To measure a country’s economic prosperity, it is broadly preferable to rely on national income rather than GDP. Recall the key differences between the two: national income is equal to GDP minus depreciation of capital (also called consumption of fixed capital) plus net income from abroad (or minus net outflow, as the case may be). For example, a country whose entire population was occupied reconstructing a capital stock destroyed by a hurricane could have a high GDP but zero national income. The same would be true if all the country’s output went abroad to remunerate the owners of its capital. The notion of GDP reflects a production-centered view and does not worry about the degradation of capital (including natural capital) or about the distribution of income and wealth. For these various reasons, national income is clearly a more useful notion. It is also more intuitive: national income per capita corresponds to the average income that citizens of the country actually earn.24
The problem is that available estimates do not allow us to correctly measure the depreciation of natural capital.25 In practice, official national accounts do register an upward trend in the depreciation of capital. Globally, consumption of fixed capital amounted to slightly more than 10 percent of global GDP in the 1970s but rose to nearly 15 percent in the late 2010s.26 In other words, national income was about 90 percent of GDP in the 1970s but only 85 percent today.27 This rising depreciation reflects the accelerated obsolescence of certain types of equipment, such as machinery and computers, which need to be replaced more often today than in the past.28
In principle, these estimates should also include the consumption of natural capital. In practice, this runs into difficulties of several kinds. Consider, first, available estimates of annual extraction of natural resources from 1970 to 2020, including hydrocarbons (oil, gas, coal), minerals (iron, copper, zinc, nickel, gold, silver, etc.), and wood. It turns out that these flows were substantial (generally 2–5 percent of global GDP, depending on the year) and that they varied considerably with time (as prices changed) and country. Calculations are based on the annual value of the material extracted net of any replenishment (very slow for hydrocarbons and minerals, somewhat less so for forests). Many uncertainties bedevil the data.29
The first problem is to evaluate these flows in terms of market values, which is probably not the best choice. The social cost of natural resource extractions should be factored in, especially the impact of CO2 and other greenhouse gas emissions on global warming. Such estimates are by their nature highly uncertain. In 2007, the Stern Review estimated that global warming could eventually reduce global GDP by 5 to 20 percent.30 The acceleration of global warming over the past decade could lead to even larger snowball effects.31 As noted in Chapter 12, it is not clear that it always makes sense to try to quantify things in monetary terms. In this case, it might be a better idea to set climate targets that are not to be exceeded and then to deduce the consequence in terms of maximum permissible emissions and the policies needed to meet that goal, including (but not limited to) setting a “price on carbon” and imposing a carbon tax on the worst polluters. In any case, it is essential to reason in the future in terms of national income rather than GDP growth and to account for the consumption of fixed capital on the basis of plausible estimates of the true social cost of natural resource extraction (possibly with a range of estimates based on different methodologies).32
The second difficulty is that national accounts as developed to date include natural resources only from the point at which they begin to be exploited economically. In other words, if a company or a country begins exploiting a deposit in 2000 or 2010, the value of the reserves in question generally appears in estimates of public or private wealth in official national accounts only as of 2000 or 2010.33 It will not appear in estimates for 1970 or 1980, even though the deposit in question was obviously already there. This has the potential to severely distort the measure of the evolution of total private wealth (as a percentage of national income or GDP) over the entire period.34 Research under way in countries rich in natural resources (such as Canada) shows that this is enough to completely transform the long-term picture; some data series need to be recalculated retrospectively.35 This illustrates once again a conclusion I have already emphasized several times—namely that the increase in the total value of private property often reflects an increase in the power of private capital as a social institution and not an increase in “the capital of mankind” in the broadest sense.
We encounter the same set of issues with respect to the private appropriation of knowledge. If a company were some day to obtain the rights to the Pythagorean theorem and begin collecting royalties from every schoolchild using it, its stock market capitalization would probably be substantial, and total global private wealth would increase accordingly, even more so if other aspects of human knowledge could be similarly appropriated. Nevertheless, mankind’s capital would not increase one iota, since the theorem has been known for millennia. This hypothetical case might seem extreme, but it is not dissimilar to that of private companies like Google, which has digitized public libraries and archives, opening up the possibility of some day billing for access to resources that were once free and public and thereby generating significant profits (potentially far beyond the investment required). Indeed, the stock market value of technology firms includes patents and knowhow that might not exist were it not for basic research financed with public money and accumulated over decades. Such private appropriation of common knowledge could increase dramatically in the coming century. What happens will depend on the evolution of legal and tax systems and on the social and political response.36
On Inequality of Carbon Emissions Between Countries and Individuals
Finally, the third and probably most important difficulty is that it is imperative to take environmental inequalities into account, both in terms of damages caused and damages suffered. In particular, carbon emissions are not solely the responsibility of the countries that produce hydrocarbons or the countries that host factories generating significant emissions. Consumers in the importing countries, particularly the wealthiest of them, bear part of the responsibility as well. By using available data on the income distribution in various countries together with surveys that allow us to associate income with consumption profiles, it is possible to estimate how responsibility for carbon emissions is distributed among the world’s people. The principal results are shown in Fig. 13.7. These estimates reflect both direct emissions (from transportation and home heating, for example) and indirect emissions; that is, emissions incurred in the use and production of goods consumed by individuals in different countries as well as in the shipment of those goods from the place of origin to the place of consumption.37 Looking at all carbon emissions in the period 2010–2018, we find that North America and China are each responsible for about 22 percent of global emissions, Europe for 16 percent, and the rest of the world for about 40 percent. But if we focus on individuals responsible for the heaviest emissions, the distribution changes completely. The 10 percent of the world’s people responsible for the highest emissions emit on average 2.3 times the global average; together they account for 45 percent of global emissions. Of these emissions, North America represents 46 percent, Europe 16 percent, and China 12 percent. If we look at emissions greater than 9.1 times the global average, which gives us the top centile of emitters (who account for 14 percent of total emissions, more than the bottom 50 percent combined), North America (essentially the United States) represents 57 percent, versus 15 percent for Europe, 6 percent for China, and 22 percent for the rest of the world (including 13 percent for the Middle East and Russia and barely 4 percent for India, Southeast Asia, and sub-Saharan Africa).38
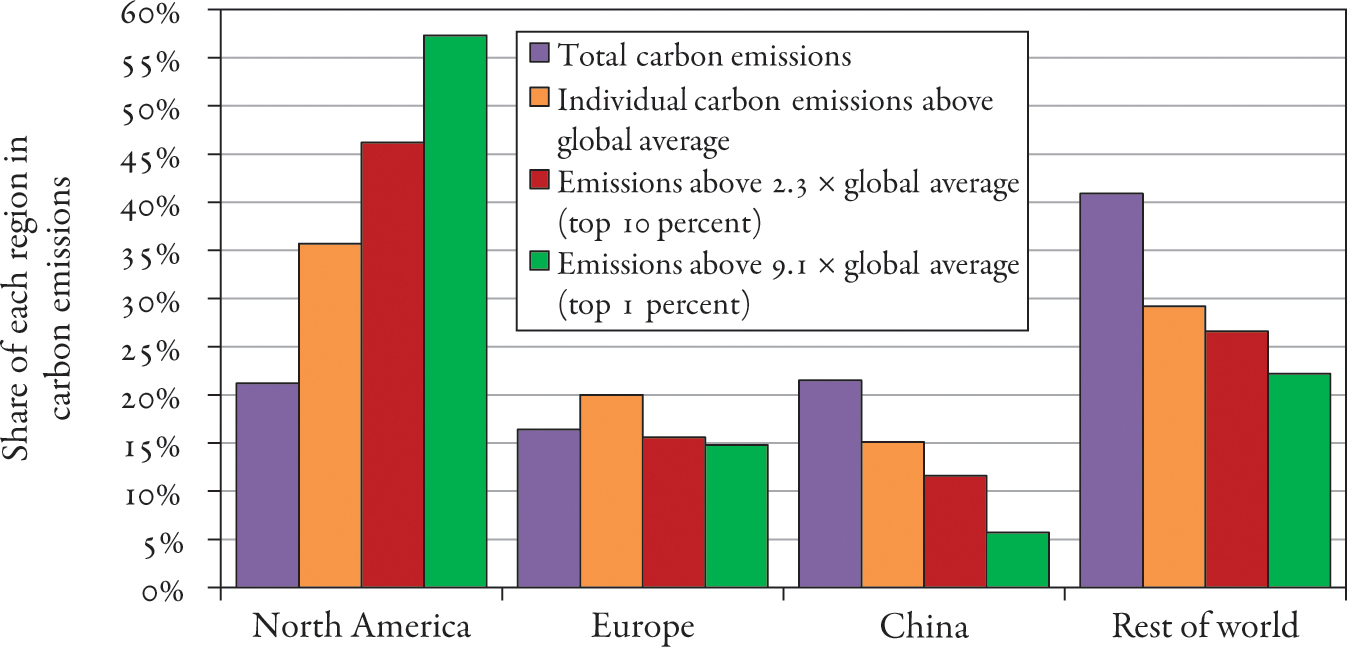
FIG. 13.7. The global distribution of carbon emissions, 2010–2018
Interpretation: The share of North America (United States and Canada) in total (direct and indirect) carbon emissions is 21 percent on average in 2010–2018 but 36 percent if one looks at individual emissions greater than the global average (6.2 tonnes CO2 per year), 46 percent for emissions above 2.3 times the global average (the top 10 percent of world emitters, responsible for 45 percent of all emissions, compared to 13 percent for the bottom 50 percent of world emitters), and 57 percent of those emitting more than 9.1 times the global average (the top 1 percent of emitters, responsible for 14 percent of all emissions). Sources and series: piketty.pse.ens.fr/ideology.
This extremely high concentration of the highest emitters in the United States is a result of both higher income inequality and a way of life that is particularly energy intensive (owing to large homes, highly polluting vehicles, and so on). Of course, these results alone will not persuade people around the world to agree on who should make the greatest effort. In the abstract, given the facts about who is to blame, it would not be illogical for the United States to compensate the rest of the world for the damage it has done to global well-being, which is potentially considerable (bearing in mind that global warming may eventually lead to a loss of 5–20 percent of global GDP, if not more). In practice, it is quite unlikely that the United States would spontaneously undertake to do this. By contrast, it is not totally fanciful to think that the rest of the world might some day demand an accounting and impose sanctions to compensate for the damage it has suffered. To be sure, the extent of the damage due to global warming is such that this could lead to violent political tensions between the United States and the rest of the world.39 In any case, the search for a compromise and for norms of justice acceptable to the majority will necessitate shared awareness of how emissions are distributed globally.
The high level of individual emissions inequality also has consequences for climate policy at the national level. It is often argued that the best way to combat global warming is to levy a carbon tax proportional to emissions together with setting building and pollution standards and investing in renewable energy. For instance, a recent report suggested that carbon dioxide emissions should be taxed at a rate of up to $100 a ton between now and 2030 to meet the criteria set by the Paris Accords of 2015.40 That is, each country should set up an additional tax of $100 per ton on all emissions.41 The problem with such a proportional tax on carbon is that it can be quite socially unjust, both within and between countries. In practice, many households with low to middling incomes are required to spend a higher proportion of their income on transportation and heating than are wealthier households, particularly in areas where there is inadequate or no mass transportation or where homes are not insulated. A better solution would be to levy a higher tax on those who produce higher levels of emissions. For instance, one might offer an exemption to households emitting less than the global average and place a tax of $100 a ton on emissions above the average, then $500 a ton on emissions above 2.3 times the average and $1,000 (or more) on emissions above 9.1 times the average.
I will come back to the question of a progressive carbon tax in Chapter 17, where I consider what a just tax system might look like. At this stage, note simply that no policy will succeed in combating global warming unless it tackles the issues of social and fiscal justice. There are several ways to work toward a progressive, durable, and collectively acceptable carbon tax. At a minimum, all proceeds of the carbon tax must be put toward financing the ecological transition, particularly by compensating the hardest-hit low-income families. One could also explicitly exempt electricity and gas consumption up to a certain threshold and impose higher taxes on those consuming more than the limit. And one could set higher taxes on goods and services associated with elevated emissions: air travel, for example.42 What is certain is that if one does not take inequality seriously, major misunderstanding is likely, and this could block any hope of achieving an effective climate policy.
In this respect, the so-called revolt of the gilets jaunes, or yellow vests, in France in late 2018 is especially emblematic. The French government had planned to increase its carbon tax sharply in 2018–2019 but chose to abandon the idea in the wake of this violent protest movement. The affair was particularly badly handled, almost to the point of caricature. Only a small part (less than a fifth) of the additional carbon tax revenues were to be applied to the ecological transition and measures of compensation, with the rest going to finance other priorities, including major tax cuts for the social groups with the highest income and greatest wealth.43
Note, too, that the various forms of carbon tax currently levied in France and Europe contain numerous exemptions. For instance, kerosene is totally exempt from the carbon tax under European competition rules. What this means is that people of modest means who drive to work every morning must pay the full carbon tax on the gasoline they use, but wealthy people who fly off for a weekend vacation pay no tax on the jet fuel they consume. In other words, the carbon tax is not even proportional: it is hugely and blatantly regressive, with lower rates on those responsible for the highest emissions. Examples like this, widely publicized during the winter 2018–2019 protests in France, played an important role in persuading demonstrators that French climate policy was mainly a pretext to force them to pay higher taxes and that French and European authorities cared more about the haves than the have-nots.44 Of course, no matter what climate policy is adopted, there will always be people who oppose it. Clearly, however, it only strengthens the opposition if no effort is made to design a more just carbon tax. What this episode shows is once again the crucial need for new forms of transnational taxation, in this instance a true European tax system. If European governments continue to operate as they have always done—on the principle that the benefits of fiscal competition always outweigh the (real but manageable) costs and complications of a common tax policy—they will very likely face further tax revolts in the future and fatally compromise their climate policy. By contrast, the political movement to do something about climate change, which is gaining strength among the young, might change the political equation regarding democratic transparency and transnational fiscal justice.
On the Measurement of Inequality and the Abdication of Governments
It is paradoxical that in the so-called age of big data, public data on inequality are so woefully inadequate. Yet that is the reality, as is clear from the extreme difficulty of measuring the distribution of wealth. I alluded earlier to the inadequacy of the data on income distribution. The situation is even worse with respect to wealth, especially financial assets. To put it in a nutshell, statistical agencies, tax authorities, and, above all, political leaders have failed to recognize the degree to which financial portfolios have been internationalized and have not developed the tools needed to assess the distribution of wealth and to follow its evolution over time. To be clear, there is no technical obstacle to developing such tools; it is purely a political and ideological choice, the reasons for which we will try to unravel.
Of course it is possible, by exploiting and systematically comparing all currently available sources (national accounts, survey data, and tax records), to paint in broad strokes the way in which the concentration of wealth has evolved in the various regions of the world. The main results are shown in Figs. 13.8 and 13.9, which describe the evolution of the top decile and top centile shares of total wealth in France, the United Kingdom, the United States, India, China, and Russia. The oldest series are from France, where abundant estate tax records enable us to trace the history all the way back to the French Revolution (see Chapter 4). The available sources concerning the United Kingdom and other European countries (such as Sweden) are less precise but also enable us to work back to the beginning of the nineteenth century (see Chapter 5). For the United States, the data take us back to the late nineteenth and early twentieth centuries, and the quality improves after the creation of the federal estate tax in 1916. In India, the available sources (mainly surveys of estates) begin in the 1960s. In China and Russia, it is only since the wave of privatizations in the 1990s that it has become possible to analyze the evolution of the wealth distribution.

FIG. 13.8. Top decile wealth share: Rich and emerging countries
Interpretation: The top decile share of total private wealth (real estate, professional and financial assets, net of debt) has increased sharply in China, Russia, India, and the United States since the 1980s and increased to a lesser degree in the United Kingdom and France. Sources and series: piketty.pse.ens.fr/ideology.

FIG. 13.9. Top centile wealth share: Rich and emerging countries
Interpretation: The top centile share of total private wealth (real estate, professional and financial assets, net of debt) has increased sharply in China, Russia, India, and the United States since the 1980s and increased to a lesser degree in the United Kingdom and France. Sources and series: piketty.pse.ens.fr/ideology.
The big picture is relatively clear. In the Western countries, the concentration of wealth diminished sharply after World War I and remained low until the 1970s, then turned upward in the 1980s.45 Wealth inequality rose more in the United States and India than in France or the United Kingdom, as did income inequality. The increase in the concentration of wealth was particularly large in China and Russia in the wake of privatization. While this overall pattern is well established, it is important to keep in mind that there are many aspects of recent developments that remain unclear. Paradoxically, the data in Figs. 13.8–13.9 for the last three decades (1990–2020) are undoubtedly less accurate than the data for the entire period (1900–2020). This is partly because the quality of the sources is not as good as it used to be and partly because the authorities have not developed the tools needed to follow the internationalization of wealth.
As for income, the sources from which we can glean information about wealth are of several kinds. First, there are national accounts: by combining the balance sheets of firms with many surveys and inventories of production, wages, housing, and so on, statistical agencies produce estimates of GDP, national income, and financial and nonfinancial assets held by households, governments, and firms. In addition to problems associated with accounting for the degradation of national capital, which I discussed earlier, the main limitation of the national accounts is that, by design, they are concerned only with aggregates and averages and not with distribution. Nevertheless, they do provide the most complete and internationally comparable estimates of both total national income and total private and public wealth, and it is natural to begin with these totals before delving into their distribution. Household surveys are one of the main sources for studying distributions. Their strength is that they pose dozens of questions about the composition of income and wealth as well as other individual characteristics not generally available in tax data (such as level of education and professional and family background). The disadvantage is that the answers that respondents give, in the absence of any sanction or verification, are often inaccurate, particularly at the top end of the distribution where income and wealth are generally hugely understated. This is already highly problematic when it comes to measuring income inequality, but with wealth, which is much more highly concentrated (with the top decile generally holding 50 to 90 percent), it is clearly crippling.
The most important surveys of wealth are conducted jointly by statistical agencies and central banks. This makes sense, given that central banks are the public institutions most directly concerned with the evolving structure of assets and liabilities. The monetary and financial policies of central banks have a major influence on the evolution of asset prices and yields as well as on their distribution at the individual level on the one hand and the firm and government level on the other. The oldest and most complete wealth survey is the Survey of Consumer Finances, which the US Federal Reserve has conducted every three to four years since the 1960s with tens of thousands of participating households. In Europe, the European Central Bank (ECB) has since 2006 coordinated wealth surveys in the various countries of the Eurozone with an eye to harmonizing methods and questionnaires, which were totally incompatible prior to the creation of the euro in 1999–2002.46 In both the United States and Europe, central bank statisticians have made real efforts to improve the reliability of these surveys. Unfortunately, the task is beyond their reach. It is unfortunately impossible to measure the distribution of wealth, especially financial assets, properly on the basis of self-declared surveys. Despite all the efforts to improve the results, the total wealth declared in the Household Finance and Consumption Survey (HFCS) coordinated by the ECB is at most 50–60 percent of the total estimated in national accounts. This is primarily the result of understatement of wealth by respondents at the top of the distribution, particularly in regard to financial assets. In a nutshell, the ECB prints hundreds of billions of euros (indeed, trillions of euros, as we will see later) to influence the European economy and the formation of asset prices, but it does not know how to measure the distribution of all that wealth correctly.
Overcoming Opacity: A Public Financial Register
What is particularly distressing about this situation is that the problem can easily be solved by developing better tools. Indeed, it would suffice to correlate survey data with data from financial institutions and tax authorities concerning financial assets. Real estate ownership has long been recorded not only in deed registries but also by tax authorities charged with collecting the property tax in the United States or the real estate tax (taxe foncière) in France. One of the main institutional innovations of the French Revolution was to establish a national cadastre (property register) covering all real estate (agricultural and nonagricultural land, homes, buildings, warehouses, factories, shops, offices, and so on). Similar reforms were introduced in most countries: in a sense, this marked the birth of ownership society. The centralized state assumed responsibility for recording and protecting property rights, supplanting the noble and clerical classes that had previously regulated power and property relations in premodern trifunctional societies (see Chapters 3–4). This process coincided with the development of the legal infrastructures required to organize relations of exchange and production on a wider scale than in the past.
Financial assets are in fact recorded in various ways that could be tracked. The problem is that governments have largely left responsibility for this in the hands of private financial intermediaries. In each country (or continent) there are private institutions that serve as central repositories (custodian banks) for financial assets. Their function is precisely to keep track of the ownership of nonphysical assets issued by companies (such as stocks, bonds, and other financial instruments). The goal is to make sure that no two individuals can both claim ownership of the same financial assets, which for obvious reasons would complicate the workings of the economy. The best known custodian banks are the Depository Trust Company in the United States and Clearstream and Eurostream in Europe.47 The fact that this function is discharged by private companies, which incidentally have in recent years drawn complaints about the opacity of their operations, raises a number of problems. Governments in the United States and Europe could easily decide to nationalize them or at a minimum to regulate them more closely to establish a true public register of financial assets. They could then establish rules to allow the identification of the ultimate holders of each asset (that is, the physical person exercising effective control, beneath the veil of shell companies and other complicated financial structures), which is not always the case today because of the way custodian banks operate.48
While it would be desirable for such a financial register to cover the widest possible expanse of territory—Europe, say, or Europe and the United States, or Europe and Africa, and ultimately the entire globe—it is important to point out that each state can make progress toward the final goal without waiting for others to act. Specifically, each country can immediately impose regulations on companies doing business within its borders. Each government could, for instance, require companies to provide detailed information about their stockholders. Indeed, rules of this sort exist already for both listed and unlisted firms, but they could be significantly reinforced and systematized in light of the possibilities offered by new information technologies.
Furthermore, tax authorities have for a long time required banks, insurance companies, and financial institutions to transmit information about interest, dividends, and other financial income received by taxpayers. In many countries, this information appears automatically in pre-filled tax statements sent to taxpayers for verification along with information about other third-party income (such as wages and pensions). The new technology makes it possible to automate monitoring procedures that were previously hit-and-miss. In principle, technology should make it possible to tabulate detailed information about financial income and the assets from which it derives. This information could be used both to ensure more efficient tax collection and to produce statistics on the distribution of wealth and its evolution.
To date, however, political choices have limited the potential positive effects of new technology. For one thing, bank reporting requirements often omit various forms of financial income subject to special rules.49 Exemptions of this kind seem to have proliferated in recent decades, especially in Europe. In some cases, income from financial assets is taxed separately at a flat rate rather than the progressive rates applicable to other types of income (especially wages).50 In theory, it should be entirely possible to separate the mode of taxation from the transmission of information. In practice, whenever financial income of a certain type—and especially a flat tax—is made subject to special rules, the relevant information generally disappears from tax statements and published statistics, thus decreasing the quality of the public data and democratic transparency as to capital income, even though modern information technology should have the opposite effect.51 On top of that, there has been a clear degradation of the quality of inheritance data (which in some cases is disappearing), so it is no exaggeration to say that published wealth statistics have become much poorer in recent years.
Furthermore, the automatic transmission of information from banks to tax authorities is generally limited to the income from financial assets, whereas it could easily include information about the assets themselves. In other words, using information from financial institutions and real estate registries, the tax authorities could easily compile pre-filled wealth statements, just as the French authorities do now with income statements. Instead, the ECB and European statistical agencies rely entirely on self-declared wealth surveys so that it is completely impossible to track the evolution of the composition of wealth (and especially financial assets) in the Eurozone; hence the ECB cannot even study the effects of its own policies. We find the same statistical backwardness in the United States. The Federal Reserve’s wealth surveys, although more homogeneous and of overall better quality than their European counterparts, also rely entirely on self-declaration with no verification against bank or administrative data, which greatly limits accuracy, particularly when it comes to tracking the portfolios of the wealthiest taxpayers.
On the Impoverishment of Public Statistics in the Information Age
This situation is all the more surprising in that the use of tax and administrative data has become standard practice in the measurement of the income distribution. In the United States, there is a very broad consensus around the idea that self-declared income declarations are not sufficiently accurate and must be complemented by tax data from filed income tax returns. Indeed, it was the use of tax data that established the very sharp increase of inequality after 1980 (an increase that was underestimated in survey data). In Europe, many statistical agencies recognized the limitations of self-declared income surveys and therefore decided decades ago to move to a mixed model. One starts with survey data, which provides social, demographic, occupational, and educational data not available from tax records, but one then adds data from official tax records to provide accurate information about the income of the households responding to the survey. Since these official records reflect data transmitted by firms, government agencies, and financial institutions to the tax authorities, this mixed model is widely seen as more reliable and satisfactory than the self-declared model.52 When it comes to wealth, however, the countries of Europe (as well as the United States) behave as though surveys alone suffice, even though the evidence shows that self-declared wealth is even less reliable than self-declared income.
How can we explain this, and, more generally, how can we explain why the era of “big data” and modern information technology has also witnessed an impoverishment of public statistics, especially regarding the measurement of wealth and its distribution?
Note first that this is a complex phenomenon, with multiple causes. For instance, when tax authorities moved to digital technology in the 1980s, this was in some cases accompanied by a paradoxical loss of statistical memory.53 In my view, however, another piece of the explanation has to do with a certain political fear of transparency and the demands for redistribution that might result from it. Indeed, to lend credibility to the system I have just described (combining a public financial register with pre-filled wealth declarations), it would be ideal to link it to a tax on wealth. In the beginning, this could be a simple registration fee (of 0.1 percent per year or less, for instance), which each asset owner would be required to pay to record his or her ownership of the asset and thus enjoy the protections of the national and international legal system. The government would then have the tool it needs to make the distribution of wealth transparent, and this information would become available for public debate and democratic deliberation, which might (or might not) lead to more substantial progressive wealth tax rates or other redistributive policies.54 Fear that events would take this course is, I think, one key reason why political leaders have been unwilling to support transparency about the distribution of wealth.
This unwillingness is extremely dangerous, I believe, not only for Europe and the United States but also for the rest of the world. Among other things, it takes away an essential tool for understanding the reality of inequality and developing policies to reduce it. These anti-democratic choices make it impossible to develop ambitious international egalitarian programs and ultimately hasten the retreat within the borders of the nation-state and the rise of identitarian reaction. Succinctly stated, if we do not acquire the transnational tools to reduce socioeconomic inequalities, and especially inequality of wealth, then political conflict will inevitably center on questions of national identity and borders. I will have much more to say about this in Part 4.
If the rejection of transparency is bad, how do we get beyond it? First, we need to gain a better understanding of its political-ideological roots. In general terms, the underlying ideology is fairly close to the proprietarian ideology that was dominant throughout the nineteenth and into the early twentieth centuries. Adherents stubbornly refused to open Pandora’s box by questioning the distribution of wealth, for fear that once opened, it could never be closed again. One of the novelties of today’s neo-proprietarianism is precisely that Pandora’s box was opened in the twentieth century as many countries experimented with a variety of redistributive solutions. In particular, the failure of communism is regularly invoked in both postcommunist and capitalist countries as an object lesson—a warning as to where any ambitious redistributive project is likely to end up. But this is to forget that the economic and social success of the capitalist countries in the twentieth century depended on ambitious and largely successful programs to reduce inequality, and in particular on steeply progressive taxes (Chapters 10–11). Why has this lesson been forgotten? Lack of historical memory is one reason, and disciplinary divisions in the academy are another, but these can be overcome. In the twentieth century, exceptional one-time levies on the largest fortunes (in real estate and above all financial assets) played a crucial role in eliminating existing public debt and turning attention from the past to the future, especially in Germany and Japan. It may be tempting to say that the circumstances were unique and that these experiences cannot be repeated. But the reality is that extreme inequality recurs again and again; to deal with it, societies need institutions capable of periodically redefining and redistributing property rights. The refusal to do so in as transparent and peaceful a manner as possible only increases the likelihood of more violent but less effective remedies.
Neo-Proprietarianism, Opacity of Wealth, and Fiscal Competition
Neo-proprietarianism refuses to be transparent about wealth. Opacity is maintained by a specific set of legal and institutional arrangements, which allow free circulation of capital but require no common system of registration or taxation of property. For much of the nineteenth century, proprietarianism depended on censitary suffrage; that is, limited property-qualified access to the polls. Only the wealthiest people enjoyed the right to vote so that the risk of political redistribution of property was quite limited. Today, the international neo-proprietarian legal regime complements constitutional protections of property rights and in a sense serves as a substitute for the censitary system. The refusal of transparency is sometimes justified by the idea that data about property ownership could be used in nefarious ways by dictatorial governments. In Europe, however, this argument has little weight. European banks have long shared information with their countries’ tax authorities, which enjoy reputations for neutrality in systems where the rule of law is unchallenged. The argument that transparency leads to government abuse reminds one of Montesquieu, the owner of the highly lucrative post of president of the Parlement of Bordeaux, who argued for maintaining the jurisdictional privileges of the nobility on the grounds that a centralized legal system would inevitably lead to despotism.55
A potentially more convincing argument, which has played a key role in the rejection of a common European tax system, is that taxes in Europe are already too high and that only intense fiscal competition among governments keeps them from increasing without limit. Besides being anti-democratic, this argument has numerous other problems. If Europeans could vote for common taxes in the framework of a common democratic assembly, it is by no means certain that they would vote for unlimited tax increases. It is just as likely that they would vote for a different tax system altogether: for example, a system that would tax high incomes and large fortunes more heavily in order to alleviate the burden on the lower and middle classes (a burden created by the continuous increase in indirect and direct taxes and contributions on wages and pensions). Bear in mind that there was enough trust among these same European states to establish a common currency and a powerful European Central Bank with the authority to create trillions of euros by simple majority vote of its Governing Council, with minimal democratic control. To reject transparency of ownership and common democratic taxes is particularly dangerous, since it also leaves the ECB itself in the position of conducting monetary policy without reliable data on the distribution of wealth in Europe and its evolution.56
In principle, progress toward greater transparency after the financial crisis of 2008 should have been facilitated by announcements made at various international summits (such as the G8 and G20) concerning the need to combat tax havens and fiscal opacity. Some countries did take concrete steps: for example, in 2010 the United States passed the Foreign Account Tax Compliance Act, which in theory requires financial institutions around the world to transmit to relevant tax authorities all information concerning their customers’ bank accounts and asset holdings. In practice, such measures do not go far enough, however, and nothing has been done about replacing custodian banks with a public financial register. What efforts to date have demonstrated, though, is that progress is possible with adequate sanctions, such as the threat to cancel the licenses of Swiss banks to operate in the United States (which helped to eliminate some of the more glaring abuses). In this regard, Europe unfortunately stands out more for its declarations of good intentions than for real action. One important reason for this is that all decisions on tax matters in the European Union are stymied by the rule of unanimity.
In recent years Europe has been hit by a number of financial and fiscal scandals. For instance, in November 2014, the LuxLeaks story broke just as Jean-Claude Juncker was taking office as president of the European Commission. An international consortium of journalists published leaked documents from the period 2000–2012, which showed how the government of Luxembourg had entered into a series of confidential agreements (called tax letters) with private firms. Under the terms of these agreements, negotiated in private, large companies were granted the right to pay taxes below official rates (which were already quite low in Luxembourg). As it happens, the prime minister of Luxembourg from 1995 to 2013 was none other than Jean-Claude Juncker, who also served as the grand duchy’s finance minister and as president of the Eurogroup (the council of finance ministers of the Eurozone).
No one was really surprised to learn that Luxembourg countenanced tax evasion—nor did this discovery prevent the European People’s Party, an alliance of Christian Democratic and center-right parties, from designating Juncker as its candidate for the Commission presidency—but the scope of the practice was breathtaking. In Chapter 12, I noted that Chinese tax authorities publish no data to show that they are actually enforcing the ostensible tax code. What went on in Luxembourg was not very different. Caught red-handed, Juncker admitted the facts of the case. He explained in substance that while these practices may not have been very satisfactory from a moral point of view, they were perfectly legal under Luxembourg’s tax laws. In several interviews with European newspapers, he justified what was done on the grounds that Luxembourg had been hit hard by deindustrialization in the 1980s and needed a new development strategy for his country. What he hit upon was a strategy based on the banking sector, “tax dumping,” financial opacity, and siphoning of tax revenues from Luxembourg’s neighbors.57 He promised not to do it again, however, and the leading parties of the European Parliament (including not only his own center-right party but also the liberals and the social democrats sitting on the center-left) chose to reward him with their confidence.
Similar consortiums of journalists subsequently broke other scandals, including Swiss Leaks in 2015 and the Panama Papers in 2016–2017, which disclosed widespread use of tax havens and other occult practices. These revelations demonstrated the extent of the cheating, even in countries reputed for efficient tax administration, such as Norway. Using data from the Swiss Leaks and Panama Papers in conjunction with Norwegian tax records (which were made available for study) and data from random tax audits, researchers were able to show that tax evasion was rare among people with little wealth but amounted to nearly 30 percent of the taxes due on the largest 0.01 percent of fortunes.58
In the end, it is hard to know how these various affairs affected European public opinion, especially in the case of Juncker, who occupied the highest political office in the European Union from 2014 to 2019. What is certain is that no decision was taken in those years to develop a public financial register, to harmonize taxes on the most mobile taxpayers, or in a more general sense, to take steps to make sure that such scandals would not happen again. All this created the impression that the fight for fiscal justice and for higher taxes on major economic actors was not really a priority for the EU. This is dangerous, in my view, because it inevitably encourages anti-European sentiment among the lower and middle classes and provokes nationalist and identitarian reactions from which nothing positive can come.
On the Persistence of Hyperconcentrated Wealth
Let us return now to the measurement of the concentration of wealth and its evolution. In the absence of a public financial register and information from financial institutions, we have to make do with incomplete data. Combining household surveys with income and inheritance tax data is the best way to proceed. The curves shown in Figs. 13.8–13.9 for the United States, France, and the United Kingdom are based on this mixed method. To test the consistency of the results, we also compared them with data from the very top end of the distribution provided by magazines such as Forbes, which has been compiling annual lists of the world’s billionaires since 1987.
For the United States, the income tax method yields results quite close to those found by Forbes while the inheritance tax method yields a smaller (though still significant) increase (as does the uncorrected household survey).59 There are two apparent reasons for this: first, the inheritance tax has been less carefully audited than the income tax in the United States since the 1980s,60 and second, the so-called mortality multiplier method becomes less accurate as the population ages.61 The capitalization method applied to the income tax data also suffers from certain limitations, and the results obtained are not entirely satisfactory.62 In general, both methods (mortality multiplier and capitalization) are second-best solutions: it would be far better to have direct information from financial institutions and tax authorities about the wealth of living taxpayers rather than be forced to make inferences from the amount of capital income and size of estates. For the United Kingdom, the tax data on capital income have deteriorated so much since the 1980s that one has to rely on estate tax data alone, whereas up to the 1970s one can use both methods and compare the results for consistency.63 Finally, in the case of France, both methods yield similar evolutions, globally consistent with the Forbes classifications.64 There has, however, been a dramatic deterioration in the quality of the inheritance tax data for France in recent decades.65 To be sure, the situation is even worse in countries that have abolished the inheritance tax, where information is totally lacking.66
All in all, despite these difficulties, the curves shown in Figs. 13.8–13.9 for the United States, United Kingdom, and France over the last few decades can be considered to be reasonably consistent and accurate, at least to a first approximation. For the other countries shown (China, Russia, and India), there is no sufficiently detailed income tax data (and there is no inheritance tax data at all), so we are reduced to using the Forbes classifications to correct the household survey data at the top end of the distribution.
The results obtained probably bear some resemblance to reality, but I want to stress how unsatisfactory it is to have to rely on such a nebulous “source.” To be sure, published wealth rankings in all countries show dramatic changes in recent decades, and these changes on the whole seem consistent with what we are able to measure using other available sources. Note that, according to Forbes, the world’s largest fortunes have grown at a rate of 6–7 percent a year (correcting for inflation) from 1987 to 2017—that is, three to four times as fast as average global wealth and roughly five times as fast as average income (Table 13.1).
Obviously, such differences cannot persist indefinitely unless one assumes that the share of global wealth owned by billionaires will eventually approach 100 percent, which is neither desirable nor realistic. Most likely, a political reaction will set in well before this occurs. The spectacular growth of large fortunes may have been accelerated by the privatization of many public assets between 1987 and 2017, not only in Russia and China but also in the Western countries and around the world, in which case this evolution may slow in coming years (to the extent that there are fewer and fewer assets to privatize). The legal imagination being what it is, however, it may not be a good idea to count on this. Furthermore, the available data suggest that the gap was equally large in the two subperiods, 1987–2002 and 2002–2017, despite the financial crisis, which suggests that there are deep structural factors at work. It is possible that financial markets are structurally biased in favor of the largest portfolios, which are able to earn real returns higher than others—as high as 8–10 percent a year for the largest US university endowments in recent decades.67 Furthermore, all available evidence suggests that the world’s largest fortunes have made very advantageous use of clever tax-avoidance strategies, which enable them to earn returns higher than smaller fortunes can.
The concepts and methods used by magazines like Forbes to establish these classifications are so vague and imprecise as to be useless for delving more deeply into these questions.68 The fact that the global debate about inequality is partly based on such “sources” and that even public authorities sometimes invoke them is symptomatic of a widespread failure of public institutions to meet the challenge of measuring wealth inequality.69 These are key democratic issues, however, and the public has begun to take notice of them, including in the United States. There, as I noted in Chapter 11, rising inequality has led to calls for more progressive taxes and in turn to demands for greater statistical transparency.70
|
The rise of top global wealth holders, 1987–2017 |
||||
|
Average real annual growth rate, 1987–2017 (corrected for inflation) |
World |
US, Europe, China |
||
|
The 1/100 millionth richest (Forbes) |
6.4% |
7.8% |
||
|
The 1/20 millionth (Forbes) |
5.3% |
7.0% |
||
|
The 0.01 percent richest (WID.world) |
4.7% |
5.7% |
||
|
The 0.1 percent richest (WID.world) |
3.5% |
4.5% |
||
|
The 1 percent richest (WID.world) |
2.6% |
3.5% |
||
|
Average wealth per adult |
1.9% |
2.8% |
||
|
Average income per adult |
1.3% |
1.4% |
||
|
Total adult population |
1.9% |
1.4% |
||
|
GDP or total income |
3.2% |
2.8% |
||
|
Interpretation: From 1987 to 2017, the average wealth of the 100 millionth richest people in the world (about thirty out of 3 billion adults in 1987 and about fifty out of 5 billion in 2017) grew by 6.4 percent a year globally, and the average person’s wealth grew by 1.9 percent a year. The skyrocketing of the largest fortunes was even more marked if one looks only at the United States, Europe, and China. Sources and series: piketty.pse.ens.fr/ideology. |
||||

FIG. 13.10. The persistence of hyperconcentrated wealth
Interpretation: The top decile of private wealth owners in Europe owned 89 percent of all private wealth (average of the United Kingdom, France, and Sweden) in 1913 (compared with 1 percent for the bottom 50 percent), 55 percent in Europe in 2018 (compared with 5 percent for the bottom 50 percent), and 74 percent in the United States in 2018 (compared with 2 percent for the bottom 50 percent). Sources and series: piketty.pse.ens.fr/ideology.
To recapitulate, the resurgence of wealth inequality coupled with increased financial opacity is an essential feature of today’s neo-proprietarian inequality regime. Although the twentieth century witnessed a deconcentration of wealth that allowed the emergence of a patrimonial middle class, wealth remained quite unequally distributed, with the bottom 50 percent of the distribution owning a negligible share of the total (Fig. 13.10). The sharp increase of the top decile share, especially in the United States, reflects a gradual and worrisome erosion of the share owned by the rest of the population. The lack of diffusion of wealth is a central issue for the twenty-first century, which may undermine the confidence of the lower and middle classes in the economic system—not only in poor and developing countries but also in rich ones.
On the Persistence of Patriarchy in the Twenty-First Century
The hypercapitalist societies of the early twenty-first century are quite diverse. Of course, they are connected to one another by the globalized and digitalized capitalist system. But every country also bears traces of its own particular political-ideological trajectory, whether it be social-democratic, postcommunist, postcolonial, or petro-monarchical. Generally speaking, today’s inequality regimes combine elements of modernity and archaism. Some institutions and discourses are new, while others reflect a return to old beliefs, including a quasi-sacralization of private property.
Among the most archaic and traditionalist survivals is patriarchy. Most societies throughout history have known one form or another of male domination, especially with regard to political and economic power. This was obviously the case in premodern trifunctional society where warrior and clerical elites were also male, no matter what the civilization or religion. It was also the case in nineteenth-century proprietarian society. Given the increased role of the centralized state with its codes and laws, the scope of male domination in proprietarian society even grew or at any rate became more systematic in its application. Feminist demands raised during the French Revolution were quickly silenced and forgotten, and Napoleon’s Civil Code of 1804 bestowed all legal power on the male paterfamilias and property owner, in all families, rich or poor, throughout France.71 In many Western countries, including France, it was not until the 1960s and 1970s that married women were allowed to sign work contracts or open bank accounts without their husband’s approval or that the law ceased to treat male and female adultery differently in divorce. The battle for women’s right to vote was long and conflictual and is not over yet. Women were successful in New Zealand in 1893, in the United Kingdom in 1928, in Turkey in 1930, in Brazil in 1932, in France in 1944, in Switzerland in 1971, and in Saudi Arabia in 2015.72
With this lengthy history in mind, people sometimes imagine that a consensus exists today, especially in the West, concerning equality between men and women and that the issues of patriarchy and male domination are behind us. The reality is more complex. If one looks at the percentage of females among top earners (whether salaried or self-employed), one finds that women have indeed made progress. In France, the proportion of women among the top income centile increased from 10 percent in 1995 to 16 percent in 2015. The problem is that this evolution has been extremely slow. If it continues in the coming decades at the same rate as in the period 1995–2015, women will account for half of the top income centile in 2102. If one does the same calculation for the top 0.1 percent, one finds that parity will not be achieved until 2144 (Fig. 13.11).
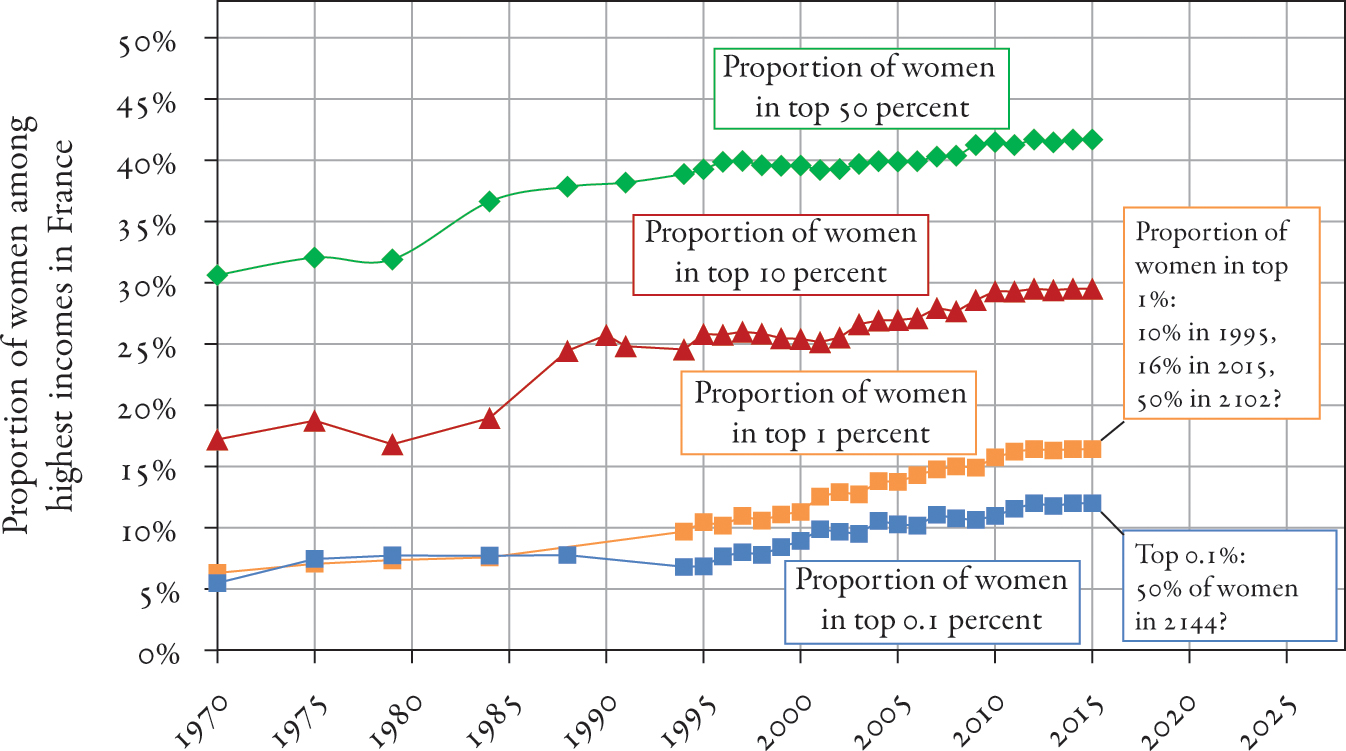
FIG. 13.11. The persistence of patriarchy in France in the twenty-first century
Interpretation: The proportion of women in the top centile of the labor income distribution (wages and nonwage labor income) rose from 10 percent in 1995 to 16 percent in 2015 and should reach 50 percent in 2102 if the 1994–2015 trend continues. For the top 0.1 percent, parity could be delayed until as late as 2144. Sources and series: piketty.pse.ens.fr/ideology.
It is striking to note that the figures are almost exactly the same for the United States in terms of both level and rate of increase. Specifically, men accounted for 90 percent of the top income centile in 1990 and about 85 percent in the mid-2010s.73 In other words, the very sharp increase in the share of national income going to the top centile primarily concerns men. In this respect, male domination is not going away any time soon. For all countries for which similar data are available, we find the same marked male dominance among the top income group and relatively slow progress toward parity.74
There are several reasons for this slow progress. First, the historical prejudice against women is significant, particularly when it comes to holding positions of responsibility and power. I alluded earlier to experiments in India in which the same political speeches were read by male and female voices: those read by women were systematically judged to be less credible, but this bias was smaller in towns that had been led by a women because the post was “reserved” for a woman chosen by lot.75
It bears emphasizing, moreover, that the period 1950–1980 was a sort of golden age of patriarchy in Western culture. For the lower and middle class as well as the upper class, it was the era of the housewife as feminine ideal: the goal for every woman was to give up any thought of earning money through a professional career in order to stay at home with the children. Indeed, we are only just emerging from this period. In France in 1970, for example, women aged 30–55 earned on average one-quarter of what men earned for work outside the home. In other words, nearly 80 percent of all wages went to men because women suffered from both a lower rate of participation in the work force and lower pay if they did work.76 It was a world in which women were responsible for domestic work and for bringing warmth and affection to the home in a cold industrial age but were de facto excluded from money matters. Of course, many tasks were assigned to women (especially childcare and other emotional labor), but managing the household budget was not one of them. The situation has evolved considerably since then, but the average pay gap remains quite high: to be sure, in 2015, it was “only” 25 percent at the beginning of working life in 2015, but owing to differences in career trajectories and opportunities for promotion, it was greater than 40 percent at age 40 and 65 percent at age 65, which also implies enormous inequalities of pension income.77
To accelerate the convergence process, proactive measures are needed. For example, one might consider quotas or “reservations” of certain jobs for women, as in India, not only for elective office (where such quotas already apply in many countries) but also for higher-level jobs in firms, government offices, and universities. There is also a need to rethink how working time is organized and how professional life relates to family and personal life. Many men who earn the highest pay rarely see their children, family, friends, or the outside world (even when they have the means to live otherwise, in contrast to less well-paid workers). Solving the problem by giving women incentives to live similar lives is not necessarily the best choice. Research has shown that the professions in which male-female equality has progressed the most are those in which work is organized so as to give individuals more control over their schedules.78
In addition, the increase in the concentration of wealth has had specific consequences for gender inequality. First, the division of assets among siblings or within couples has become particularly important. While there may in theory be laws requiring equal partition among brothers and sisters or between husbands and wives, there are many ways to get around them: for instance, through the evaluation of professional assets.79 In countries like France, it has become increasingly common for couples to form between individuals who bring comparable amounts of property (and not just equivalent incomes and levels of education) to the marriage.80 In a way, this represents a return to the world of Balzac and Austen, even if the level of patrimonial homogamy today is not as high as it was in the nineteenth century.81 In view of the very rapid increase of professional homogamy in recent decades (also called assortative mating—a phenomenon that has played a very important role in the rise of inequality between couples in the United States and in Europe), it is entirely possible that patrimonial homogamy will continue to increase in the twenty-first century.82
The last few decades have also witnessed a very important parallel development of separate property both in marriages and civil unions. In theory, this could be a logical complement of greater professional equality between men and women and more distinctive career patterns.83 In practice, given that income inequality within couples remains high—partly due to interruption of the wife’s career following childbirth(s)—the shift to separate property has mainly benefited men. This phenomenon has contributed to a paradoxical increase of wealth inequality between men and women (especially after divorce or separation) since the 1990s, in contrast to the relative convergence of labor income.84 These changes, which have been too little studied, once again illustrate the central role of the legal and tax systems in determining the structure of inequality regimes. They also show how wrong it would be to think that the movement toward greater gender equality is somehow “natural” and irreversible. In Part Four I will say more about the role of gender inequality in the evolution of political cleavages.
On the Pauperization of Poor States and the Liberalization of Trade
We turn now to an issue of particular importance to the evolution of the global inequality regime in the twenty-first century: the relative and paradoxical pauperization of the poorest states in recent decades, particularly in sub-Saharan Africa and South and Southeast Asia. There has in general been a good deal of variation in the rate at which poor countries have closed the gap with rich countries since the 1970s. The China-India comparison has already been discussed at length. We saw that China not only grew faster than India but also generated less inequality, probably because it invested more in education, health, and necessary developmental infrastructure.85 More generally, we have seen that economic development has historically always been closely associated with state building. The constitution of a legitimate government capable of mobilizing and allocating major resources while retaining the confidence of the majority is the fundamental prerequisite of successful development and the hardest to achieve.
In this connection, it is striking to discover that the poorest states in the world became poorer in the period 1970–2000; things improved very slightly between 2000 and 2020 but did not return to their initial level (which was already very low). More precisely, if we divide the countries of the world into three groups and look at the average tax revenues of the poorest group (which consists mainly of African and South Asian countries), we find that tax receipts fell from nearly 16 percent of GDP in 1970–1979 to less than 14 percent in 1990–1999 and then rose to 14.5 percent in 2010–2018 (Fig. 13.12). Not only are these extremely low levels; they also conceal important disparities. In many African countries, such as Nigeria, Chad, and the Central African Republic, tax revenues are just 6–8 percent of GDP. As noted when we analyzed centralized state formation in today’s developed countries, this level of tax revenue is just enough to maintain order and basic infrastructure but not enough to finance significant investments in education and health care.86 At the same time, we find that tax revenues in the richest countries (essentially in Europe and North America plus Japan) have continued to increase, rising from an average of about 30 percent of GDP in the 1970s to 40 percent in the 2010s.

FIG. 13.12. Tax revenues and trade liberalization
Interpretation: In low-income countries (bottom third: sub-Saharan Africa, South Asia, etc.), tax revenues fell from 15.6 percent of GDP in 1970–1979 to 13.7 percent in 1990–1999 and 14.5 percent in 2010–2018, partly because of the uncompensated decrease in customs duties and other taxes on international trade (which brought in 5.9 percent of GDP in the 1970s, 3.9 percent in the 1990s, and 2.8 percent in 2010–2018). In high-income countries (top third: Europe, North America, etc.), customs duties were already very low at the beginning of the period and tax revenues continued to rise before stabilizing. Sources and series: piketty.pse.ens.fr/ideology.
To explain the peculiar trajectory of the poor countries, we must of course consider the fact that state building is a lengthy and complex process. In the late 1960s and early 1970s, most of the sub-Saharan African countries had just emerged from colonization. These newly independent states faced significant challenges in terms of internal and external consolidation, in some cases contending with separatist movements as well as rates of demographic growth that no Western country ever faced. The tasks were immense, and no one expected tax revenues to jump to 30 or 40 percent of GDP in the space of a few years (besides which there would have been undesirable effects had they done so). Nevertheless, the fact that tax revenues actually decreased between 1970 and 2000 (by nearly 2 percent of GDP) is a historical anomaly, which greatly handicapped the development of efficient social states in these countries in the crucial post-independence decades. This anomaly calls for an explanation.
Recent work has shown that this post-independence decrease of tax revenues was closely tied to an unusually rapid liberalization of trade, which was in part imposed by the rich countries and international organizations during the 1980s and 1990s, leaving the poor countries without the time or support necessary to replace what they used to take in as customs duties with new taxes (such as taxes on income or property).87 In the 1970s, customs duties and other taxes on international trade accounted for a very large share of total tax revenue in the poor countries: nearly 6 percent of GDP. This was by no means an unusual situation: it was the same in Europe in the nineteenth century. Customs duties are the easiest taxes to collect, and it is natural to rely on them in the early phases of development. But the Western countries were able to reduce tariffs very gradually and at their own pace as they developed other types of taxes capable of replacing the revenue from customs duties while increasing total revenue. The poorest countries on the planet, especially in sub-Saharan Africa, faced a very different situation: their receipts from customs duties suddenly plunged to less than 4 percent of GDP in the 1990s and to less than 3 percent in the 2010s, and their governments were initially unable to make up for these losses.
My point is not to place the entire responsibility for what happened in Africa on the shoulders of the former colonial powers. The development of any tax system depends primarily on the nature of domestic sociopolitical conflict. Nevertheless, it was very difficult for the poorest countries in the world to resist the pressure of the rich countries for accelerated trade liberalization, especially in the ideological climate of the 1980s, which tended to disparage the state and progressive taxation, particularly under the so-called Washington consensus led by the US government and international organizations based in Washington (such as the World Bank and International Monetary Fund).
In a more general sense, it bears emphasizing that all the points previously made about the lack of economic and financial transparency in the rich countries have even more serious consequences in the poor countries. In particular, the regime of heightened fiscal competition and free capital flows without political coordination or automatic exchange of bank information—a regime promoted by the United States and Europe since the 1980s—has proved extremely undesirable and damaging for poor countries, especially in Africa. According to available estimates, assets held in tax havens represent at least 30 percent of total African financial assets—three times higher than in Europe.88 It is not easy to persuade people to consent to taxes and construct new collective norms of fiscal justice in an environment where many of the wealthiest taxpayers can avoid paying taxes by stashing their assets abroad and escaping to Paris or London if the necessity arises. On the other hand, an ambitious program of legal and fiscal cooperation with the rich countries and greater international transparency regarding financial assets and the profits of multinational firms could allow the poorest countries to develop their state and fiscal capacities under far better conditions than presently exist.
Will Monetary Creation Save Us?
One of the most dramatic changes since the financial crisis of 2008 is the new role of central banks in creating money. This change has profoundly altered perceptions of the respective roles of the state and central banks, taxes and money; more generally, it has changed the way people think about what a just economy means. Before the crisis, the prevailing wisdom was that it was impossible, or at any rate not advisable, to ask central banks to create huge amounts of money in a short space of time. In particular, this was the understanding on which Europeans agreed to create the euro in the 1990s. After the “stagflation” of the 1970s (a mixture of economic stagnation, or at any rate slow growth, with high inflation), it was not too difficult to convince people that the euro should be managed by a central bank with as much independence as possible and a mandate to keep inflation positive but low (under 2 percent) while interfering as little as possible in the “real” economy; these were the terms under which the Maastricht Treaty was agreed in 1992. After the crisis of 2008, however, central banks around the world suddenly took on a new role, sowing great confusion in Europe and elsewhere. It is important to understand what happened.
To clarify the terms of the discussion, let us begin by examining the evolution of the balance sheets of the principal central banks from 1900 to 2018 (Fig. 13.13). The balance sheet of a central bank lists all the loans it has made to other economic actors, generally through the banking system, and all the financial assets and securities (mainly bonds) it has purchased on financial markets. Most of these loans and bond purchases take place by way of purely electronic monetary creation by the central bank, without any actual printing of banknotes or minting of coins. To simplify the discussion and clarify the mechanisms involved, it is best to begin by imagining an entirely digital monetary economy—that is, an economy in which money exists only as virtual signs in bank computers and all transactions are settled electronically by credit card (which is not far from being the case already, so that describing today’s real economy would require few changes to the description I will give here).

FIG. 13.13. The size of central bank balance sheets, 1900–2018
Interpretation: The total assets of the European Central Bank rose from 11 percent of Eurozone GDP on the last day of 2004 to 41 percent on the last day of 2018. The 1900–1998 curve is the average of the French and German central banks, with peaks of 39 percent in 1918 and 62 percent in 1944). The total assets of the Federal Reserve (created in 1913) rose from 6 percent of United States GDP in 2007 to 26 percent at the end of 2014. Note: The rich country average includes Australia, Belgium, Canada, Denmark, Finland, France, Germany, Holland, Italy, Japan, Norway, Portugal, Spain, Sweden, Switzerland, the United Kingdom, and the United States. Sources and series: piketty.pse.ens.fr/ideology.
On the eve of the financial crisis of 2007–2008, the balance sheet of the US Federal Reserve represented the equivalent of a little more than 5 percent of US GDP, while that of the ECB was close to 10 percent of Eurozone GDP. Both balance sheets consisted primarily of short-term loans to banks, usually with terms of a few days or at most a few weeks. Lending to banks in this way is the traditional function of a central bank in periods of calm. Deposits and withdrawals of funds from private bank accounts depend on the decisions of millions of individuals and businesses, so daily deposits and withdrawals never precisely balance each other to the exact dollar or euro. Banks therefore lend to one another on a very short-term basis to keep the payment system in balance, and the central bank maintains the stability of the whole system by injecting liquidity as needed. These loans—both interbank loans and loans from the central bank to private bank—are generally liquidated within a few days or weeks and leave no lasting trace. The whole business is a purely technical financial operation, essential to the stability of the system but generally of little interest to outside observers.89
After the bankruptcy of Lehman Brothers in September 2008 and the ensuing financial panic, things changed completely, however. The world’s major central banks devised increasingly complex money-creation schemes collectively described by the enigmatic term “quantitative easing” (QE). In concrete terms, QE involves lending to the banking sectors for longer and longer periods (three months, six months, or even a year rather than a few days or weeks) and buying bonds issued by private firms and governments with even longer durations (of several years) and in much greater quantities than before. The Federal Reserve was the first to react. In September-October 2008 its balance sheet increased from the equivalent of 5 percent of GDP to 15 percent; in other words, the Fed created money equivalent to 10 percent of US GDP in a few weeks’ time. This proactive stance would continue in subsequent years: the Fed’s balance sheet had risen to 25 percent of GDP by the end of 2014; since then it has declined slightly, but it remains substantially larger than it was before the crisis (20 percent of GDP at the end of 2018 compared with 5 percent in mid-September 2008). In Europe the reaction was slower. The ECB and other European authorities took longer to understand that massive intervention by the central bank was the only way to stabilize financial markets and reduce the “spread” between the interest rates of the various Eurozone countries.90 Since then, ECB purchases of public and private bonds have accelerated, however, and the ECB’s balance sheet stood at 40 percent of Eurozone GDP at the end of 2018 (Fig. 13.13).91
There is a fairly broad consensus that this massive intervention by central banks prevented the Great Recession of 2008–2009, the worst downturn of the postwar period in the rich countries (with an average 5 percent decrease of activity in the United States and Europe), from turning into an even deeper crisis comparable to the Great Depression of the 1930s (which saw decreases of 20–30 percent in the major economies between 1929 and 1932). By avoiding cascading bank failures and acting as “lender of last resort,” the Fed and ECB did not repeat the errors that the central banks committed in the interwar years, when orthodox “liquidationist” thinking (based on the idea that bad banks must be allowed to fail so that the economy can restart) helped push the world over the edge of the abyss.
That said, the danger is that these monetary policies, by avoiding the worst, gave the impression that no broader structural change in social, fiscal, or economic policy was necessary. Nevertheless, the fact is that central banks are not equipped to solve all the world’s problems or to serve as the ultimate regulator of the capitalist system (let alone move beyond it).92 To combat excessive financial deregulation, rising inequality, and climate change, other public institutions are necessary: laws, taxes, and treaties drafted by parliaments relying on collective deliberation and democratic procedures. What makes central banks so powerful is their ability to act extremely rapidly. In the fall of 2008, no other institution could have mobilized such massive resources in so short a time. In a financial panic, war, or extremely serious natural catastrophe, monetary creation is the only way for public authorities to act quickly on the scale required. Taxes, budgets, laws, and treaties require months of deliberation, to say nothing of the time required to assemble the necessary political majorities to support them; this may require new elections, with no guarantee of the outcome.
If the ability to act quickly is the strength of central banks, it is also their weakness: they lack the democratic legitimacy to venture too far beyond their narrow sphere of expertise in banking and finance. In the abstract, there is nothing to stop central banks from enlarging their balance sheets by a factor of ten or even more. Recall, for example, that total private wealth (comprising real estate and professional and financial assets, net of debt) in the hands of households in the 2010s was roughly 500–600 percent of national income in most of the rich countries (compared with barely 300 percent in the 1970s).93 From a strictly technical standpoint, the Fed or the ECB could create dollars or euros worth 600 percent of GDP and attempt to buy all the private wealth of the United States or Western Europe.94 But this would raise serious issues of governance: central banks and their boards of governors are no better equipped to administer all of a country’s property than were the Soviet Union’s central planners.
Neo-Proprietarianism and the New Monetary Regime
Without going quite that far, it is entirely possible that central bank balance sheets will continue to grow in the future, particularly in the event of a new financial crisis. It bears emphasizing that the financialization of the economy has attained phenomenal proportions in recent decades. In particular, the extent of cross-firm and cross-country financial holdings has increased significantly more rapidly than the size of the real economy and net capital. In the Eurozone, the total value of the financial assets and liabilities of the various institutional actors (financial and nonfinancial firms, households, and government) amounted to more than 1,100 percent of GDP in 2018 compared with barely 300 percent in the 1970s. In other words, even if the ECB balance sheet is now 40 percent of Eurozone GDP, this amounts to only 4 percent of the financial assets in circulation. In a sense, central banks have simply adapted to rampant financialization, and the increase in the size of their balance sheets has simply allowed them to maintain a certain capacity for action on the prices of financial assets, which has increased their tentacular reach many times over. If circumstances require, the ECB and Fed could be forced to go even farther. Indeed, the Bank of Japan and the Swiss National Bank both have balance sheets in excess of 100 percent of GDP (Fig. 13.14). This has to do with the peculiarities of each country’s financial situation.95 It is nevertheless impossible to rule out that similar things will someday happen to the Eurozone or the United States. Financial globalization has assumed such proportions that it may lead those responsible for setting monetary policy step by step toward decisions that would have been unthinkable only a few years before.
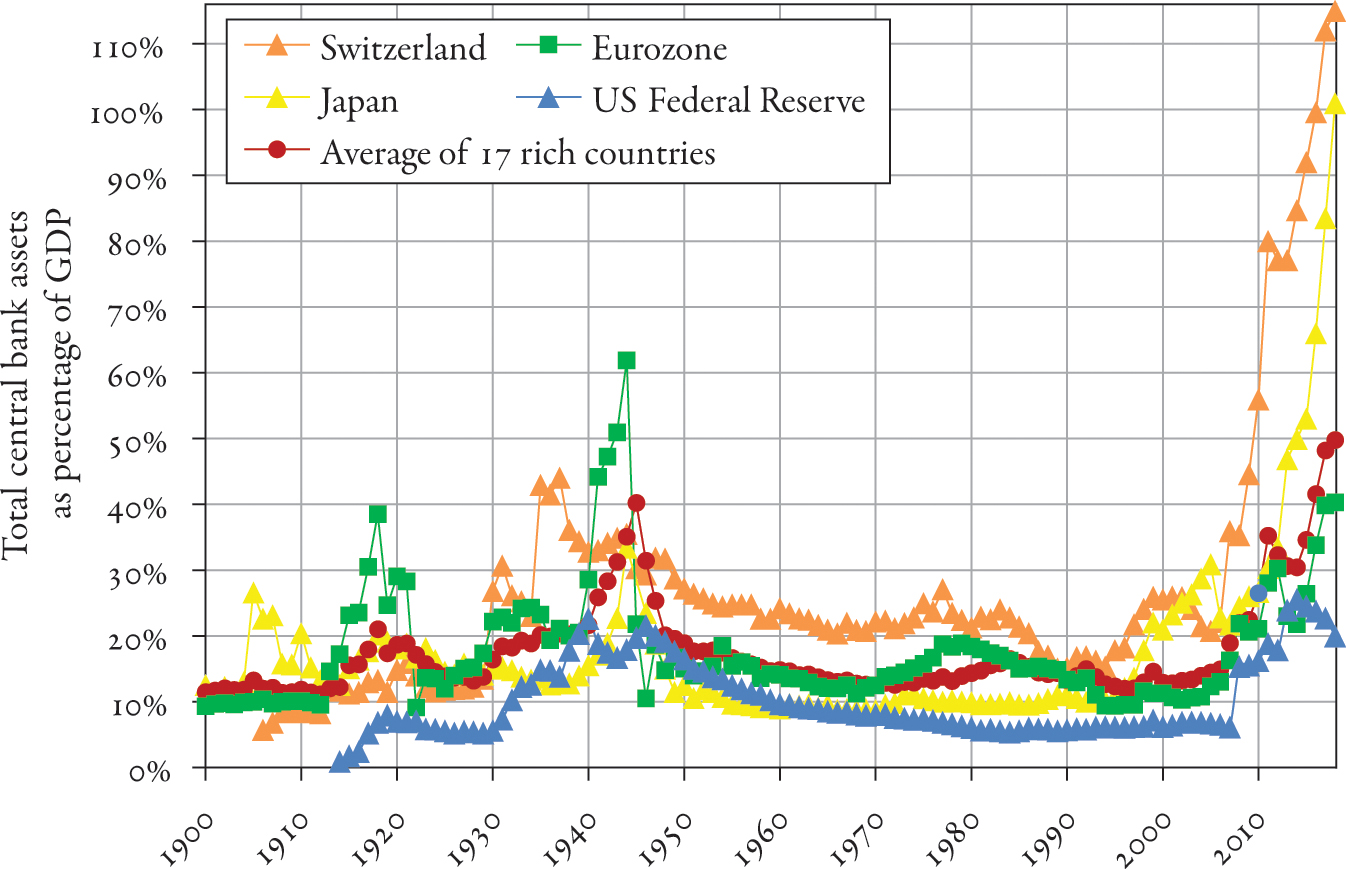
FIG. 13.14. Central banks and financial globalization
Interpretation: Total central bank assets of the rich countries rose from 13 percent of GDP on average on the last day of 2000 to 51 percent on the last day of 2018. The central bank assets of Japan and Switzerland exceeded 100 percent of GDP in 2017–2018. Note: The rich country average includes Australia, Belgium, Canada, Denmark, Finland, France, Germany, Holland, Italy, Japan, Norway, Portugal, Spain, Sweden, Switzerland, the United Kingdom, and the United States. Sources and series: piketty.pse.ens.fr/ideology.
These changes pose numerous problems, however. First, the real priority should no doubt be to reduce the size of private balance sheets rather than engage in a race to keep up with them. A situation in which all economic actors are to some degree indebted to one another and in which the total size of the financial sector (assets and liabilities combined) is growing faster than the real economy cannot continue forever; it leaves both economy and society in a very fragile state.96
Second, the long-term real effects of these “unconventional” monetary policies are not well understood, and it is quite possible that they will increase the inequality of financial returns and the concentration of wealth. When central bank balance sheets attained comparable heights (of 40–90 percent of GDP) in the aftermath of World War II, the creation of such large volumes of money coincided with significant inflation. Economies then became trapped in wage-price spirals, to which governments contributed by increasing public-sector wages; this inflationary process helped to reduce the value of public debt to virtually nothing, which encouraged investment and accelerated postwar reconstruction.97 Nothing like this is true in the current period. Wages are virtually frozen in both the public and private sector, and consumer price inflation has been extremely low since the crisis of 2008, especially in the Eurozone (where inflation is barely 1 percent a year); it would very likely have turned negative without monetary intervention.
Although monetary creation has not increased consumer prices, it has contributed to the increase of certain asset prices while at the same time creating large “spreads” (differences in the yield of similar assets). Indeed, the nominal interest rates on German and French public debt is close to zero, and real rates are negative. This is partly due to the fact that the ECB has bought so much public debt to try to reduce the spreads between the sovereign debt of different countries. In addition, new prudential rules require that a substantial portion of each bank’s capital must consist of safe assets. Finally, many global financial actors use the sovereign debt of Western countries as safe reserves, which they think they need in a general climate of fear in which every country is afraid that it might become the target of a financial panic (and therefore wants to keep extra reserves on hand, just in case).
In a sense, one might say that these near-zero rates reflect a situation where it is impossible to “get rich while sleeping” (at least with very safe assets). This marks a sharp difference from the past and from the classic proprietarianism of the nineteenth century and the era of the gold standard when the real return on public debt was generally 3–4 percent (albeit with a decrease in the decades before 1914 due to overaccumulation of capital, which led to a frenetic search for higher yields abroad or in the colonies). Today, interest rates on sovereign debt are close to zero, but this does not mean however that everyone is earning zero return on capital. In practice, it is small and medium savers who are earning near-zero (or negative) returns on their bank accounts, while larger investors with better information about the movements of certain asset prices (sometimes caused by central banks but even more by swollen private balance sheets) still manage to make gains. For example, the returns on large endowments (such as those of universities) and the growth rates of the biggest fortunes seem not to have been affected by the near-zero returns on safe sovereign debt: both seem to be growing at rates on the order of 6–8 percent a year, partly thanks to sophisticated financial products not available to smaller investors.98
Last but not least, this monetary activism attests to the many roadblocks that governments face in other policy areas such as financial regulation, taxes, and budgets. This is true in the United States, where the structure of partisan conflict and a dysfunctional Congress have made it increasingly difficult to pass laws or even just to agree on a budget (hence the repeated shutdowns of the federal government). It is still more obvious in Europe, whose federal institutions are even more dysfunctional than those of the United States. Given the impossibility of agreeing on even a minimal common budget (because each EU member state has veto power), the EU’s capacity for action is quite limited. The EU budget is approved by unanimous vote of the European Council for a period of seven years, with a concurring majority vote by the European Parliament. Funds are drawn primarily from member states, which pay in proportion to their gross national income. The annual EU budget for the period 2014–2020 amounts to just 1 percent of EU GDP.99 By contrast, member-states’ budgets amount to 30–50 percent of GDP, depending on the country. The US federal budget is 20 percent of GDP, compared with less than 10 percent for individual states and other local governments.100
To recapitulate: The European Union is a financial midget, paralyzed by the unanimity rule in tax and budget matters. The ECB is therefore the only powerful federal institution in Europe. It can take decisions by a simple majority vote, and it was on this basis that it increased the size of its balance sheet by nearly 30 percent of European GDP between 2008 and 2018. In other words, the ECB created every year on average a volume of money equal to almost 3 percent of European GDP, which is nearly three times the total budget of the EU. These figures clearly indicate the importance of the political and institutional regime in determining economic and financial dynamics. More than that, they show the extent to which the swelling of the money supply is due to fear of democracy and just taxation. What this means is that because European governments cannot agree on common taxes, a common budget, a common debt, and a common rate of interest—which would require an EU governed by a democratic parliament rather than by the mere agreement among heads of state that for the time being takes the place of authentic governance—the ECB’s Governing Council is called upon to solve problems for which it does not have the tools.
This loss of direction is worrisome and cannot last very long. Even though monetary policy is supposedly a technical matter beyond the understanding of ordinary citizens, the amounts involved are so huge that they have begun to alter perceptions of the economy and finance. Many citizens have quite understandably begun to ask why such sums were created to bail out financial institutions, with little apparent effect in jump-starting the European economy, and why it shouldn’t be possible to mobilize similar resources to help struggling workers, develop public infrastructure, or finance large investments in renewable sources of energy. Indeed, it would by no means be absurd for European governments to borrow at current low interest rates to finance useful investments, on two conditions: first, such investments should be decided democratically, in parliament with open debate, and not by a Governing Council meeting behind closed doors; and second, it would be dangerous to lend credence to the notion that every problem can be resolved by printing money and taking on debt. The principal instrument for mobilizing resources to undertake common political projects was and remains taxation, democratically decided and levied on the basis of each taxpayer’s economic resources and ability to pay, in total transparency.
In July 2013, the British rock band Muse gave a concert at the Olympic Stadium in Rome. The title song, “Animals,” explicitly referred to the fact that “quantitative easing” was invented to save the bankers. The lead singer, Matt Bellamy, alluded to the “masters of the universe” who speculate on the lives of ordinary people. He dedicated the song “to all the Fred Goodwins of the world” (referring to the banker deemed responsible for the failure of the Royal Bank of Scotland in 2008 but who nevertheless left the bank with a golden parachute). At that moment a terrifying-looking banker took the stage and began distributing banknotes to the crowd. As the singer explained in an interview, “We don’t take a stance, we express the confusion of our time.”101 And the confusion is indeed considerable. Quantitative easing and the bloating of the financial sector avoided the fundamental issues and encouraged people to give up hope of any possibility of achieving a just economy. This is one of the principal contradictions of today’s neo-proprietarian regime. It is urgent to move beyond it.
Neo-Proprietarianism and Ordoliberalism: From Hayek to the EU
To review: Today’s neo-proprietarian ideology relies on grand narratives and solid institutions, including the story of communism’s failure, the “Pandorian” refusal to redistribute wealth, and the free circulation of capital without regulation, information sharing, or a common tax system. Nevertheless, it is also important to bear in mind that this political-ideological regime has many weaknesses, or to put it the other way around, there are many forces pushing to change and to overcome it. Financial opacity and rising inequality significantly complicate the response to the challenge of climate change. More generally, they give rise to social discontent, to which the only solution is greater transparency and more redistribution, without which identitarian tensions will grow increasingly strong. Like all inegalitarian regimes, this one is unstable and evolving.
Broadly speaking, I think it is important not to overestimate the internal coherence of neo-proprietarianism and its political-ideological matrix, especially in the context of the European Union. It is commonplace to associate the EU with ordoliberalism, a doctrine according to which the essential role of the state is to guarantee the conditions of “free and undistorted” competition, or with the constitutional and consciously authoritarian liberalism of Friedrich von Hayek. Indeed, the circumvention of parliamentary democracy, government by automatic rules, and the principle that all member states must unanimously agree on fiscal matters (which de facto prevents any common tax system) all betray an obvious kinship with ordoliberal and Hayekian ideas. Still, I think it is important to place these influences in context and not to exaggerate the intellectual or political consistency of the European construct, which is a product of many intersecting influences and not the result of a fixed, preconceived plan. The institutional and political-ideological structure of the EU is still largely unfinished. It may take any of a number of different paths in the future, and it could reconstitute itself in concentric circles or around a number of separate nuclei with greater or lesser degrees of political, social, and fiscal integration; what happens will be determined by power relations; social, political, and financial crises; and the debates that take place in the meantime.
To see what differentiates the present-day European Union (or, more generally, today’s world) from systematic and consistent neo-proprietarianism, it may be useful to look at the treatise that Hayek published between 1973 and 1982 entitled Law, Legislation and Liberty, which is perhaps the clearest statement of triumphant self-conscious proprietarianism.102 Recall that we encountered Hayek earlier in connection with the debates of 1939–1940 about a proposal for a Franco-British union and the Federal Union movement, as well as in connection with his book The Road to Serfdom (1944), in which he warned against the risk of totalitarianism inherent, in his view, in any project based on the illusion of social justice and departing from the principles of liberalism pure and simple. His critique was aimed at the British Labour and Swedish Social Democratic parties of the day, which he suspected of seeking to undermine individual liberties. In retrospect this may come as a surprise, since Hayek would later become an active supporter of General Augusto Pinochet’s ultra-liberal military dictatorship in Chile in the 1970s and 1980s (while also supporting and serving as an adviser to Margaret Thatcher’s government in the United Kingdom). Reading Law, Legislation and Liberty (hereafter abbreviated as LLL) is an instructive exercise because it sheds light on the overall coherence of Hayek’s thought. After moving to London in 1931, Hayek joined the faculty of the University of Chicago in 1950 (the temple of the “Chicago Boys,” the young economists who would later advise the Chilean dictator). In 1962 he returned to Europe, where he taught at the University of Freiburg (the historic home of ordoliberalism) and the University of Salzburg until his death in 1992 at the age of 93. In the 1950s, he turned his attention to political and legal philosophy, from which he mounted his defense of what he then considered to be the threatened values of economic liberalism.
In LLL Hayek clearly expresses the proprietarian fear of redistribution of any kind: if one begins to question existing property rights or gets caught up in the works of progressive taxation, it will be impossible to know where to stop. Hayek credits the Florentine historian and statesman Francesco Guicciardini, responding in 1538 to a proposed progressive tax, with being the first to state this “Pandorian” idea clearly and the first to dismiss out of hand the whole idea of progressive taxation. Alarmed by the marginal rates in excess of 90 percent then being levied in the United States and United Kingdom and convinced that the final victory of collectivism was near, Hayek had already proposed in an earlier work that the very idea of progressive taxation should be constitutionally prohibited. According to his proposal, the tax rate on the highest incomes in any given country should not exceed the average overall tax rate, which was equivalent to saying that the tax system could be regressive (with a lower rate on top incomes than on the rest of the population) but certainly not progressive.103 In general, Hayek was convinced that liberalism had taken a wrong turn in the eighteenth and nineteenth centuries by entrusting so much legislative power to elected parliaments, to the detriment of rights (especially property rights) established in the past. He opposed constructivist rationalism, which claimed to be able to redefine rights and social relations ex nihilo, and defended evolutionary rationalism, based on respect for preexisting rights and social relations. He insisted that “law precedes legislation” and that neglect of this wise principle almost inevitably leads to the emergence of a “supreme legislator” and therefore to totalitarianism.104
In the final volume of LLL, he pushes this argument still further by proposing an entirely new basis for parliamentary democracy, which would drastically limit the power of any future political majority. He envisioned a vast federal politics based on strict respect for property rights. To be sure, “governmental assemblies” could be elected at the local level on the basis of universal suffrage, with the proviso that civil servants, retirees, and more generally, anyone receiving transfers of public funds should be denied the right to vote. Importantly, the sole power of these assemblies would be to administer state services at the local level; they would not be allowed to modify the legal system, which is to say property rights, civil or commercial law, or the tax code, in any way. Such fundamental and quasi-sacred laws should be decided, Hayek argued, by a competent “legislative assembly” at the federal level, whose membership should be decided in such a way that it would not be subject to the whims of universal suffrage. In his view, this supreme assembly should consist of persons aged 45 or over, chosen to serve fifteen-year terms after having demonstrated their abilities and professional success. He seems to have hesitated about the wisdom of explicitly reintroducing property qualifications for voting, eventually opting instead for a strange formula involving election by professional clubs “such as Rotary Clubs,” where wise men would be able to mingle regularly before electing the wisest of them above the age of 45. The Supreme Court, made up of former members of this assembly, would have full power to arbitrate conflicts of competence among local governmental assemblies and to declare a state of emergency in case of social unrest.105 The overall goal was clearly to reduce to a minimum the power of universal suffrage and its caprices and in particular to muzzle youth, with its socialistic fantasies, which Hayek found particularly troubling in the climate of the 1970s, not only in Chile but also in Europe and the United States.106
Hayek’s position is interesting as an illustration of an extreme version of neo-proprietarianism and its contradictions. At bottom, the only regime fully consistent with proprietarianism is the censitary regime (that is, a regime in which political power is explicitly vested in property owners, who are said to be the only people with the wisdom and capacity to see into the future and legislate responsibly). Hayek demonstrates a certain imagination in arriving at the same result without explicitly invoking property qualifications for voting, but that is what he really has in mind. What separates the European Union as an institutional and political-ideological construct from Hayek’s avowed neo-proprietarianism should also be clear. The institutions of the EU can and should be deeply transformed, and in particular the rule of unanimity on fiscal matters should be abolished. To achieve this, however, we must stop thinking of Europe as a coherent and invincible ordoliberal or neo-proprietarian conspiracy and view it instead as an unstable, precarious, and evolving compromise. More specifically, the European Union is still searching for a parliamentary form appropriate to its history. The rule of unanimity on fiscal matters is unsatisfactory. Although it is true that the heads of state and finance ministers who sit on the key European councils are ultimately designated through the process of universal suffrage, giving each of them veto power leads to perpetual blockage. Yet moving to qualified majority voting and strengthening the power of the European Parliament (the traditional federalist solution) does not solve all the problems—far from it. I will come back to this (see esp. Chapter 16).
The Invention of Meritocracy and Neo-Proprietarianism
The neo-proprietarianism that has emerged over the past several decades is a complex phenomenon; it is not merely a return to the proprietarianism of the nineteenth and early twentieth centuries. In particular, it is linked to an extreme form of meritocratic ideology. Meritocratic discourse generally glorifies the winners in the economic system while stigmatizing the losers for their supposed lack of merit, virtue, and diligence. Of course, meritocracy is an old ideology, on which elites in all times and places have always relied in one way or another to justify their dominance. Over time, however, it has become increasingly common to blame the poor for their poverty. This is one of the principal distinctive features of today’s inequality regime.
For Giacomo Todeschini, the idea of “the undeserving poor” can be traced back to the Middle Ages and perhaps more generally to the end of slavery and forced labor and the outright ownership of the poor classes by the wealthy classes. Once the poor man became a subject and not simply an object, it became necessary to “own” him by other means and specifically in the realms of discourse and merit.107 This new vision of inequality, which became commonplace, may have been related to another medieval innovation studied by Todeschini: the invention of new forms of ownership and investment and their validation by Christian doctrine.108 In other words, these two aspects of “modernity” may be correlated: once the rules of the economy and property become subordinated to principles of justice, the poor become responsible for their own fate, and they must be made to understand this.
Nevertheless, as long as the proprietarian order was built first upon the trifunctional regime and later upon the censitary regime, meritocratic discourse played a limited role. With the advent of the industrial age and the new threats to the elite posed by class struggle and universal suffrage, the need to justify social differences on the basis of individual abilities became more pressing. For instance, in 1845, Charles Dunoyer, a liberal economist and prefect under the July Monarchy, wrote a book entitled On the Freedom of Labor, in which he vigorously opposed all obligatory social legislation: “The effect of the industrial regime is to destroy artificial inequalities, but only in order to highlight natural inequalities.” For Dunoyer, these natural inequalities included differences of physical, intellectual, and moral capabilities; they were at the heart of the new innovation economy that he saw wherever he looked and justified his rejection of state intervention: “Superiorities are the source of everything great and useful. Reduce everything to equality and you will have reduced everything to inaction.”109
But it was above all when the era of higher education began that meritocratic ideology assumed its full proportions. In 1872, Émile Boutmy founded the École Libre des Sciences Politiques, to which he ascribed a clear mission: “Obliged to submit to the law of the majority, the classes that call themselves superior can preserve their political hegemony only by invoking the law of the most capable. Because the walls of their prerogatives and tradition are crumbling, the democratic tide must be held back by a second rampart made up of brilliant and useful merits, of superiority whose prestige commands obedience, of capacities of which it would be folly for society to deprive itself.”110 This incredible statement deserves to be taken seriously: it means that it was the survival instinct of the upper classes that led them to abandon idleness and invent meritocracy, without which they ran the risk of being stripped of their possessions by universal suffrage. No doubt the climate of the times played a part: the Paris Commune had just been put down, and universal male suffrage had just been restored. In any case, Boutmy’s statement deserves credit for pointing out an essential truth: it is a matter of vital importance to make sense of inequality and to justify the position of the winners. Inequality is above all ideological. Today’s neo-proprietarianism is all the more meritocratic because it can no longer be explicitly censitary, unlike the classical proprietarianism of the nineteenth century.
In The Inheritors (1964; English edition 1979), Pierre Bourdieu and Jean-Claude Passeron analyzed the way in which the social order was legitimized by the higher educational system of that time. In the guise of individual “merit” and “talent,” social privilege was perpetuated because disadvantaged groups lacked the codes and other keys to social recognition. The number of students in higher education had exploded, and educational credentials had begun to play a growing role in the structure of social inequality. But the lower classes were almost totally excluded: less than 1 percent of the children of farmworkers attended college compared with 70 percent of the children of factory managers and 80 percent of the children of independent professionals. An openly segregationist system, like the one that was beginning to disappear in the United States in 1964 when The Inheritors was originally published, could hardly have been more exclusionary than this; except the cultural and symbolic domination that one saw in France was portrayed as the result of free choice, where everyone theoretically enjoyed equal opportunities. That is why Bourdieu and Passeron preferred to compare the French system to the system of reproduction of the wizard caste among the Omaha tribe studied by anthropologist Margaret Mead, where young men of any background were presumably free to try their luck. They were then required “to withdraw into solitude, fast, return and recount their visions to the elders, only to be told, if their families did not belong to the elite, that their visions were not authentic.”111
The issue of educational injustice and meritocratic hypocrisy has only gained in importance since the 1960s. Access to higher education has expanded significantly but remains highly stratified and inegalitarian, and there has been no serious investigation of the resources actually allocated to different groups of students or to pedagogical reforms that might provide more authentic equality of access. In the United States, France, and most other countries, the praise heaped on the meritocratic model is rarely based on close examination of the facts. The goal is usually to justify existing inequalities with no consideration of the sometimes glaring failures of the existing system or of the fact that lower- and middle-class students do not have access to the same resources or courses as the children of the upper classes.112 In Part Four we will see that educational inequality is one of the main causes of the disintegration of the “social-democratic” coalition over the past few decades. Socialist, Labour, and social-democratic parties have gradually come to be seen as increasingly favorable to the winners in the educational contest while they have lost the support they used to enjoy among less well-educated groups in the postwar period.113
It is interesting to note that the British sociologist Michael Young warned against just such developments as long ago as 1958. After helping to draft and enact the Labour platform of 1945, he became estranged from the party in the 1950s because it had failed, in his view, to push its program forward, particularly in regard to education. One thing that particularly worried Young was the extreme stratification of the British system of secondary education. He published an astonishingly prescient work entitled The Rise of the Meritocracy, 1870–2033: An Essay on Education and Equality.114 He imagined a British (and global) society increasingly stratified on the basis of cognitive capacity, closely (but not exclusively) related to social origins. In his book the Tories have become the party of the highly educated and have restored the power of the House of Lords thanks to the new domination of intellectuals. Labour has become the party of “Technicians,” which must contend with the “Populists.” The latter consists of the lower classes, furious at having been relegated to the socioeconomic backwaters in a world where science has decreed that only a third of the population is employable. The Populists cry in vain for educational equality and unification of the school system through “comprehensive schools” offering equal training and equal resources to all young Britons. But the Tories and Technicians join forces to reject their plea, having long since given up any egalitarian ambitions. The United Kingdom ultimately succumbs to a populist revolution in 2033. There the story ends, because the sociologist-reporter who is recounting the tale is killed in the violent riots that ravage the country. Young himself died in 2002, too early to see his fiction overtaken by reality, but he was wrong on at least one point: in the first two decades of the twenty-first century it was Labour, not the Tories, that became the preferred party of the well educated.115
From the Philanthropic Illusion to the Sacralization of Billionaires
Today’s meritocratic ideology glorifies entrepreneurs and billionaires. At times this glorification seems to know no bounds. Some people seem to believe that Bill Gates, Jeff Bezos, and Mark Zuckerberg single-handedly invented computers, books, and friends. One can get the impression that they can never be rich enough and that the humble people of the earth can never thank them enough for all the benefits they have brought. To defend them, sharp lines are drawn between the wicked Russian oligarchs and the nice entrepreneurs from Seattle and Silicon Valley, while all criticism is forgotten: their quasi-monopolistic behavior is ignored as are the legal and tax breaks they are granted and the public resources they appropriate.
Billionaires are such fixtures of the contemporary imagination that they have entered into fiction, which fortunately maintains more ironic distance than do the magazines. In Destiny and Desire (2008), Carlos Fuentes paints a portrait of Mexican capitalism and its attendant violence. We meet a cast of colorful characters, including a president who sounds like an ad for Coca-Cola but is ultimately a pitiful political timeserver whose power is risible compared with the eternal power of capital, embodied in an omnipotent billionaire who strongly resembles the telecommunications magnate Carlos Slim, the richest man not only in Mexico but also in the world from 2010 to 2013 (ahead of Bill Gates). Two young people hesitate between resignation, sex, and revolution. They end up being murdered by a beautiful, ambitious woman who covets their inheritance and who has no need of a Vautrin to tell her what she needs to do to get it—proof, if proof were needed, that violence has been cranked up a notch since 1820. Inherited wealth, coveted by all who are born outside the privileged family circle but destructive of the personalities of those born within it—is at the heart of the novelist’s meditation. The book occasionally alludes to the baleful influence of the gringos, the Americans who own “thirty percent of Mexico” and make inequality even harder to bear.
In L’empire du ciel (Heaven’s Empire), a novel published in 2016 by Tancrède Voituriez, a Chinese billionaire has an ingenious idea for changing the climate. By taking a few thousand feet off the top of the Himalayas, he can arrange for the Indian monsoon to waft over China and get rid of the nasty shroud of pollution hanging over Beijing. Communists or not, billionaires think that anything goes, are enamored of geoengineering, and detest nothing so much as simple but unpleasant solutions (such as paying taxes and living quietly).116 In All the Money in the World (TriStar Pictures, 2017), Ridley Scott portrays J. Paul Getty, the world’s richest man in 1973 and so stingy that he is willing to run the risk that the Italian mafia will cut off his grandson’s ear rather than pay a large ransom (even with a tax deduction). The film showed a billionaire so petty and antipathetic that today’s moviegoers, used to seeing wealth celebrated and entrepreneurs depicted as amiable and deserving, felt somewhat embarrassed by it.
Several factors help to explain the force of today’s ideology. As always, there is fear of the void. If one accepts the idea that Bill, Jeff, and Mark could be happy with $1 billion each (instead of their $300 billion joint net worth) and would no doubt have lived their lives in exactly the same way even if they had known in advance that this was as rich as they would get (which is quite plausible), then some will ask, “But where does it end?” Historical experience shows that such fears are exaggerated: redistribution can be done in a methodical, disciplined way. But the lessons of history are of no avail: some people will always remain convinced that it is too risky to open Pandora’s box. The fall of communism is also a factor. The Russian and Czech oligarchs who buy athletic teams and newspapers may not be the most savory characters, but the Soviet system was a nightmare and had to go. Nevertheless, people are increasingly aware that the influence of billionaires has grown to proportions that are worrisome for democratic institutions, which are also threatened by the rise of inequality and “populism” (to say nothing of the riots Michael Young anticipated for 2033).
Another important factor contributing to the legitimation of billionaires is what one might call the philanthropic illusion. Because the state and its tax revenues have grown since the 1970s-1980s to unprecedented size, it is natural to think that philanthropy (altruistic private financing in the public interest) ought to play an increased role. Indeed, precisely because of the size of the government, it is legitimate to demand greater transparency about what taxes are levied and how the revenues are spent. In many sectors, such as culture, media, and research, it may be a good idea to have mixed public and private financing channeled through a decentralized network of participatory organizations. The problem is that philanthropic discourse can be deployed as part of a particularly dangerous anti-state ideology. This is especially true in poor countries, where philanthropy (and in some cases foreign aid from rich countries) can be a means of circumventing the state, which contributes to its pauperization. The fact is that in poor countries the state is anything but omnipotent. In most cases, its tax revenues are extremely limited and indeed quite a bit smaller than the revenues that the rich countries enjoyed when they were developing.117 For the billionaire or even the less well-endowed donor, it may be pleasant to be in a position to set a country’s priorities in health care and education. Still, nothing in the history of the rich countries suggests that this is the best method of development.
Another point about the philanthropic illusion is that philanthropy is neither participatory nor democratic. In practice, giving is extremely concentrated among the very wealthy, who often derive significant tax advantages from their gifts. In other words, the lower and middle classes subsidize through their taxes the philanthropic preferences of the wealthy—a novel form of confiscation of public goods and control derived from wealth.118 A different model might be better. If citizens could participate equally in a collective social process of defining the public good along the lines of the egalitarian model of political party financing that I discussed earlier, it might be possible to move beyond parliamentary democracy.119 Along with educational equality and widespread ownership of property, this will figure in the discussion of participatory socialism that I will present in Chapter 17.
2. See Figs. 10.1–10.5.
5. See also L. Assouad, L. Chancel, and M. Morgan, “Extreme Inequality: Evidence from Brazil, India, the Middle East and South Africa,” WID.world, 2018; also published in AEA Papers and Proceedings, 2018.
6. See Chaps. 6–7. On the long-term impact of slavery on inequality in Brazil, see T. Fujiwara, H. Laudares, and F. Valencia, “Tordesillas, Slavery and the Origins of Brazilian Inequality” (working paper, February 25, 2019), https://
economics .ucdavis .edu /events /papers /copy _of _416Valencia .pdf. 7. See Chaps. 10–11. I will come back to this in Part 4 (esp. Chap. 15).
8. The Middle East is defined here as the region stretching from Egypt to Iran and from Turkey to the Arabian Peninsula, with a population of about 420 million. For a detailed presentation of these estimates, see F. Alvaredo, L. Assouad, and T. Piketty, “Measuring Inequality in the Middle-East 1990–2016: The World’s Most Unequal Region?” WID.world, 2018; also published in Review of Income and Wealth, 2019.
9. See T. Piketty, Capital in the Twenty-First Century, trans. A. Goldhammer (Harvard University Press, 2014), pp. 537–538.
11. See Fig. 12.5. Note that wealthy people who live in authoritarian inequality regimes without progressive taxes must still worry about possible shifts in public opinion and the sociopolitical balance of power. In 2017 the Saudi heir apparent, Crown Prince Mohammed bin Salman, imprisoned the leading Saudi billionaires (including members of the royal family and the prime minister of Lebanon) in the Riyadh Ritz-Carlton and stripped them of their property, a reminder that even in these proprietarian regimes, there are always factions contending for power.
12. See Alvaredo, Assouad, and Piketty, “Measuring Inequality in the Middle-East,” figs. 9a–9b, and the online appendix. On inequality in slave and colonial societies, see Figs. 7.2–7.3.
13. There have been attempts to redraw borders and build new state structures but thus far only in the form of Saddam Hussein’s expansionary authoritarian dictatorship (1990–1991) and the attempt by the so-called Islamic State (ISIS) to restore the caliphate with all its ancient militaristic and misogynistic brutality (2014–2019).
15. See the discussion in the Introduction. Initially launched by researchers in the early 2000s, the WID.world network now encompasses some one hundred researchers in more than seventy countries on all continents and works closely with many other centers and organizations specialized in the study of inequality such as the Center for Economic Growth, the Commitment to Equality, the Luxembourg Income Study, and the United Nations Development Programme. See F. Alvaredo et al., World Inequality Report 2018 (Harvard University Press, 2018); also available online at https://
wir2018 .wid .world /. 16. Figs. 13.2–13.6 reflect income including pensions and unemployment insurance (after deduction of related taxes) but before other transfers and direct or indirect taxes. Accounting for other taxes and transfers reduces inequality by 20–30 percent (as measured, for instance, by the ratio between the top decile and bottom 50 percent shares) in Europe and the United States. See Fig. 11.9. There is less tax-driven redistribution in South Africa or the Middle East (where inequality would be reduced by less than 10 percent or perhaps not at all, given the lack of progressive taxes and the preponderance of indirect taxes), which would increase the intercountry differences in Figs. 13.5–13.6. See the online appendix.
17. See Piketty, Capital in the Twenty-First Century, pp. 266–269.
19. The percentile and decile data presented in this book can of course be used to calculate Gini coefficients, which are also given in the WID.world database, even though they are less expressive than the decile and centile shares. By contrast, from Gini coefficients alone one cannot derive decile and centile data (which are often not published in analyses based on the Gini coefficient or similar coefficients and indices, such as the Theil index).
20. These ratios, sometimes designated as P90/P50 or P90/P10, would therefore be equal to one (suggesting complete equality) in a society in which the top 5 percent claimed all income or wealth while the bottom 95 percent were all approximately equal.
21. On the case of India, see L. Chancel and T. Piketty, “Indian Income Inequality 1922–2015: From British Raj to Billionaire Raj?” WID.world, 2017. India stands out for having completely ceased to publish fiscal statistics from 2002 to 2016 at the height of the “information age.” On Brazil, see M. Morgan, “Falling Inequality Beneath Extreme and Persistent Concentration: New Evidence on Brazil Combining National Accounts, Surveys and Fiscal Data, 2001–2015,” WID.world, 2017. This work has revealed strong growth in top income shares in recent years. In the case of the United States, the use of tax data has demonstrated the historic rise of inequality in recent decades. See T. Piketty and E. Saez, “Income Inequality in the U.S., 1913–1998,” Quarterly Journal of Economics, 2003; T. Piketty, E. Saez, and G. Zucman, “Distributional National Accounts: Methods and Estimates for the United States,” Quarterly Journal of Economics, 2018.
22. See L. Assouad, “Rethinking the Lebanese Economic Miracle: The Concentration of Income and Wealth in Lebanon 2005–2014,” WID.world, 2017; L. Czajka, “Income Inequality in Cote d’Ivoire 1985–2014,” WID.world, 2017; R. Zighed, “Income Inequality in Tunisia 2003–2016,” WID.world, 2018.
23. By “official” measures I mean measures published by government statistical agencies. I should note explicitly that blame for the resulting lack of transparency lies with the political authorities and the flaws in available tax data; it is not the fault of the people working for these statistical agencies, who are often the first to demand better access to the sources.
24. National income is also called “net national product” or “net national income” (as opposed to “gross national product” or “gross national income,” which takes foreign income into account but does not deduct consumption of capital). For a brief history of these terms and of national accounting, see Piketty, Capital in the Twenty-First Century, chap. 1. National income per capita corresponds to average income before taxes and transfers. It is also equal to average income after taxes and transfers if one considers public expenditures on education, health, and so on as transfers in kind.
25. This is only the most serious problem; there are others about which I do not have the space to elaborate here. In particular, the question of the boundary between private household consumption and so-called intermediate consumption by firms (which in practice can be used as additional private consumption and is not taken into account in the calculation of national income or inequality, even though the phenomenon can assume massive proportions at the top of the distribution) might deserve much more attention in the future. It is quite possible that this bias leads to significantly underestimating inequality.
26. This upward trend is observed in all regions, especially in the rich countries. See T. Blanchet and L. Chancel, “National Accounts Series Methodology,” WID.world, 2016, fig. 2.
27. By definition, net national income from and to other countries balances out at the global level (provided that one includes flows passing through tax havens). In practice, these net foreign income flows (which are primarily flows of capital income and secondary flows of income form temporary labor abroad) are less important than depreciation: they are generally between −2 and +2 percent of GDP, and usually between −1 and +1 percent. There are, however, countries where so much of the capital is owned by foreign investors that the outflows are larger: 5–10 percent of GDP or even more (these are usually poor countries, in sub-Saharan Africa, for example). They may also be countries that relied heavily on foreign investment, such as Ireland, where the outflow exceeds 20 percent of GDP, and, by contrast, countries where inflows can go as high as 5–50 percent of GDP, such as France and the United Kingdom in the Belle Époque or oil-exporting countries such as Norway today. See the online appendix.
28. For a capital stock on the order of 500 percent of GDP, a consumption of fixed capital of 10 percent corresponds to an average depreciation of 2 percent per year, while a consumption of fixed capital of 15 percent per year corresponds to an average depreciation of 3 percent per year. In practice, depreciation varies considerably with asset type: it may be less than 1 percent a year for buildings or warehouses and more than 20–30 percent a year for certain types of machinery.
29. Net annual extractions can go as high as 10–20 percent of GDP for petroleum-exporting countries and many poor countries (especially in Africa). See the online appendix for the available series and associated uncertainties. See also E. Barbier, “Natural Capital and Wealth in the 21st Century,” Eastern Economic Journal, 2016; E. Barbier, Nature and Wealth: Overcoming Environmental Scarcity and Inequality (Palgrave, 2015). See also G. M. Lange, Q. Wodon, and K. Carey, The Changing Wealth of Nations 2018: Building a Sustainable Future (World Bank, 2018), p. 66, fig. 2B3.
30. See N. Stern, The Stern Review: The Economics of Climate Change (Cambridge University Press, 2007).
31. See, for example, V. Masson-Delmotte et al., eds., Global Warming of 1.5°C (Intergovernmental Panel on Climate Change [IPCC], 2018), and all the reports of the IPCC/GIEC at www
.ipcc .ch. 32. Using national income instead of GDP was one of the recommendations in J. Stiglitz and Members of a UN Commission of Financial Experts, The Stiglitz Report: Reforming the International Monetary and Financial Systems in the Wake of the Global Crisis (The New Press, 2010), but thus far to no effect.
33. The notion of national wealth accounts (which include stocks of assets and liabilities of various economic actors as opposed to traditional national accounts, which focus on annual flows of output and income) is fairly new and evolving rapidly. It was generalized at the international level by the new System of National Accounts (SNA) standards adopted in 1993 and 2008. It is still being developed in many countries and will evolve in the future as various social, economic, and political actors mobilize. See the online appendix.
35. See the online appendix. See also E. Barbier, “Natural Capital and Wealth in the 21st Century.”
36. See A. Kapczynski, “Four Hypotheses on Intellectual Property and Inequality” (Yale Law School, Working Paper Prepared for the SELA Conference, July 11–14, 2015); G. Krikorian and A. Kapczynski, Access to Knowledge in the Age of Intellectual Property (Zone Press, 2010). See also J. Boyle, “The Second Enclosure Movement and the Construction of the Public Domain,” Law and Contemporary Problems, 2003; D. Koh, R. Santaeulàlia-Llopis, and Y. Zheng, “Labor Share Decline and Intellectual Property Products Capital,” working paper, 2018.
37. For a detailed account of methods and results, see also L. Chancel and T. Piketty, “Carbon and Inequality: From Kyoto to Paris. Trends in the Global Inequality of Carbon Emissions and Prospects for an Equitable Adaptation Fund,” WID.world, 2015. See also L. Chancel, Insoutenables inégalités. Pour une justice sociale et environnementale (Les petits matins, 2017).
38. For results by country, see Chancel and Piketty, “Carbon and Inequality,” table E4.
39. In particular, it would be naïve to think that the balance of power (including its military aspects) will play no role. US president Donald Trump regularly explains that global warming is a fantasy invented to extract a ransom from his country and demands that his “allies” pay a high price for the military shield generously provided by the United States. Nevertheless, the relative importance of the United States (which currently accounts for 4 percent of the world’s population and 15 percent of global GDP) will decline in the decades to come so that economic and commercial rules developed by the rest of the world will become increasingly important.
40. N. Stern and J. Stiglitz, Report of the High-Level Commission on Carbon Prices (Carbon Pricing Leadership Coalition, 2017).
41. In practice, there is major confusion associated with the fact that the carbon tax is supposed to be added to existing taxes on energy (such as the gas tax), which allegedly correct other negative effects of energy usage (such as air pollution and traffic jams). The problem is that all of this is usually fairly opaque and raises suspicions that the government is using the environment as an excuse to raise taxes to finance priorities unrelated to the environment (which unfortunately is frequently the case).
42. In view of observed usage patterns of air travel by country and income group, a proportional tax on air tickets would yield a distribution close to that of a carbon tax applicable only to consumers responsible for more than the global average level of emissions. For a more progressive result, one would have to assess a higher tax on frequent travelers. See Chancel and Piketty, “Carbon and Inequality,” table E4, and the online appendix.
43. Owing to the elimination of the wealth tax (ISF) and its replacement by a real estate tax (IFI). I will say more about this in the next chapter.
44. Another oft-cited example was the exemption for fuel used by international freighters.
45. Recall that the concentration of wealth was very high in Europe throughout the nineteenth century and was even trending upward in the decades before World War I. See Figs. 4.1–4.2 and Figs. 5.4–5.5.
46. The first wave of the Household Finance and Consumption Survey (HFCS) coordinated by the ECB was in 2010 and the second in 2014 (with about 80,000 participating households in various countries).
47. The repository function is sometimes linked to the clearing house function, which is to facilitate secure transactions when assets are bought and sold.
48. On the (difficult but surmountable) technical problems in establishing a Global Financial Register (GFR), see Alvaredo et al., World Inequality Report, pp. 294–298. See also D. Nougayrède, “Towards a Global Financial Register? Account Segregation in Central Securities Depositories and the Challenge of Transparent Securities Ownership in Advanced Economies” (presentation, Columbia Law School Blue Sky workshop, April 2017). See also Piketty, Capital in the Twenty-First Century, pp. 518–524; G. Zucman, The Hidden Wealth of Nations (University of Chicago Press, 2015); T. Pogge and K. Mehta, Global Tax Fairness (Oxford University Press, 2016).
49. For instance, the pre-filled tax statements in use in France since the early 2010s omit interest and dividends on a form of investment called assurance-vie (a long-term financial investment that has been in widespread use in France for decades precisely because it benefits from tax exemptions and has nothing to do with “life insurance” in the usual sense), as long as certain requirements regarding holding duration are met. The rules themselves have varied over time, so that much of the value of this potentially useful source of information is lost.
50. “Dual taxation” of labor and capital income (with a flat rate on capital income) was adopted first in Sweden in 1991 after the banking crisis (see Chap. 11), then in Germany in 2009 and in France in 2018. In practice, these reforms often go along with continued exemptions for certain types of financial incomes (such as the assurance-vie in France).
51. For instance, the German reform of 2009 had the effect of hiding information about capital income and making it very difficult for researchers to gauge the evolution of total (income plus capital) income inequality. On this subject, see C. Bartels and K. Jenderny, “The Role of Capital Income for Top Income Shares in Germany,” WID.world, 2015; C. Bartels, “Top Incomes in Germany, 1871–2014,” WID.world, 2017, also published in Journal of Economic History, 2018.
52. The mixed model has been used by the National Institute of Statistics and Economic Studies in France since 1996 in its so-called ERFS surveys (employment surveys combined with tax data and information on social transfers). The Nordic countries also have a long tradition of using administrative and tax records in their surveys.
53. In France and many other countries, the tax authorities ceased to publish the voluminous statistical bulletins that they had been assiduously publishing since the nineteenth century but no longer considered necessary for their own work because what they needed was stored in their computers. Unfortunately, they neglected the problem of storing those digital records for posterity so that there is paradoxically less information available for the post-1990 period than for previous eras. See the online appendix.
54. It would also be indispensable to release public information on the amounts of taxes actually paid (on assets as well as on asset incomes) by bracket of total wealth holdings. In principle, if automatic transmissions of banking information were adequately enforced, this type of information could be released by each tax administration as well as at the international level.
56. I will return to the subject of central banks (especially the ECB), whose primary function is to ensure the solvency and stability of the banking system and not to influence the distribution of wealth among households. Nevertheless, the actions of the central bank have a profound influence on asset prices and the distribution of wealth, and it is not acceptable to conduct monetary policy with inadequate tools for measuring wealth.
57. See interview with J. C. Juncker, “Le Luxembourg n’avait pas le choix, il fallait diversifier notre économie,” Le Monde, November 28, 2014.
58. See A. Alstadsæter, N. Johannesen, and G. Zucman, “Who Owns the Wealth in Tax Havens? Macro Evidence and Implications for Global Inequality,” Journal of Public Economics, 2018; A. Alstadsæter, N. Johannesen, and G. Zucman, “Tax Evasion and Inequality,” American Economic Review, 2019; A. Alstadsæter, N. Johannesen, and G. Zucman, “Tax Evasion and Tax Avoidance” (University of California, Berkeley, Working Paper, 2019). See also Alvaredo et al., World Inequality Report, fig. 27.1, and G. Zucman, “Global Wealth Inequality,” Annual Review of Economics, 2019, figs. 8–9.
59. For a detailed analysis, see E. Saez and G. Zucman, “Wealth Inequality in the United States since 1913: Evidence from Capitalized Income Tax Data,” Quarterly Journal of Economics, 2016.
60. In particular, various ways of avoiding the estate tax—most notably the use of family trusts and other legal devices for reducing the value of estates or hiding them behind pseudo-philanthropic facades—are tolerated. It may also be that income taxes are more closely monitored because of their importance in financing the federal government.
61. The mortality multiplier method involves weighting inheritance tax data by the inverse of the mortality rate for each age tranche in the analysis, correcting for mortality differentials by class of wealth. The method works less well to the extent that mortality is concentrated in older age cohorts. See the online appendix.
62. The capitalization method involves dividing data on capital income (interest, dividends, and so on) by the average rate of return for the associated asset. This method has the advantage of using available tax data concerning taxpayers with very high capital income (not well captured by household surveys), but it does not do a good job of accounting for differential yields within a given asset class. See the online appendix.
63. For a detailed analysis, see F. Alvaredo, A. Atkinson, and S. Morelli, “Top Wealth Shares in the UK over More Than a Century (1895–2014),” WID.world, 2016. For a meticulous comparison of the results obtained with both methods in the period 1920–1975, see A. Atkinson and A. Harrison, The Distribution of Personal Wealth in Britain (Cambridge University Press, 1978).
64. For a detailed analysis, see B. Garbinti, J. Goupille-Lebret, and T. Piketty, “Accounting for Wealth Inequality Dynamics: Methods and Estimates for France (1800–2014),” WID.world, 2017. Data from the wealth tax (ISF) indicate similar trends. See Chap. 14.
65. For many years the French inheritance tax data were among the best in the world. With this information it was possible to study the evolution of wealth concentration in France since the French Revolution (Chap. 4). After the inheritance tax was made progressive in 1901, the authorities published more detailed information on estate size, type of assets, age, kinship, and so on, from 1902 to 1964. Since the 1970s, however, the annual records have disappeared. The authorities now publish data only every four to five years, and the samples are too small and too mediocre in quality. As a result, we know less about inheritances in France today than we did a century ago. See the online appendix.
66. As is the case in Sweden since 2007 and Norway since 2014. The Nordic system for recording wealth, which used to be quite advanced, has been partially dismantled. The recent financial scandals may have begun to change this, but things are still far from where they should be. I will say more in Chap. 16 about the paradoxical situation of the Nordic countries.
68. See Piketty, Capital in the Twenty-First Century, pp. 440–447.
69. The ECB has done some work to correct its HFCS survey with information about billionaires taken from magazines. See, for example, P. Vermeulen, How Fat Is the Top Tail of the Wealth Distribution? (European Central Bank, ECB Working Paper 1692, 2014). The attempt is interesting, but the result is far from satisfactory. It would be much better if European governments, tax authorities, and statistical agencies provided systematic and accurate data rather than rely on press surveys.
70. For example, the Schumer-Heinrich bill—Measuring Real Income Growth Act, introduced in Congress in 2018—seeks to require the federal government to establish distributional national accounts.
71. In the United Kingdom the Reform Bill of 1832 (Chap. 5) made it clear that the right to vote was for men only, although there were (rare) cases of women who owned property (especially widows or single women) inscribed on voter lists in previous centuries, depending on local customs and power relations.
72. In some cases women’s suffrage was granted in stages. In the United Kingdom, for example, women over the age of 30 who met a property ownership condition obtained the right to vote in 1918; in 1928 the conditions were changed to be the same as for men (over the age of 21 and no property qualification).
73. See Piketty, Saez, and Zucman, “Distributional National Accounts,” fig. 7.
74. Unfortunately, limited access to sources means that we do not have perfectly comparable data for all countries. It is possible that more accurate data would reveal important differences. For instance, recent estimates for Brazil show that the proportion of women among the top income centile in the period 2000–2015 may be as high as 25–30 percent and hence significantly higher than in France or the United States. See M. Morgan, Essays on Income Distribution Methodological, Historical and Institutional Perspectives with Applications to the Case of Brazil (1926–2016) (PhD diss., Paris School of Economics and EHESS, 2018), p. 314, fig. 3.8.
75. See L. Beaman, R. Chattopadhyay, E. Duflo, R. Pande, and P. Topalova, “Powerful Women: Does Exposure Reduce Bias?” Quarterly Journal of Economics, 2009.
76. In self-employed occupations (farmer, craftsman, merchant), it was long the custom not to declare the wife’s work, even if she worked the same hours as her husband (in addition to her household work), so that women enjoyed no pensions and no social rights.
77. The widely reported estimates of male-female wage gaps for a particular job on the order of 15–20 percent tend to underestimate these inequalities because by definition they do not take into account the fact that men and women do not fill the same jobs. For profiles of male-female inequality by age from 1970 to 2015, see the online appendix, Fig. S13.11. See also B. Garbinti, J. Goupille-Lebret, and T. Piketty, “Income Inequality in France: Evidence from Distributional National Accounts,” WID.world, 2017 (also published in Journal of Public Economics, 2018), for detailed results.
78. See, for example, C. Goldin and L. Katz, The Most Egalitarian of All Professions: Pharmacy and Evolution of a Family-Friendly Occupation (National Bureau of Economic Research, NBER Working Paper 18410, 2012). On the role of family disruptions to career trajectories, see H. Kleven and C. Landais, “Gender Inequality and Economic Development: Fertility, Education and Norms,” Economica, 2017.
79. C. Bessière and S. Gollac, “Un entre-soi de possédant·e·s. Le genre des arrangements patrimoniaux dans les études notariales et cabinets d’avocat·e·s,” Sociétés contemporaines, 2017; C. Bessière, “Reversed Accounting. Legal Professionals, Families and the Gender Wealth Gap in France,” Socio-Economic Review, 2019.
80. N. Frémeaux, “The Role of Inheritance and Labor Income in Marital Choices,” Population, 2014.
81. See P. Mary, Inheritance and Marriage in Paris: An Estimation of Homogamy (1872–1912) (master’s thesis, Paris School of Economics and EHESS, 2018).
82. D. Yonzan, “Assortative Mating over Labor Income and Its Implication on Income Inequality: A US Perspective 1970–2017” (presentation, City University of New York, Inequality Seminar Series, 2018); B. Milanovic, Capitalism, Alone: The Future of the System That Rules the World (Belknap Press of Harvard University Press, 2019), p. 40, fig. 2.4.
83. In France, the default matrimonial regime (with marriage becoming less popular over time) is that community property is limited to goods acquired after marriage, which are shared equally (along with income) while property inherited or owned before the marriage remains separate. This asymmetry is usually justified by a strong division of labor and low professional income for the wife.
84. On these long-term evolutions, see N. Frémeaux and M. Leturcq, “Prenuptial Agreements and Matrimonial Property Regimes in France (1855–2010),” Explorations in Economic History, 2018; N. Frémeaux and M. Leturcq, “The Individualization of Wealth: Evidence from France” (Working Paper, 2016), https://
lagv2017 .sciencesconf .org /file /310896. 86. See Figs. 10.14–10.15.
87. J. Cagé and L. Gadenne, “Tax Revenues and the Fiscal Cost of Trade Liberalization, 1792–2006,” Explorations in Economic History, 2018.
89. In particular, the fact that the ECB’s balance sheet was twice that of the Fed on the eve of the crisis (a gap that continues to this day) mainly reflects the fact that banks and bank loans to firms play a more important role in financing the European economy (whereas the United States relies more on financial markets).
90. In large part this slow reaction by the ECB also explains the Eurozone debt crisis that began in 2009–2010 and the second dip in European economic activity in 2011–2012, while the US recovery continued. See Chap. 12 and the online appendix, Figs. S12.11–S12.12.
91. The ECB balance sheet was 4.7 trillion euros at the end of 2018 (or 40 percent of the Eurozone GDP, 11.6 trillion euros). For comparison, it was 1.5 trillion euros at the beginning of 2008, so 3.2 trillion euros were created in less than ten years. See the online appendix for detailed series.
92. It is interesting to note that the anti-liquidationist consensus of 2008 was in part a consequence of the “monetarist” reinterpretation of the crisis of 1929. In denouncing the Fed’s tight-money policy and ensuing deflation in the early 1930s, Milton Friedman concluded that a proper monetary policy (designed to ensure steady moderate inflation) would have sufficed to avoid the Depression and restart the economy. In other words, no need for the New Deal, Social Security, or the progressive income tax to regulate capitalism: a wise Fed should be enough. In the United States in the 1960s—while some Democrats dreamed of completing the work of the New Deal but many people were beginning to worry about the decline of the United States relative to a then rapidly growing Europe—this simple, powerful political message had an enormous impact. The work of Friedman and the Chicago School encouraged suspicion of the growing role of the state and influenced the climate that led to the conservative revolution of the 1980s. See M. Friedman and A. Schwartz, A Monetary History of the United States, 1857–1960 (Princeton University Press, 1963); and Piketty, Capital in the Twenty-First Century, pp. 547–553.
94. In practice, some private owners would want to keep what they own so that this policy would result in an enormous increase of asset prices and therefore creation of money in excess of what would be necessary to acquire all private wealth.
95. In Japan, public debt is more than 200 percent of GDP but is cross-held by various public agencies (especially retirement funds) and the central bank. In Switzerland, the central bank chose to deal with the enormous international demand for Swiss francs as a reserve asset (without any relation to the actual size of the Swiss economy) by creating a large amount of money to avoid an excessive appreciation of the exchange rate.
96. See A. Turner, Between Debt and the Devil: Money, Credit, and Fixing Global Finance (Princeton University Press, 2016). See also C. Durand, Le capital fictif. Comment la finance s’approprie notre avenir (Les prairies ordinaires, 2014); A. Tooze, Crashed: How a Decade of Financial Crisis Changed the World (Penguin, 2018).
97. The curve for the Eurozone in Fig. 13.13 actually depicts the Franco-German average for the period before 1999. This is broken down in Fig. S13.13 (online appendix). In 1956–1946, the Bank of France’s balance sheet was 80–90 percent of GDP and the Bundesbank’s was 40–50 percent. During each of the two world wars, direct loans to governments to finance the war played a central role in the evolution of central bank balance sheets. See, for example, E. Monnet, Controlling Credit: Central Banking and the Planned Economy in Postwar France, 1948–1973 (Cambridge University Press, 2018), p. 67, fig. 1. The key difference compared with the present period is that those loans went immediately to pay new expenses.
98. See Chap. 11 and the online appendix concerning returns on university endowments.
99. This is approximately the same level as previous budgets and as the budget currently under negotiation for the period 2021–2027. The EU budget is secondarily financed by a percentage of value-added tax revenues from each country and by meager customs fees levied on goods and services entering the European Union. See the online appendix.
100. See Chap. 10. In the nineteenth and early twentieth centuries, the US federal budget was about 2 percent of GDP (thus closer to the present-day EU than to the present US federal budget).
101. See the Evening Standard, May 24, 2013: “This is going to be our Zoo TV” (interview with the band Muse). In 2017 the singer Matt Bellamy declared that he had voted for Brexit.
102. The work is in three volumes: Rules and Order (published in 1973), The Mirage of Social Justice (1979), and The Political Order of a Free People (1979). It was then revised and republished as a single volume in 1982: F. Hayek, Law, Legislation and Liberty: A New Statement of the Liberal Principles of Justice and Political Economy (Routledge, 1982). Here I cite the 1982 edition.
103. See F. Hayek, The Constitution of Liberty (University of Chicago Press, 1960), vol. 7, pp. 430–450. Hayek noted that the income tax could be slightly progressive in order to compensate for the possible regressivity of indirect taxes, but no more than that, for fear of not knowing where to stop.
104. See Hayek, Law, Legislation and Liberty, vol. 1, pp. 83–144.
105. See Hayek, Law, Legislation and Liberty, vol. 3, pp. 109–132. Note that local governmental assemblies would be allowed to modify the general level of taxes, but only by applying a flat coefficient to the rules, rates, and tax brackets decided by the legislative assembly and hence without the ability to modify the relative rates applied to different social groups.
106. In numerous interviews given at the time, Hayek explained that he preferred an authoritarian regime such as Pinochet’s that respected the rules of economic liberalism and the rights of property more than a self-styled democratic regime that trampled on those rights. See, for example, the interview he gave to El Mercurio in April 1981: “Personally, I prefer a liberal dictatorship to a democratic government without liberalism.” See G. Chamayou, La société ingouvernable. Une généalogie du libéralisme autoritaire (La Fabrique, 2018), pp. 219–220.
107. See G. Todeschini, “Servitude et travail à la fin du Moyen Âge: la dévalorisation des ‘salariés’ et les pauvres peu méritants,” Annales. Histoire, Sciences Sociales, 2015. See also G. Todeschini, Au pays des sans-noms. Gens de mauvaise vie, personnes suspectes ou ordinaires du Moyen Âge à l’époque moderne (Verdier, 2015).
109. See C. Dunoyer, De la liberté du travail, ou simple exposé des conditions dans lesquelles les forces humaines s’expriment avec le plus de puissance (Guillaumin, 1845), pp. 382–383.
110. E. Boutmy, Quelques idées sur la création d’une Faculté libre d’enseignement supérieur (1871). See also P. Favre, “Les sciences d’Etat entre déterminisme et libéralisme. Emile Boutmy (1835–1906) et la création de l’Ecole libre des sciences politiques,” Revue française de sociologie, 1981.
111. See P. Bourdieu and J. P. Passeron, Les héritiers. Les étudiants et la culture (Minuit, 1964), p. 10.
114. It is generally accepted that Young’s droll yet profound fable marked the first use of the term “meritocracy.”
115. See Chap. 15. The irony is that Young was appointed to the House of Lords by the Labour government in 1978 and sat there until 2002 (while manifesting his opposition to Blairism).
116. Note that in the era of Le Transperceneige: Intégrale, the splendid graphic novel published by Jacques Lobb and J. M. Rochette (Casterman, 1984) and adapted for the screen as Snowpiercer (dir. Bong Joon-Ho [Radius-TWC, 2014]), climatic disasters were resolved by class struggle: the proletariat at the back of the bus has to get rid of the privileged to save humanity. In The Handmaid’s Tale, a novel published by Margaret Atwood (McClelland and Stewart, 1985) and adapted as a TV series in 2017 by Hulu, the United States establishes a theocratic dictatorship when fertility drops because of pollution and toxic waste. Mexicans and Canadians, long aware that their neighbors could be sanctimonious and at times oppressive, did not expect that they would go this far.
117. See Fig. 13.12 and Fig. 10.14.
118. See, for example, R. Reich, Just Giving: Why Philanthropy Is Failing Democracy and How It Can Do Better (Princeton University Press, 2018).
119. See J. Cagé, Le prix de la démocratie (Fayard, 2018), chap. 12; in English, The Price of Democracy, trans. P. Camiller (Harvard University Press, 2020).